
3.4: United States- Population and Religion (2 Days)
- Page ID
- 1952
- Explain the concepts of the cultural melting pot and the American Dream and how they have contributed to American society and culture.
- Describe the current demographic profile of the United States.
- Identify the size, distribution, and other characteristics of the Hispanic population in the United States.
- Explain the two most significant processes that led to the spatial distribution of African Americans in the United States.
- Describe the distribution of the dominant religious affiliations in the United States.
TEKS Regional Unit 03: Us and Canada: Chapter 3.1 Population and Religion in the USA
WG.6B Explain the processes that have caused changes in settlement patterns, including urbanization, transportation, access to and availability of resources, and economic activities.
WG.7A Analyze pyramids and use other data, graphics, and maps to describe the population characteristics of different societies and to predict future population trends
WG.7B Explain how physical geography and push and pull forces, including political, economic, social, and environmental conditions, affect the routes and flows of human migration.
WG.7C Describe trends in world population growth and distribution.
WG.7D Analyze how globalization affects connectivity, standard of living, pandemics, and loss of local culture.
WG.17B describe central ideas and spatial distribution of major religious traditions, including Buddhism, Christianity, Hinduism, Islam, Judaism, and Sikhism.
WG.17D Evaluate the experiences and contributions of diverse groups to multicultural societies.
Population and Religion in the United States
The American “Melting Pot”
Early immigration to America was dominated by people from the British Isles, resulting in an American population for whom speaking English and practicing Protestant Christianity was the norm. There were some regional exceptions to this, such as Catholicism in Maryland and the widespread speaking of German in Pennsylvania. However, English and Protestantism were standard in the American colonies. As migrants arrived in the United States from non-English-speaking countries, within a generation they learned English and assimilated into American society. This gave rise to the idea of the United States as a cultural melting pot.
People were drawn to the United States by the hope of economic opportunities. Most immigrants were poor and came to the United States to make a living and improve their way of life. They viewed assimilation into mainstream society as a necessity for success. They believed in the American Dream—that through hard work, you could achieve upward mobility and financial success no matter your background. This dream came true for millions of Americans.
According to the US Census Bureau Population Clock, the population of the United States is more than 325 million people. It is the third most populated country in the world after China and India. Among developed countries, the US population is one of the fastest growing, at about one percent each year. This is because of a fertility rate of approximately 2.1, which is higher than the 1.5 of most European countries. Another contributing factor is a positive net migration rate (more people immigrating to the United States than emigrating from it). In terms of human well-being, life expectancy is more than 78 years for men and 80 years for women. While this may seem high, especially when compared with a century ago, life expectancy in the United States is lower than in 49 other countries.
As a country of immigrants, the United States is home to people from all corners of the world as well as many ethnic minority groups. According to the 2010 census, the ethnic minority groups in the United States included 16.3 percent Hispanic, 12.6 percent African American, 5 percent Asian and Pacific Islander, and 1 percent Native American. [1] An interesting trend is that Asians are growing faster than any other ethnic group in California. The 2010 census reported that the Asian population in California had increased 31.5 percent since 2000, to a total of five million.
The Hispanic Population in the United States
One of the most striking shifts in immigration patterns of the past few decades has been the dramatic increase in Hispanic/Latino immigrants to the United States. There have long been Spanish speakers living in the United States (recall that Spain colonized Florida, Texas, and the Southwest before those regions became part of the United States). However, for most of American history, the Hispanic minority had little impact outside of a few areas of the country.
In 1970, Hispanics made up less than five percent of the US population. However, by 2010, 48 million Hispanics made up about 16 percent of the population (see the map below). For the first time, Hispanics were the largest ethnic minority in the United States, surpassing African Americans as the largest minority starting with the 2000 US census (12.5 percent Hispanic compared with 12.3 percent African American).
The US Hispanic population doubled between the 1990 and 2000 censuses. Between 2000 and 2006, Hispanic population growth accounted for about half the nation’s growth and grew about four times faster than the country’s population as a whole. The growth of the US Hispanic population is a direct result of increased immigration from Latin America to the United States in the late 20th and early 21st centuries [2] as well as the Hispanic population having higher fertility rates than the non-Hispanic US population. [3]
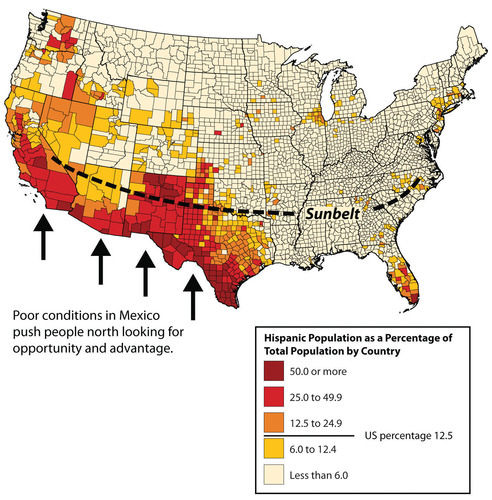
This map depicts the Hispanic population in the United States and the US Sun Belt.
Nearly half of the Hispanics in the United States live in California or Texas. There has been a large increase in the Hispanic population outside of those states in the past decade, especially in the South. For example, Arkansas, Georgia, Tennessee, North Carolina, and South Carolina have all experienced Hispanic population growth rates between 55 and 61 percent from 2000 to 2006.
All regions of the country saw double-digit growth rates of their Hispanic populations during that time. In places such as California, the large Hispanic population has an especially significant impact on the economy, politics, and every aspect of social life. More than one-third of Californians are Hispanic at 37 percent, while 42 percent are non-Hispanic white, and 7 percent are African American.
Who are the Hispanics living in the United States? Most were born in the United States (60 percent), while the rest are immigrants. Two-thirds are either from Mexico or of Mexican descent. Others are from the US territory of Puerto Rico, Cuba, or the Dominican Republic. Puerto Ricans are US citizens and can move to and from the US mainland without any special documentation requirements.
More Hispanics come from Central America than from South America. Hispanics work in all professions but are found in professions such as agriculture, construction, and food service at higher rates than the country’s non-Hispanic population.
The draw of opportunities and advantages has always pulled people toward the United States. While many of the Latin American immigrants enter the United States legally, according to the US Department of Homeland Security’s Office of Immigration Statistics, there were about 10.8 million undocumented immigrants living in the United States as of 2010. Sixty-two percent are from Mexico. [4] This number is lower than it was in previous years, possibly because of the economic recession and higher-than-usual rates of unemployment.

Data from the US Census Bureau, 1970, 1980, 1990, and 2000 Decennial Censuses; Population Projections, July 1, 2010, to July 1, 2050.
The U.S .and Mexico border is about 1,954 miles long and runs through an arid and open region between the two countries. The Chihuahuan Desert and the Sonoran Desert encompass much of the land separating the two countries, which is why it is difficult to control illegal immigration. Undocumented individuals will risk death crossing these deserts to find jobs in the United States. According to 2010 estimates, undocumented workers make up about five percent of the United States’ civilian workforce, including approximately 24 percent of the agricultural workforce.
The amount of earnings sent from undocumented workers in the United States to Mexico is estimated in the billions of dollars. This money from Mexican nationals living outside Mexico and sending money home to their families are Mexico’s second-largest source of foreign income. These payments are known as remittances. Without this money, many Mexican communities would have a hard time meeting their basic needs for survival.
The African American Population in the United States
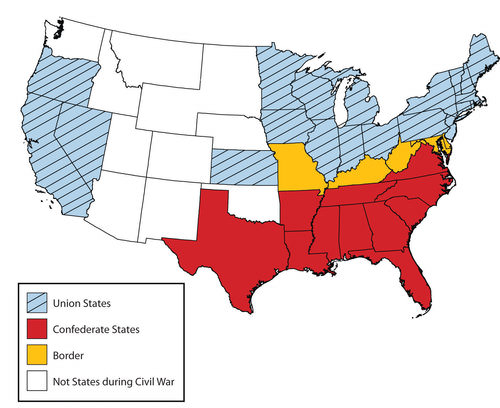
Most African Americans were concentrated in the South before the Civil War, where they worked as slaves in the cotton and tobacco plantations that supported the region. In some counties, African Americans made up most of the population, and this did not change when the war was over. Many of the newly freed slaves remained as poor agricultural workers in the South well into the 20th century. Even as late as 1910, seven out of every eight African Americans lived in the South.
In the late 19th and early 20th centuries, as the industrialization of northern cities was accelerating, the increased need for factory workers was largely met by immigration from Europe. However, when World War I began in 1914, European immigration began to slow down. European immigration almost came to a complete stop in the 1920s as Americans set quotas in place to reduce the number of Eastern European immigrants. At that time, the factories in the Manufacturing Belt continued to need workers. However, instead of European workers, they recruited African Americans from the South.
The need for workers led to a massive migration of African Americans from the South to cities in the North and West. This migration was so important in the history of the United States that it is called the Great Migration. Between 1910 and 1925, more than 10 percent of African Americans made the journey north and even more followed later. Examining the map below of the distribution of African Americans today shows the legacy of the Great Migration. Today, African Americans live in many parts of the United States, both in the South and in post-industrial cities of the north and the Midwest. They also now live in Sun Belt cities, as people of all races look for jobs related to the new information technologies and service industries.
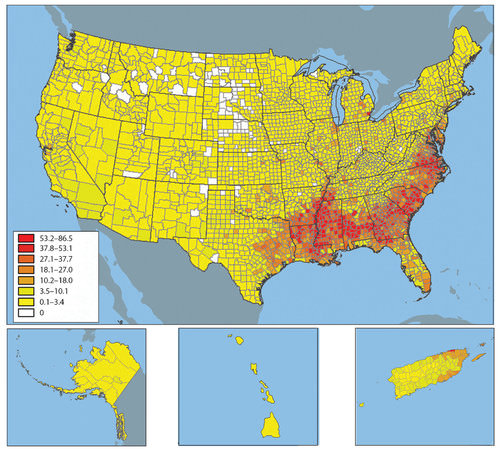
Black/African American Population by County, 2000.
Geography of Religion in the United States
Most early settlers to the United States were Protestant Christians. Puritans lived in New England and Anglicans (later called Episcopalians) lived in Virginia. Roman Catholic immigrants settled in Maryland, and members of the Society of Friends, also known as Quakers, founded Pennsylvania. Even within this overall picture, there was religious diversity in the United States. This diversity increased as new arrivals came from different countries with different religious backgrounds.
The current pattern of religious affiliation in the United States remains complex. You can find congregations of nearly every major religion, and many minor ones, in every area of the country. However, there are clear patterns to the geography of religion in the United States that tell stories of immigration and migration history, as well as stories about other aspects of American history.
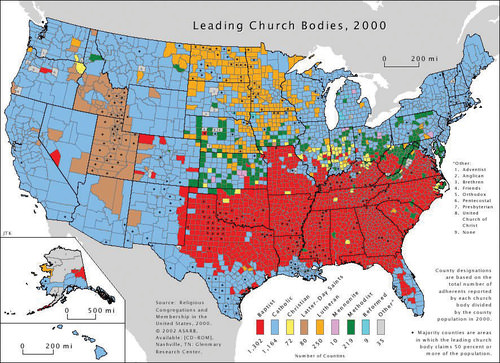
Distribution of Religious Organizations in the United States.
The most striking feature of the map above is the saturation of red in the Southeast in which Baptist churches are predominant. Although Baptist churches outnumber all of the other denominations in about 45 percent of all counties in the United States, most of those counties are found in the South. This region is known as the Bible Belt. It is a region in which churches, for the most part, teach a literal interpretation of the Bible. Baptist churches grew in popularity in the South after the Civil War. Whereas, other churches, such as the Methodists went into decline. Baptist churches are popular in the South amongst African Americans and whites.

Another Protestant region in the United States is in northern Appalachia and the lower Midwest from Ohio to Iowa and Kansas. As seen on the map, there are a variety of denominations. Some of the counties are Baptist, some are Methodist, and others are lesser known Christian churches, such as Disciples of Christ. The Methodist and other Christian areas were heavily influenced by the Second Great Awakening of the early 19th century, which promoted the theology that every person could be saved through revivals.
The movement provided for strong showings of Protestant denominations that arose during that time. The third Protestant region is the northern Midwest and Great Plains: Minnesota, the Dakotas, and surrounding areas. This was the destination of German and Scandinavian Lutheran settlers during the late 19th and early 20th centuries, and the leading denominations today in much of that area remain Lutheran.
The Roman Catholic Church, which is the leading religious body in 40 percent of US counties, is well-represented in the Northeast, West, and Southwest. In the Northeast and Midwest, the Catholic dominance points to 19th and early 20th-century immigration from Roman Catholic countries in Europe such as Italy, Ireland, and Poland. Those earlier Catholics have been joined more recently by large numbers of Hispanic immigrants. The dominance of Roman Catholics in the western United States, the Southwest, and even Florida in the Southeast are a reflection of the strong Hispanic presence in those parts of the country.
In the western United States, the Church of Jesus Christ of Latter-Day Saints (Mormon church) dominates the region including Utah and surrounding states close to the Utah border. Utah was the destination of Mormons as they migrated westward during the mid 19th century.
Major urban centers are home to people who follow all the major religions of the world. Muslim populations are found in cities as a result of late 20th century immigrants arriving from countries such as India, Pakistan, and places in the Middle East and moving to urban areas for employment. Detroit and its surrounding counties in southeastern Michigan are one part of the country with a high concentration of Muslim immigrants.
- US immigrants learned English and assimilated into American society, giving rise to the idea of the United States as a cultural melting pot.
- Immigrants created the American Dream—the idea that by working hard and following the rules, one could achieve upward mobility and financial success regardless of one’s background or heritage.
- The Hispanic population is the largest minority group in the United States, and its population is growing.
- Hispanics have an especially strong presence in California and Texas, but are found all over the South as well as in rural and urban areas around the country.
- One-third of Hispanics are immigrants to the United States, and most undocumented workers to the United States are Hispanic.
- Mexican nationals are important to the US workforce, and they send home billions of dollars each year.
- African Americans are heavily represented in former plantation agricultural states of the South, as well as in cities of the Rust Belt and far West.
- Patterns of religious observance in the United States reflect immigration patterns.
Vocabulary Terms
| animistic | The belief that all things found in nature have a spirit |
| carrying capacity | The number of organisms a piece of land can support without negative effects |
| cultural diffusion | The spread of cultural beliefs and social activities from one group to another |
| cultural hearth | A region where cultural traits developed; a site of innovation from which basic ideas, materials, and technology diffuse to many cultures |
| cultural innovation | The use of existing technology to create something new |
| cultural trait | The single elements of normal practice in a culture--Ex: private space, hand gestures, eye contact, greetings |
| dependency ratio | The number of people too old to work (64+) to the number of people too young to work (-15) compared to the number of people active in the labor force |
| dialect | A regional variation of a language distinguished by vocabulary, spelling and pronunciation |
| doubling time | The number of years needed to double a population, assuming a constant rate of natural increase |
| ethnic religion | A religion with a relatively concentrated spatial distribution whose principles are likely to be based on the physical characteristics of the particular location in which its adherents are concentrated |
| globalization | Actions or processes that involve the entire world and result in making something worldwide in scope |
| monotheistic | The doctrine or belief in the existence of only one god |
| polytheistic | Belief in or worship of more than one god |
| pull factor | Factors that attract people to another location. EX: good economic opportunities, high salaries, favorable climate |
| push factor | Factors that cause people to leave their homeland and migrate to another region. EX: drought, other natural disasters, war, religious or ethnic persecution |
| society | An extended social group having a distinctive cultural and economic organization |
| universalizing religion | A religion that attempts to appeal to all people, not just those living a particular location |
Applying Knowledge
Interactive Notebook Activities
- Describe the current demographic profile of the United States.
- Identify the size, distribution, and other characteristics of the Hispanic population in the United States.
- Explain the two most significant processes that led to the spatial distribution of African Americans in the United States.
- Describe the distribution of the dominant religious affiliations in the United States.
Discussion and Study Questions
- Why has the United States been called a melting pot? What are the largest minority groups in the country?
- What parts of the United States have the highest representation of the four largest minority groups?
- How did the U.S Hispanic population change in size and location from 2000 to 2010? Why is the Hispanic population growing faster than other ethnic groups in the United States?
- What two states have about 50 percent of the Hispanic population?
- What have been the push-pull factors for Hispanic immigration to the United States?
- What is a remittance, and how are remittances significant for immigrants to the United States?
- Describe the spatial pattern of the African American population. Why do so many blacks live in the Southeast?
- What was the Great Migration, and what were some of its long-term impacts on the United States?
- List three of the main Protestant religious denominations in the United States, describe their spatial patterns, and explain what caused these patterns.
- Name the states or provinces that have high percentages of Catholics.
Mapping Exercise
We The People: Students will explain where philosophical ideals regarding our government originated, and how they have been incorporated into the US Constitution.
Language and Religion: Students will explore patterns of cultural diffusion through linguistic and religious data. The activity uses a web-based map
Videos for Geography Enrichment
Helpful Websites in the Study of Geography
Canadian Encyclopedia is an encyclopedia funded by the Canadian government covering all branches of knowledge. Their scholarly collection includes interactive materials.
CIA World Factbook provides information on the people, history, government, economy, energy, geography, communications, transportation, military, and transnational issues for the world's entities.
Congress.gov is a US government website where you can find federal legislation, past and present, as well as information about the US legal system.
Drug Enforcement Administration (DEA) is a government agency website that provides current news, resources, topics of interest, information about drugs, careers in the DEA, and a tip hotline.
Library of Congress is the largest library in the world and provides manuscripts, files, information, pictures, and videos.
NASA Earth Observatory (NEO) is a US government agency website that allows users to search for and retrieve satellite images of Earth.
National Archives is a US government website that provides historical documents, photos, records, publications, and educator resources.
National Oceanic and Atmospheric Association (NOAA) is a US government agency website that provides weather-related information and ocean research.
National Map is a website by the United States Geological Survey and other federal, state, and local agencies that deliver topographic information for the United States.
NationMaster is a massive central data source and a handy way to graphically compare nations.
Real-Time World Air Quality Index is a website that measures most locations in the world for air pollution in real time.
StateMaster is a unique statistical database, which allows you to research and compare a multitude of different data on US states.
United Nations (UN) is an international organization founded in 1945 and made up of 193 member states. The UN maintains international peace and security, protects human rights, delivers humanitarian aid, promotes sustainable development, and upholds international law.
United States Census Bureau is a US government agency that provides a population clock, data, surveys, statistics, a library with information and infographics, news about the economy, and much more.
United States Geological Survey (USGS) is a US government agency website that provides scientific information about the natural hazards that threaten lives, the natural resources we rely on, the health of our ecosystems and environment, and the impacts of climate and land-use change.
Whitehouse.gov is a US government website that provides the latest presidential news, information about the budget, policy, defense, and many more topics.
World Health Organization (WHO) is under the United Nations and provides leadership on matters critical to health, shapes the research agenda on health, and monitors the health situation and assessing health trends around the world. Their website provides information on the state of health around the world, outbreaks, current health news, and more.
World Trade Organization (WTO) is an intergovernmental organization that regulates international trade. The website provides information on the history of the multilateral trading system, featured videos, news and events, trade topics, and more.
References
[1] “2010 Census Data,” US Census Bureau,
[2] Michael Hoefer, Nancy Rytina, and Bryan C. Baker, “Estimates of the Unauthorized Immigrant Population Residing in the United States: January 2008,”
[3] Randal C. Archibold, “Arizona Enacts Stringent Law on Immigration,”
[4] “Immigration Statistics,” US Department of Homeland Security
| Image | Reference | Attributions |
|
[Figure 1] | Credit: Map courtesy of NationalAtlas. Source: open.lib.umn.edu/worldgeography/wp-content/uploads/sites/181/2016/04/c8f2929bbe5a39b99f258c695dbbf3c2.jpg License: CC BY-NC 3.0 |
|
[Figure 2] | Credit: US Census Bureau Source: open.lib.umn.edu/worldgeography/wp-content/uploads/sites/181/2016/04/c1985bb3dbe1d9c2b2e08363d845c3eb.jpg License: CC BY-NC 3.0 |
|
[Figure 3] | Credit: http://open.lib.umn.edu/worldgeograp...es-and-canada/ Source: open.lib.umn.edu/worldgeography/wp-content/uploads/sites/181/2016/04/1256ddf849dc016f83c9dea79ae60041.jpg License: CC BY-NC 3.0 |
|
[Figure 4] | Credit: Map courtesy of NationalAtlas. Source: open.lib.umn.edu/worldgeography/wp-content/uploads/sites/181/2016/04/2bd17a1216ec0694e3ec0e8bdb84c5eb.jpg License: CC BY-NC 3.0 |
|
[Figure 5] | Credit: Wikimedia Commons – public domain. Source: open.lib.umn.edu/worldgeography/wp-content/uploads/sites/181/2016/04/38b2b4f0a71dc29732dc7b6b35f99363.jpg License: CC BY-NC 3.0 |
|
[Figure 6] | Credit: Photo by R. Berglee – CC BY-NC-SA. Source: open.lib.umn.edu/worldgeography/wp-content/uploads/sites/181/2016/04/3bc6d088a3a5b3dea4f15370e3684866.jpg License: CC BY-NC 3.0 |