
4.1.6: Graphs Based on Rules
- Page ID
- 4309
Graphs of Functions based on Rules
Of course, we can always make a graph from a function rule by substituting values in for the variable and getting the corresponding output value.
Graphing a Function based on Rules
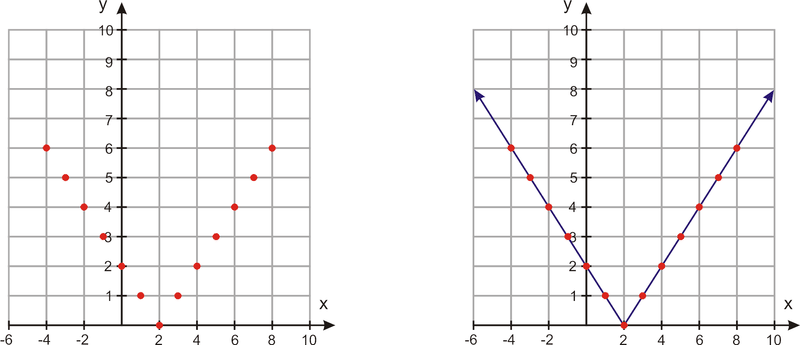
1. Graph the following function: f(x)=|x−2|
Make a table of values. Pick a variety of negative and positive values for x. Use the function rule to find the value of y for each value of x. Then, graph each of the coordinate points.
| x | y=f(x)=|x−2| |
|---|---|
| -4 | |-4−2|=|-6|=6 |
| -3 | |-3−2|=|-5|=5 |
| -2 | |-2−2|=|-4|=4 |
| -1 | |-1−2|=|-3|=3 |
| 0 | ∣0−2∣=∣−2∣=2 |
| 1 | ∣1−2∣=∣−1∣=1 |
| 2 | ∣2−2∣=∣0∣=0 |
| 3 | ∣3−2∣=∣1∣=1 |
| 4 | ∣4−2∣=∣2∣=2 |
| 5 | ∣5−2∣=∣3∣=3 |
| 6 | ∣6−2∣=∣4∣=4 |
| 7 | ∣7−2∣=∣5∣=5 |
| 8 | ∣8−2∣=∣6∣=6 |
It is wise to work with a lot of values when you begin graphing. As you learn about different types of functions, you will start to only need a few points in the table of values to create an accurate graph.
2. Graph the following function: f(x)=√x
Make a table of values. We know x can’t be negative because we can't take the square root of a negative number. The domain is all positive real numbers, so we pick a variety of positive integer values for x. Use the function rule to find the value of y for each value of x.
| x | y=f(x)=√x |
|---|---|
| 0 | √0=0 |
| 1 | √1=1 |
| 2 | √2≈1.41 |
| 3 | √3≈1.73 |
| 4 | √4=2 |
| 5 | √5≈2.24 |
| 6 | √6≈2.45 |
| 7 | √7≈2.65 |
| 8 | √8≈2.83 |
| 9 | √9=3 |

Note that the range is all positive real numbers.
Real-World Application
The post office charges 41 cents to send a letter that is one ounce or less and an extra 17 cents for each additional ounce or fraction of an ounce. This rate applies to letters up to 3.5 ounces.
Make a table of values. We can’t use negative numbers for x because it doesn’t make sense to have negative weight. We pick a variety of positive values for x, making sure to include some decimal values because prices can be decimals too. Then we use the function rule to find the value of y for each value of x.
x 0 0.2 0.5 0.8 1 1.2 1.5 1.8 2 2.2 2.5 2.8 3 3.2 3.5
y 0 41 41 41 41 58 58 58 58 75 75 75 75 92 92

Example
Example 4.1.6.1
Graph the following function: f(x)=√(x2)
Solution
Make a table of values. Even though x can’t be negative inside the square root, because we are squaring x first, the domain is all real numbers. So we integer values for x which are on either side of zero. Use the function rule to find the value of y for each value of x.
| x | y=f(x)=x2−−√ |
|---|---|
| -2 | √((−2)2)=2 |
| -1 | √((−1)2)=1 |
| 0 | √(02)=0 |
| 1 | √(12)=1 |
| 2 | √(22)=2 |

Note that the range is all positive real numbers, and that this looks like an absolute value function.
Review
Graph the following functions.
- Vanson spends $20 a month on his cat.
- Brandon is a member of a movie club. He pays a $50 annual membership and $8 per movie.
- f(x)=(x−2)2
- f(x)=3.2x
- f(t)=27t−t2
- f(w)=(w/4)+5
- f(x)=t+2t2+3t3
- f(x)=(x−1)(x+3)
- f(x)=(x/3)+(x2/5)
- f(x)=√2x
Review (Answers)
To view the Review answers, open this PDF file and look for section 1.13.
Vocabulary
| Term | Definition |
|---|---|
| Coordinate Plane | The coordinate plane is a grid formed by a horizontal number line and a vertical number line that cross at the (0, 0) point, called the origin. The coordinate plane is also called a Cartesian Plane. |
| coordinate point | A coordinate point is the description of a location on the coordinate plane. Coordinate points are written in the form (x, y) where x is the horizontal distance from the origin, and y is the vertical distance from the origin. |
| Function | A function is a relation where there is only one output for every input. In other words, for every value of x, there is only one value for y. |
| quadrant | A quadrant is one-fourth of the coordinate plane. The four quadrants are numbered using Roman Numerals I, II, III, and IV, starting in the top-right, and increasing counter-clockwise. |
Additional Resources
PLIX: Play, Learn, Interact, eXplore: Plotting Profits
Video: Solving Real-World Problems Using Graphs of Functions - Overview
Practice: Graphs Based on Rules
Real World Application: Population Explosion