
4.7.6: Linear Interpolation and Extrapolation
- Page ID
- 4334
Linear Interpolation and Extrapolation
Suppose that you've plotted a number of data points on a coordinate plane, with the x−coordinate of each data point representing the number of months since you've planted a tree, and the y− coordinate of each point representing the tree's height in meters. If you have data for 1 month, 2 months, 3 months, and 4 months, do you think you could guess what the tree's height will be at 5 months? How about what the tree's height was at 2.5 months?
Predicting with Linear Equations
Numerical information appears in all areas of life. You can find it in newspapers, in magazines, in journals, on the television, or on the Internet. In the Fitting Lines to Data Concept, you saw how to find the equation of a line of best fit. Using a line of best fit is a good method if the relationship between the dependent and independent variables is linear. Not all data fits a straight line, though. This Concept will show other methods to help estimate data values. These methods are useful in both linear and non-linear relationships.
Linear interpolation is useful when looking for a value between given data points. It can be considered as “filling in the gaps” of a table of data. The strategy for linear interpolation is to use a straight line to connect the known data points on either side of the unknown point. Linear interpolation is often not accurate for non-linear data. If the points in the data set change by a large amount, linear interpolation may not give a good estimate.
Linear extrapolation can help us estimate values that are either higher or lower than the values in the data set. Think of this as “the long-term estimate” of the data. The strategy for linear extrapolation is to use a subset of the data instead of the entire data set. This is especially true for non-linear data you will encounter in later lessons. For this type of data, it is sometimes useful to extrapolate using the last two or three data points in order to estimate a value higher than the data range.
Collecting and Organizing Data
Data can be collected through various means, including surveys or experiments. A survey is a data collection method used to gather information about individuals’ opinions, beliefs, or habits while an experiment is a controlled test or investigation. The information collected by the U.S. Census Bureau or the Center for Disease Control are examples of data gathered using surveys. The U.S. Census Bureau collects information about many aspects of the U.S. population.
Let’s say we are interested in how the median age for first marriages has changed during the 20th century. The U.S. Census provides the following information about the median age at first marriage for males and females. Below is the table of data and its corresponding scatter plot.

Median Age of Males and Females at First Marriage by Year
| Year | Median Age of Males | Median Age of Females |
|---|---|---|
| 1890 | 26.1 | 22.0 |
| 1900 | 25.9 | 21.9 |
| 1910 | 25.1 | 21.6 |
| 1920 | 24.6 | 21.2 |
| 1930 | 24.3 | 21.3 |
| 1940 | 24.3 | 21.5 |
| 1950 | 22.8 | 20.3 |
| 1960 | 22.8 | 20.3 |
| 1970 | 23.2 | 20.8 |
| 1980 | 24.7 | 22.0 |
| 1990 | 26.1 | 23.9 |
| 2000 | 26.8 | 25.1 |

Let's estimate the median age for the first marriage of a male in the year 1946:
We will first use the method of interpolation because there is a “gap” needing to be filled. 1946 is between 1940 and 1950, so these are the data points we will use.

By connecting the two points, an equation can be found.
m=(22.8−24.3)/(1950−1940)=−1.5/10=−0.15 Slope
y=−0.15x+b
24.3=−0.15(1940)+b
b=315.3
y=−0.15x+315.3 Equation
To estimate the median age of marriage of males in the year 1946, substitute x=1946 into the equation.
y=−0.15(1946)+315.3=23.4 years old
Now, let's estimate the median age for the first marriage of a female in the year 1968:
Use the method of interpolation to create a line that approximates the values between 1960 and 1970, since 1968 is between those years. We will use the data points (1960, 20.3) and (1970, 20.8) as two points defining a line.
m=(20.8−20.3)/(1970−1960)=.5/10=0.05 Slope
y=0.05x+b
20.3=0.05(1960)+b
b=−77.7
y=0.05x−77.7 Equation
To estimate the median age of marriage of females in the year 1968, substitute x=1968 into the equation.
y=0.05(1968)−77.7=20.7 years old
Predicting Using an Equation
When linear interpolation and linear extrapolation do not produce accurate predictions, using the line of best fit (linear regression) may be the best choice. The “by hand” and calculator methods of determining the line of best fit were presented in the last Concept.
Let's solve the following problem using an equation:
The world-record times for the women’s 100-meter race are given in the following table. Estimate the world-record time in the year 2010. Is this a good estimate?
World Record Times for the Women’s 100-meter Race by Year
| Winner | Ctry. | Year | Seconds | Winner | Ctry. | Year | Seconds |
|---|---|---|---|---|---|---|---|
| Mary Lines | UK | 1922 | 12.8 | Vera Krepkina | Sov. | 1958 | 11.3 |
| Leni Schmidt | Germ. | 1925 | 12.4 | Wyomia Tyus | USA | 1964 | 11.2 |
| Gertrurd Glasitsch | Germ. | 1927 | 12.1 | Barbara Ferrell | USA | 1968 | 11.1 |
| Tollien Schuurman | Neth. | 1930 | 12.0 | Ellen Strophal | E. Germ. | 1972 | 11.0 |
| Helen Stephens | USA | 1935 | 11.8 | Inge Helten | W. Germ. | 1975 | 11.0 |
| Lulu Mae Hymes | USA | 1939 | 11.5 | Marlies Gohr | E. Germ. | 1982 | 10.9 |
| Fanny Blankers-Koen | Neth. | 1943 | 11.5 | Florence Griffith Joyner | USA | 1988 | 10.5 |
| Marjorie Jackson | Austr. | 1952 | 11.4 |
Start by making a scatter plot of the data. Connect the last two points on the graph and find the equation of the line.

m=(10.5−10.9)/(1988−1982)=−0.4/6=−0.067 Slope
y=−0.067x+b
10.5=−0.067(1988)+b
b=143.7
y=−0.067x+143.7 Equation
The world record time in year 2010 is estimated to be: y=−0.067(2010)+143.7=9.03 seconds.
How accurate is this estimate? It is likely that it's not very accurate because 2010 is a long time from 1988. This example demonstrates the weakness of linear extrapolation. Estimates given by linear extrapolation are never as good as using the equation from the line of best fit method. In this particular example, the last data point clearly does not fit in with the general trend of the data, so the slope of the extrapolation line is much steeper than it should be.
As a historical note, the last data point corresponds to the world record time for Florence Griffith Joyner in 1988. After her race, she was accused of using performance-enhancing drugs, but this fact was never proven. In addition, there is a question about the accuracy of the timing because some officials said that the tail wind was not accounted for in this race, even though all the other races of the day were impacted by a strong wind.
Examples
Example 4.7.6.1
Earlier, you were told that you have data plotted on a coordinate plane and that the x−coordinates represent the number of months since you've planted a tree and the y−coordinates represent the tree's height in meters. If you have data for 1 month, 2 months, 3 months, and 4 months, can you guess what the tree's height will be at 5 months? How about what the tree's height was at 2.5 months?
Solution
Yes, you can guess what the height's tree will be at both 5 months and 2.5 months.
To guess the height at 5 months you can use linear extrapolation because the data point is higher than the values in the given data set. The best way to do this is by using the data points for 1 and 4 months to write a general equation for the line. Then, plug in 5 to find the height. As stated in this Concept, this estimate is likely not very accurate.
To guess what the height of the tree at 2.5 months was, you can use linear interpolation because 2.5 months is between two of the data points we are given, 2 months and 3 months. We are trying to fill in the gap so it will be interpolation. The best way to do this is by using the data points from 2 months and 3 months to write an equation and then plug in 2.5 to find the height.
Example 4.7.6.2
The Center for Disease Control (CDC) has the following information regarding the percentage of pregnant women smokers organized by year. Estimate the percentage of pregnant women that were smoking in the year 1998.
Solution
| Year | Percent |
|---|---|
| 1990 | 18.4 |
| 1991 | 17.7 |
| 1992 | 16.9 |
| 1993 | 15.8 |
| 1994 | 14.6 |
| 1995 | 13.9 |
| 1996 | 13.6 |
| 2000 | 12.2 |
| 2002 | 11.4 |
| 2003 | 10.4 |
| 2004 | 10.2 |
Percent of Pregnant Women Smokers by Year
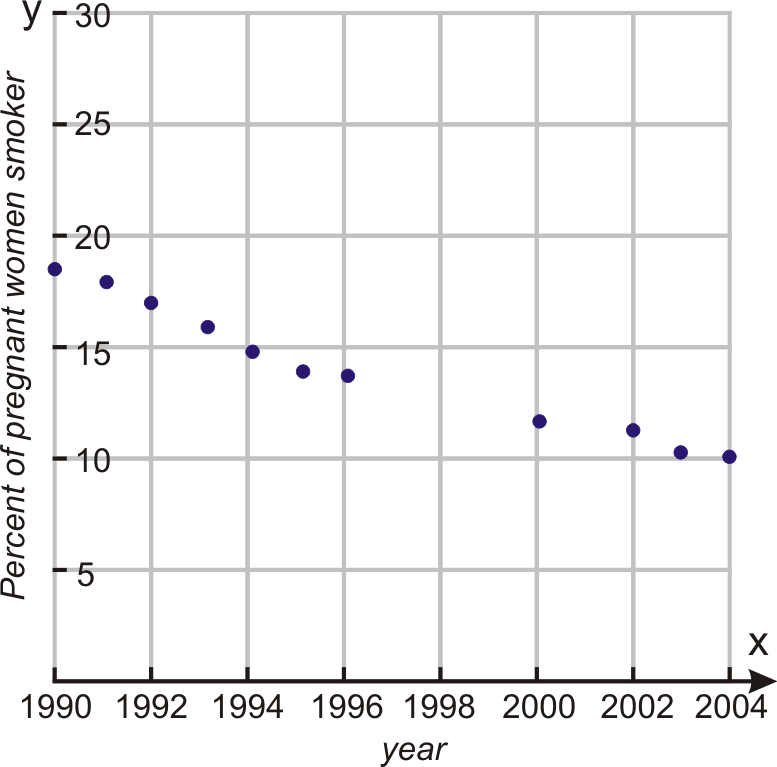
We want to use the information close to 1998 to interpolate the data. We do this by connecting the points on either side of 1998 with a straight line and find the equation of that line.
m=(12.2−13.6)/(2000−1996)=−1.4/4=−0.35 Slope
y=−0.35x+b
12.2=−0.35(2000)+b
b=712.2
y=−0.35x+712.2 Equation
To estimate the percentage of pregnant women who smoked in the year 1998, substitute x=1998 into the equation.
y=−0.35(1998)+712.2=12.9%
Review
- What does it mean to interpolate the data? In which cases would this method be useful?
- How is interpolation different from extrapolation? In which cases would extrapolation be more beneficial?
- What was the problem with using the interpolation method to come up with an equation for the women’s world record times?
- Use the World Record Times data and determine an equation for the line of best fit.
- Use the Median Age at First Marriage data to estimate the age at marriage for females in 1946. Fit a line, by hand, to the data before 1970.
- Use the Median Age at First Marriage data to estimate the age at marriage for females in 1984. Fit a line, by hand, to the data from 1970 on in order to estimate this accurately.
- Use the Median Age at First Marriage data to estimate the age at marriage for males in 1995. Use linear interpolation between the 1990 and 2000 data points.
- Use the data from Pregnant Women and Smoking to estimate the percent of pregnant smokers in 1997. Use linear interpolation between the 1996 and 2000 data points.
- Use the data from Pregnant Women and Smoking to estimate the percent of pregnant smokers in 2006. Use linear extrapolation with the final two data points.
- Use the World Record Times data to estimate the world record time for the female 100-meter race in 1920. Use linear extrapolation because the first two or three data points have a different slope than the rest of the data.
- The table below shows the highest temperature vs. the hours of daylight for the 15th day of each month in the year 2006 in San Diego, California. Using linear interpolation, estimate the high temperature for a day with 13.2 hours of daylight.
| Hours of daylight | High temperature (F) |
|---|---|
| 10.25 | 60 |
| 11.0 | 62 |
| 12 | 62 |
| 13 | 66 |
| 13.8 | 68 |
| 14.3 | 73 |
| 14 | 86 |
| 13.4 | 75 |
| 12.4 | 71 |
| 11.4 | 66 |
| 10.5 | 73 |
| 10 | 61 |
- Use the table above to estimate the high temperature for a day with 9 hours of daylight using linear extrapolation. Is the prediction accurate? Find the answer using the line of best fit.
Review (Answers)
To see the Review answers, open this PDF file and look for section 5.11.
Vocabulary
| Term | Definition |
|---|---|
| experiment | An experiment is a controlled test or investigation. |
| linear extrapolation | Linear extrapolation uses a subset of the data instead of the entire data set. For this type of data, it is sometimes useful to extrapolate using the last two or three data points in order to estimate a value higher than the data range. |
| linear interpolation | Linear interpolation uses a straight line to connect the known data points on either side of the unknown point. It can be considered as filling in the gaps of a table of data. |
| survey | A survey is a data collection method used to gather information about individuals’ opinions, beliefs, or habits. |
Additional Resources
Video:
Activity: Linear Interpolation and Extrapolation Discussion Questions
Practice: Linear Interpolation and Extrapolation
Real World Application: Malthusian Mistake