
1.2.1: Minimums and Maximums
- Page ID
- 14127
Maximums and Minimums
When riding a roller coaster there is always one point that is the absolute highest off the ground. There are usually many other places that reach fairly high, just not as high as the first. There are also places where the roller coaster dips with one being the absolute lowest the roller coaster can go. How do you identify and distinguish between these different peaks and valleys in a precise way?
Finding Maximums and Minimums
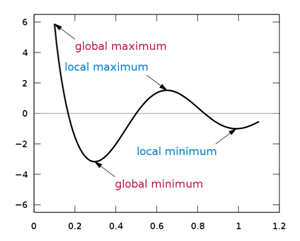
A global maximum refers to the point with the largest y value possible on a function. A global minimum refers to the point with the smallest y value possible. Together these two values are referred to as global extrema. There can only be one global maximum and only one global minimum. Global refers to entire space where the function is defined. Global extrema are also called absolute extrema.
In addition to global maximums and global minimums, there are also local extrema or relative maximums and relative minimums. The word relative is used because in relation to some neighborhood, these values stand out as being the highest or the lowest.
 [Figure1]
Calculus uses advanced analytic tools to compute extreme values, but for the purposes of PreCalculus it is sufficient to be able to identify and categorize extreme values graphically or through the use of technology. For example, the TI-84 has a maximum finder when you select <2nd> then <trace>.
Examples
Solution
Earlier, you were asked to identify and distinguish between different peaks and valleys on a graph. Maximums and minimums should be intuitive because they simply identify the highest points and the lowest points, or the peaks and the valleys, in a graph. There is a formal distinction about whether a maximum is the highest on some local open interval (does not matter how small), or whether it is simply the highest overall.
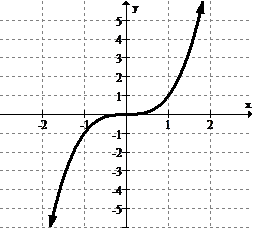
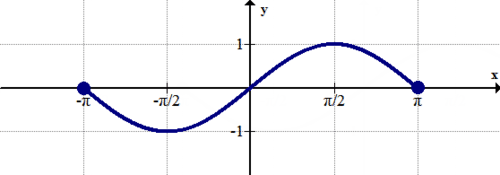
Identify and categorize all extrema.
 [Figure2]
Solution
There are no global or local maximums or minimums. The function flattens, but does not actually reach a peak or a valley.
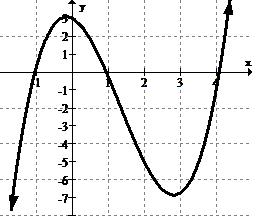
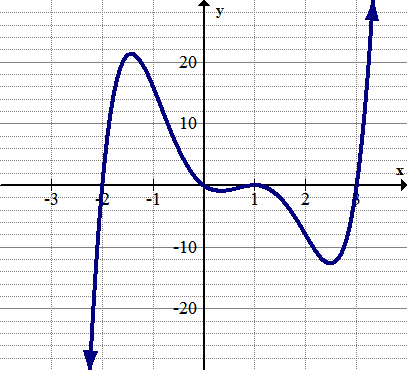
Identify and categorize all the extrema in the graph below:
 [Figure3]
Solution
Since the function appears from the arrows to increase and decrease beyond the display, there are no global extrema. There is a local maximum at approximately (0, 3) and a local minimum at approximately (2.8, -7).
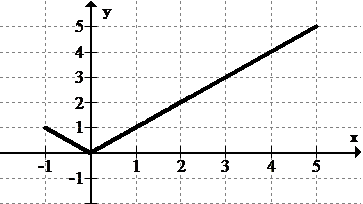
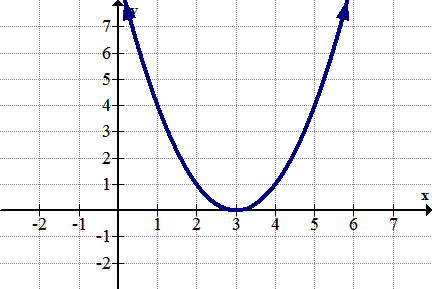
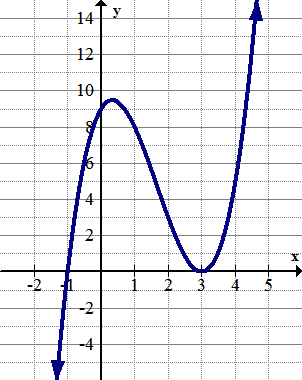
Identify and categorize all the extrema in the graph below:
 [Figure4]
Solution
Since the function seems to abruptly end at the end points and does not go beyond the display, the endpoints are important.
There is a global minimum at (0, 0). There is a local maximum at (-1, 1) and a global maximum at (5, 5).
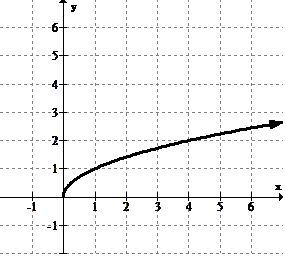
Identify and categorize all the extrema in the graph below:
 [Figure5]
Solution
Since this function appears to increase to the right as indicated by the arrow there is no global maximum. There are not any other high points either, so there are no local maximums. There is only the end point at (0, 0) which is a global minimum.
Review
Use the graph below for 1-2.
 [Figure6]
1. Identify any global extrema.
2. Identify any local extrema.
Use the graph below for 3-4.
 [Figure7]
3. Identify any global extrema.
4. Identify any local extrema.
Use the graph below for 5-6.
 [Figure8]
5. Identify any global extrema.
6. Identify any local extrema.
Use the graph below for 7-8.
 [Figure9]
7. Identify any global extrema.
8. Identify any local extrema.
Use the graph below for 9-10.
 [Figure10]
9. Identify any global extrema.
10. Identify any local extrema.
11. Explain the difference between a global maximum and a local maximum.
12. Draw an example of a graph with a global minimum and a local maximum, but no global maximum.
13. Draw an example of a graph with local maximums and minimums, but no global extrema.
14. Use your graphing calculator to identify and categorize the extrema of:
\(\ f(x)=\frac{1}{2} x^{4}+2 x^{3}-6.5 x^{2}-20 x+24\)
15. Use your graphing calculator to identify and categorize the extrema of:
g(x)=−x4+2x3+4x2−2x−3.
Vocabulary
| Term | Definition |
|---|---|
| absolute extrema | The absolute extrema of a function are the points with the y values that are the highest or the lowest of the entire function. |
| End behavior | End behavior is a description of the trend of a function as input values become very large or very small, represented as the 'ends' of a graphed function. |
| Function | A function is a relation where there is only one output for every input. In other words, for every value of x, there is only one value for y. |
| global extrema | The global extrema of a function are the points with the y values that are the highest or the lowest of the entire function. |
| local extrema | The local extrema of a function are the points of the function with y values that are the highest or lowest of a local neighborhood of the function. |
| Local Maximum | A local maximum is the highest point relative to the points around it. A function can have more than one local maximum. |
| Local Minimum | A local minimum is the lowest point relative to the points around it. A function can have more than one local minimum. |
| Maximum | The maximum is the highest point of a graph. The maximum will yield the largest value of the range. |
| Minimum | The minimum is the lowest point of a graph. The minimum will yield the smallest value of the range. |
| relative extrema | The relative extrema of a function are the points of the function with y values that are the highest or lowest of a local neighborhood of the function. |
Image Attributions
- [Figure 1]
Credit: CK-12 Foundation;European Environment Agency
Source: http://www.eea.europa.eu/data-and-maps/figures/atmospheric-concentration-of-co2-ppm-1;CK-12 Foundation
License: CC BY-SA - [Figure 2]
Credit: CK-12 Foundation
Source: http://colouringbook.org/art/svg/coloring-book/roller-coaster-coloring-book-colouring-coloring-book-colouring-book-colouringbook-org-art-clip-art-clipart-clipartist-net-openclipart-org-scalable-vector-graphics-svg/
License: CC BY-SA - [Figure 3]
Credit: CK-12 Foundation
License: CC BY-SA - [Figure 4]
Credit: CK-12 Foundation
License: CC BY-SA - [Figure 5]
Credit: CK-12 Foundation
License: CC BY-SA - [Figure 6]
Credit: CK-12 Foundation
License: CC BY-SA - [Figure 7]
Credit: CK-12 Foundation
License: CC BY-SA - [Figure 8]
Credit: CK-12 Foundation
License: CC BY-SA - [Figure 9]
Credit: CK-12 Foundation
License: CC BY-SA - [Figure 10]
Credit: CK-12 Foundation
License: CC BY-SA