
1.7.1: Linear and Quadratic Models
- Page ID
- 14146
Linear and Quadratic Models
Learning to express real-life situations as mathematical functions allows seemingly complex ideas and actions to be broken down into smaller, simpler parts and analyzed.
How might you express the following mathematically?
Two brothers decide to race home from school, taking different routes. The second brother leaves 5 minutes after the first, and both arrive at home at the same time.
Linear and Quadratic Models
Linear Models
The simplest functions are generally linear models. For instance, the equation y = 3x could be used to represent how much money you would bring in if you sold x boxes of cookies for $3 per box. Many situations can be modeled with linear functions. The key idea is that some quantity in the situation has a constant rate of change. In the cookie-selling example, every box costs $3.00. Therefore the profits increase at a constant rate. In sum, linear functions are used to model a situation of constant change, either increase or decrease.
Quadratic Models
Quadratic functions may also be used as models. For example, the function \(\ A(x)=50 x-\frac{x^{2}}{2}\) could be used to represent the area of a rectangular plot of land enclosed on three sides by 100 feet of fence. This model could be used to identify the maximum possible area for the plot of land.
Another example is a situation in which a ball is tossed into the air. The ball will travel up, and then it will travel down until it hits the ground. How high will the ball go? When will it reach the ground? This kind of situation can be modeled by a function of the form h(t) = -16t2 + v0t + h0. The variable t represents the time since the ball was thrown. The coefficient v0 represents the initial velocity of the ball, and the constant h0 represents the initial height of the ball. The constant -16 comes from the force of gravity which pulls the ball down, which is why it is negative. Example 3 shows a specific situation of this form.
Examples
Solution
Earlier, you were asked to come up with a mathematical model for the following statement.
Two brothers decide to race home from school, taking different routes. The second brother leaves 5 minutes after the first, and both arrive at home at the same time.
There are a number of different ways to model the information, depending on what part(s) of the information you choose to use. A couple of examples include:
If t = the time the second brother took to get home, then t + 5 = the time the first brother took.
If t = the time the first brother took to get home, then (t + (t - 5))/2 represents the average time to run home.
Your model may be similar, or may be written differently, but should compare different values given in the story problem.
You run a lawn mowing business, and charge $15 per lawn. Write a linear function to describe the amount of money made as a function of the number of lawns mowed.
Solution
If you express the number of lawns mowed as l, then $15 multiplied by l would represent the total money made based on the number of lawns, therefore:
total income = 15*l
You drop a rock off the edge of a cliff, and time the fall in seconds. Determine the function that models the height of the cliff as a function of falling time in seconds.
Solution
With an initial velocity of 0, the height of the cliff may be calculated with the formula: h(t) = 16t2.
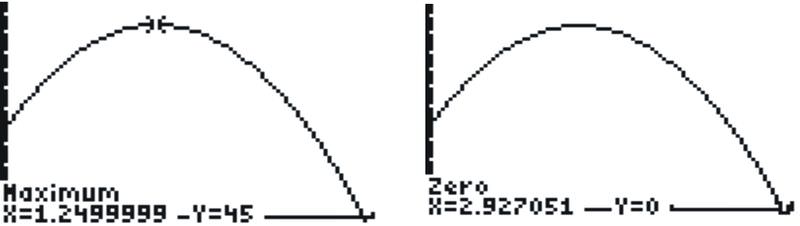
You are standing on the roof of a building that is 20 feet above the ground. You toss a ball into the air with an initial vertical velocity of 40 ft/sec, so that it will land on the ground, not on the roof. How high will the ball go, and when will it reach its maximum height? When will the ball hit the ground?
Solution
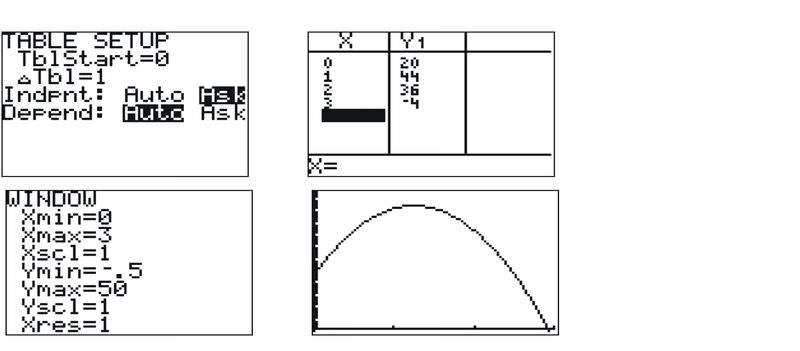
First we need to write a function to model the situation. Using the general form of the equation given above, we can write the function h(t) = -16t2 + 40t + 20 , where h(t) represents the height above the ground.
To answer the first question, we need to examine the graph of the function. If you graph this equation on your calculator, you will need to determine a good viewing window. One way to start to determine a good window is to take into account the y-intercept of the function. In this case, the y-intercept is (0, 20). Think about what kind of function this is: a parabola, facing downwards. This fact should lead you to think that we need to look at y-values well above 20. It is often useful to look at a table of values. Using the “ask” capability of the calculator, if you input x values of 1, 2, and 3, you will see that the function goes up to 44 at x = 1. The maximum value is most likely somewhere near x = 1. Press WINDOW, and set xmin = 0, xmax = 3. Then set Ymin = 0 (or a little less, if you want to see the y-axis). Ymax should be no less than 44, though you may want to make it larger, such as 50 or more, just to be sure that you can see the vertex. Once you have set the window, press GRAPH.
The Arlington Freshmen class wants to have a fundraiser. The class wants to buy a number of $4.00 flip-flops and $5.00 baseball hats, and has a total of $100 to spend.
Solution
To express this information as a function, remember that the question specified that there was $100 to spend, and that any money not spent on hats (at $5 ea) was spent on flip-flops (at $4 ea).
- If f represents the number of flip-flops and b represents the number of baseball hats, write a function to represent the number of flip-flops purchased as a function of unspent monies from baseball hats.
\(\ \therefore f=\frac{\$ 100-5 h}{4}\)
- Using your equation from (a), determine the number of baseball hats that can be bought if 10 flip flops were purchased.
To calculate how many hats could be bought if 10 pairs of flip flops were purchased, substitute 10 in for f, and solve for h:
\(\ \begin{array}{l}
10=\frac{100-5 h}{4} \\
40=100-5 h \\
5 h=60 \\
h=12
\end{array}\)Therefore, if 10 pairs of flip flops were purchased, there would be money left over to buy 12 baseball caps.
Studies of the metabolism of alcohol consistently show that blood alcohol content (BAC) declines linearly, after rising rapidly after initial ingestion. In one study, BAC in a fasting person rose to about 0.018 % after a single drink. After an hour the level had dropped to 0.010 %.
Solution
In order to answer the question, you must express the relationship as an equation and then use the equation.
First, define the variables in the function and create a table.
The two variables are time and BAC.
| Time | BAC |
|---|---|
| 0 | 0.018% |
| 1 | 0.010% |
Next, calculate the rate of change.
| Time | BAC | Rate of change |
|---|---|---|
| 0 | 0.018% | 0 |
| 1 | 0.010% | (0.008%) |
This rate of change means when the time increases by 1, the BAC decreases (since the rate of change is negative) by .008. In other words, the BAC is decreasing .008% every hour. Since we are told that BAC declines linearly, we can assume that figure stays constant.
- Write an equation relating BAC to time in hours after drinking t.
Now we can write an equation with b representing BAC and t, the time in hours:
b=−.008t+.018
- Assuming that BAC continues to decline linearly (meaning at a constant rate of change), approximately when will BAC drop to 0.002%?
To learn when will the BAC reach .002%, substitute .002 in for b and solve for t.
.002=−.008t+.018
−.016=−.008t
t=2
Therefore the BAC will reach .002% after 2 hours.
Review
- From 2002 - 2009 the number of gas stations in a certain country increased by 100 stations per year. In 2004 there were 1100 gas stations. Write a linear equation for the number of gas stations, (y), as a function of time, (t,) where t = 0 represents the year 2002.
Find the vertex of the following quadratic functions and then graph them.
- f(x)=2x2−6x+11
- f(x)=3(x+5)2−2
At the local downtown 4th of July fireworks celebration, the fireworks are shot by remote control into the air from a pit in the ground that is 12 feet below the earth's surface.
- Find an equation that models the height of an aerial bomb t seconds after it is shot upwards with an initial velocity of 80 ft/sec. Assume that the bomb decelerates at a rate of 30 ft/sec each second
- Find the vertex of the quadratic function.
- What is the maximum height above ground level that the aerial bomb will reach?
- How many seconds after it was launched will it take to reach that height?
- A rock is thrown from the top of a 763ft tall building. The distance, in feet, between the rock and the ground t seconds after it is thrown is given by d=−16t2−2t+763 . How long after the rock is thrown is it 430 feet from the ground?
- Use the vertical motion formula h=−16t2+v0t+s to find the number of seconds it takes for a rocket launched from the ground with a starting velocity of 96 ft/s to reach an altitude of 45 ft. Round answers to the nearest tenth.
- The function P=0.0089t2+1.1149t+78.4491 models the United States population in millions since 1900. Use the function P to predict the year in which the population exceeds 1 billion.
- For which value of x is f(x)=−10 if f(x)=−4x2+3x ?
Vocabulary
| Term | Definition |
|---|---|
| linear model | A linear model is a linear function representing a situation that involves a constant rate of change. |
| Model | A model is a mathematical expression or function used to describe a physical item or situation. |
| quadratic model | A quadratic model is a function representing a situation with a rate of change that is a squared value. The graph of a quadratic function is a parabola. |