
2.5.1: Frequency Tables to Organize and Display Data
- Page ID
- 5761
Two-Way Frequency Tables
You are in charge of choosing the theme for the junior/senior prom. You survey the juniors and seniors and record the results in a two-way frequency table.
|
Casino |
Masquerade Ball |
Arabian Nights |
Total |
|
|
Juniors |
100 |
212 |
50 |
362 |
|
Seniors |
190 |
159 |
38 |
387 |
|
Total |
290 |
371 |
88 |
749 |
Based on the results, you decide to go with the Masquerade Ball. On prom night, what's the probability that a student chosen at random got the theme of his/her choice? What's the probability that a senior chosen at random got the theme of his/her choice? What's the probability that a junior chosen at random got the theme of his/her choice?
Two Way Frequency Tables
Suppose you conduct a survey where you ask each person two questions. Once you have finished conducting the survey, you will have two pieces of data from each person. Whenever you have two pieces of data from each person, you can organize the data into a two-way frequency table.
A group of people were surveyed about 1) whether they have cable TV and 2) whether they went on a vacation in the past year.
|
Took a Vacation |
No Vacation |
Total |
|
|
Have Cable TV |
97 |
38 |
135 |
|
Don't Have Cable TV |
14 |
17 |
31 |
|
Total |
111 |
55 |
166 |
The numbers in the frequency table show the numbers of people that fit each pair of preferences. For example, 97 people have cable TV and took a vacation last year. 38 people have cable TV but did not take a vacation last year. The totals of the rows and columns have been added to the frequency table for convenience. From the far right column you can see that 135 people have cable TV and 31 people don't have cable TV for a total of 166 people surveyed. From the bottom row you can see that 111 people took a vacation and 55 people did not take a vacation for a total of 166 people surveyed.
You can use the two-way frequency table to calculate probabilities about the people surveyed. For example, you could find:
- The probability that a random person selected from this group took a vacation last year.
- The probability that a random person from this group who has cable TV took a vacation last year.
- Whether or not “choosing a person with cable TV” and “choosing a person who took a vacation” are independent events for this population of 166 people.
Let's look at some problems involving two way frequency tables
1. Suppose you choose a person at random from the group surveyed below. Let A be the event that the person chosen took a vacation last year. Find P(A).
|
Took a Vacation |
No Vacation |
Total |
|
|
Have Cable TV |
97 |
38 |
135 |
|
Don't Have Cable TV |
14 |
17 |
31 |
|
Total |
111 |
55 |
166 |
There were 166 people surveyed, so there are 166 outcomes in the sample space. 111 people took a vacation last year.

2. Suppose you choose a person at random from the group surveyed below. Let A be the event that the person chosen took a vacation last year. Let B be the event that the person chosen has cable TV. Find P(A|B).
|
Took a Vacation |
No Vacation |
Total |
|
|
Have Cable TV |
97 |
38 |
135 |
|
Don't Have Cable TV |
14 |
17 |
31 |
|
Total |
111 |
55 |
166 |
You are looking for the probability that the person took a vacation given that they have cable TV. Since you know that the person has cable TV, the sample space has been restricted to the 135 people with cable TV. 97 of those people took a vacation.
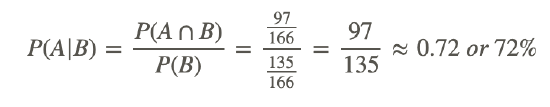
With the conditional probability formula, each probability is calculated with the sample space of 166. The two 166's cancel each other out, and the result is the same. Sometimes it makes sense to use the conditional probability formula, and sometimes it is easier to think logically about what is being asked.
3. Suppose you choose a person at random from the group surveyed below. Let A be the event that the person chosen took a vacation last year. Let B be the event that the person chosen has cable TV. Are events A and B independent?
|
Took a Vacation |
No Vacation |
Total |
|
|
Have Cable TV |
97 |
38 |
135 |
|
Don't Have Cable TV |
14 |
17 |
31 |
|
Total |
111 |
55 |
166 |
From #1, you know that P(A)=67%. From #2, you know that P(A|B)=72%. Because these probabilities are not equal, the two events are NOT independent (they are dependent). People with cable TV are more likely to have taken a vacation as opposed to people without cable TV, so knowing that a person has cable TV increases the probability that they took a vacation.
Examples
Example 1
Earlier, you were given a problem on the junior/senior prom.
|
Casino |
Masquerade Ball |
Arabian Nights |
Total |
|
|
Juniors |
100 |
212 |
50 |
362 |
|
Seniors |
190 |
159 |
38 |
387 |
|
Total |
290 |
371 |
88 |
749 |
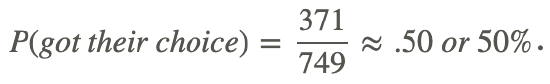
You decide to go with the Masquerade Ball. On prom night, what's the probability that a student chosen at random got the theme of his/her choice?
This question includes the entire population of 749 people as the sample space. 371 of those people wanted the Masquerade Ball.
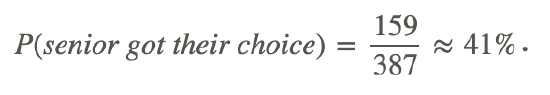
What's the probability that a senior chosen at random got the theme of his/her choice?
This is a conditional probability question, because you know that the student is a senior. You can restrict the sample space to just the 387 seniors. 159 of them wanted the Masquerade Ball.
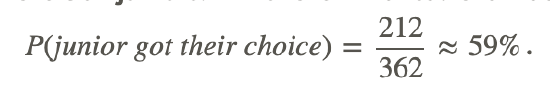
What's the probability that a junior chosen at random got the theme of his/her choice?
This is a conditional probability question, because you know that the student is a junior. You can restrict the sample space to just the 362 juniors. 212 of them wanted the Masquerade Ball.
A group of 112 students was surveyed about what grade they were in and whether they preferred dogs or cats. 20 9th graders preferred dogs, 5 9th graders preferred cats, 16 10th graders preferred dogs, 4 10th graders preferred cats, 22 11th graders preferred dogs, 6 11th graders preferred cats, 30 12th graders preferred dogs, and 7 12th graders preferred cats.
Example 2
Construct a two-way frequency table to organize this data.
|
Dogs |
Cats |
Total |
|
|
9th Grade |
20 |
5 |
25 |
|
10th Grade |
16 |
4 |
20 |
|
11th Grade |
22 |
6 |
28 |
|
12th Grade |
30 |
7 |
37 |
|
Total |
88 |
22 |
110 |
Example 3
Suppose a person is chosen at random from this group. Let C be the event that the student prefers cats. Let T be the event that the student is in 10th grade. Find P(C) and P(C|T).
There are 110 students total. 22 of them prefer cats.
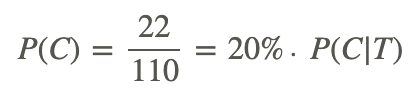
means the probability that the student prefers cats given that they are in 10th grade. Restrict the sample space to the 20 10th grade students. 4 of them prefer cats.

Example 4
Are events C and T independent?
The events are independent because P(C)=P(C|T). Being in 10th grade does not affect the probability of the student preferring cats.
Review
Use the following information for #1-#5: A group of 64 people were surveyed about the type of movies they prefer. 12 females preferred romantic comedies, 10 females preferred action movies, and 3 females preferred horror movies. 8 males preferred romantic comedies, 25 males preferred action movies, and 6 males preferred horror movies.
1. Construct a two-way frequency table to organize this data.
Suppose a person is chosen at random from this group.
2. Let F be the event that the person is female. Find P(F).
3. Let R be the event that the person prefers romantic comedies. Find P(R).
4. Find P(F|R) and P(R|F). Explain how these two calculations are different.
5. Are events F and R independent? Justify your answer.
The middle school students in your town were surveyed and classified according to grade level and response to the question “how do you usually get to school”? The data is summarized in the two-way table below.
|
Walk |
Bus |
Car |
Total |
|
|
6th Grade |
30 |
120 |
65 |
215 |
|
7th Grade |
25 |
170 |
25 |
220 |
|
8th Grade |
40 |
130 |
41 |
211 |
|
Total |
95 |
420 |
131 |
646 |
6. If a student is chosen at random from this group, what is the probability that he or she is a 6th grade student who takes the bus?
7. If a 6th grade student is chosen at random from this group, what is the probability that he or she takes the bus?
8. If a student who takes the bus is chosen at random from this group, what is the probability that he or she is in 6th grade?
9. The previous three questions each have to do with 6th grade and taking the bus. Why are the answers to these questions different?
10. Are the events “being in 6th grade” and “taking the bus” independent? Justify your answer.
A hospital runs a test to determine whether or not patients have a particular disease. The test is not always accurate. The two-way table below summarizes the numbers of patients in the past year that received each result.
|
Positive Result on Test |
Negative Result on Test |
Total |
|
|
Has Disease |
100 |
4 |
104 |
|
Does Not Have Disease |
12 |
560 |
572 |
|
Total |
112 |
564 |
676 |
11. If a patient is chosen at random from this group, what is the probability that he or she has the disease?
12. A patient from this group received a positive test result. What is the probability that he or she has the disease?
13. A patient from this group has the disease. What is the probability that he or she received a positive result on the test?
14. A “false positive” is when a patient receives a positive result on the test, but does not actually have the disease. What is the probability of a false positive for this sample space?
15. How many of the 676 patients received accurate test results?
Vocabulary
| Term | Definition |
|---|---|
| bar chart | A bar chart is a graphic display of categorical variables that uses bars to represent the frequency of the count in each category. |
| conditional probability | The probability of a particular dependent event given the outcome of the event on which it occurs. |
| Dependent Events | In probability situations, dependent events are events where one outcome impacts the probability of the other. |
| Independent Events | Two events are independent if the occurrence of one event does not impact the probability of the other event. |
| two way tables | Contingency tables are sometimes called two-way tables because they are organized with the outputs of one variable across the top, and another down the side. |
Additional Resources
PLIX: Play, Learn, Interact, eXplore - Favorite Films