
2.7.1: Evaluate Relations with Scatter Plots
- Page ID
- 5770
Scatter Plots
Often, when real-world data is plotted, the result is a linear pattern. The general direction of the data can be seen, but the data points do not all fall on a line. This type of graph is called a scatter plot. A scatter plot is often used to investigate whether or not there is a relationship or connection between 2 sets of data. The data is plotted on a graph such that one quantity is plotted on the x-axis and one quantity is plotted on the y-axis. The quantity that is plotted on the x-axis is the independent variable, and the quantity that is plotted on the y-axis is the dependent variable. If a relationship does exist between the 2 sets of data, it will be easy to see if the data is plotted on a scatter plot.
The following scatter plot shows the price of peaches and the number sold:
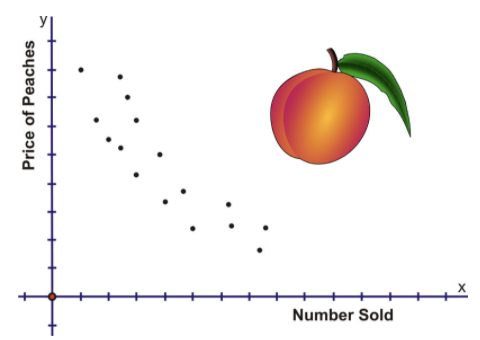
The connection is obvious−when the price of peaches was high, the sales were low, but when the price was low, the sales were high.
The following scatter plot shows the sales of a weekly newspaper and the temperature:
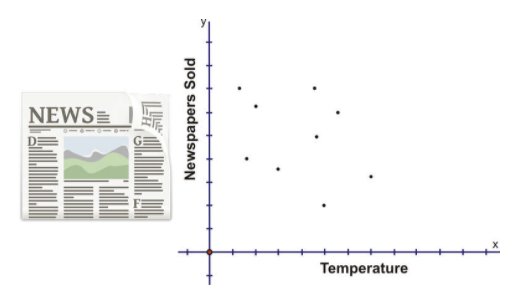
There is no connection between the number of newspapers sold and the temperature.
Another term used to describe 2 sets of data that have a connection or a relationship is correlation. The correlation between 2 sets of data can be positive or negative, and it can be strong or weak. The following scatter plots will help to enhance this concept.
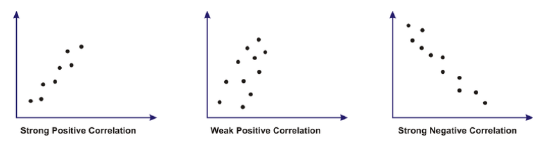
If you look at the 2 sketches that represent a positive correlation, you will notice that the points are around a line that slopes upward to the right. When the correlation is negative, the line slopes downward to the right. The 2 sketches that show a strong correlation have points that are bunched together and appear to be close to a line that is in the middle of the points. When the correlation is weak, the points are more scattered and not as concentrated.
When correlation exists on a scatter plot, a line of best fit can be drawn on the graph. The line of best fit must be drawn so that the sums of the distances to the points on either side of the line are approximately equal and such that there are an equal number of points above and below the line. Using a clear plastic ruler makes it easier to meet all of these conditions when drawing the line. Another useful tool is a stick of spaghetti, since it can be easily rolled and moved on the graph until you are satisfied with its location. The edge of the spaghetti can be traced to produce the line of best fit. A line of best fit can be used to make estimations from the graph, but you must remember that the line of best fit is simply a sketch of where the line should appear on the graph. As a result, any values that you choose from this line are not very accurate−the values are more of a ballpark figure.
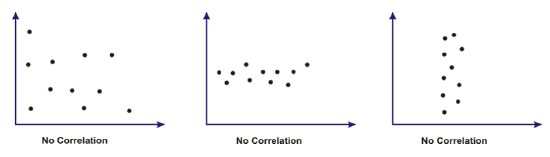
In the sales of newspapers and the temperature, there was no connection between the 2 data sets. The following sketches represent some other possible outcomes when there is no correlation between data sets:
Plotting Points on a Scatter Plot
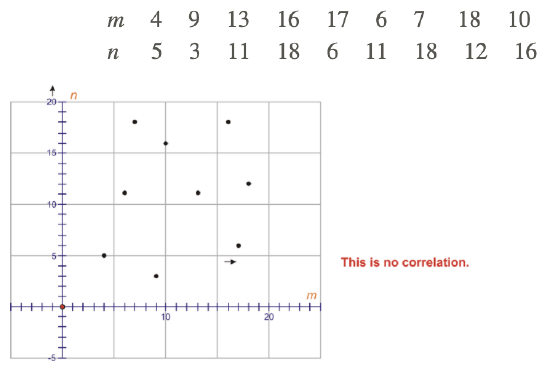
Plot the following points on a scatter plot, with m as the independent variable and n as the dependent variable. Number both axes from 0 to 20. If a correlation exists between the values of m and n, describe the correlation (strong negative, weak positive, etc.).
Describing Correlation
Describe the correlation, if any, in the following scatter plot:
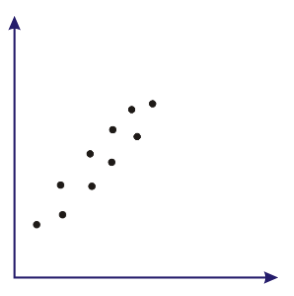
In the above scatter plot, there is a strong positive correlation.
Drawing a Line of Best Fit
The following table consists of the marks achieved by 9 students on chemistry and math tests:
| Student | A | B | C | D | E | F | G | H | I |
|---|---|---|---|---|---|---|---|---|---|
| Chemistry Marks | 49 | 46 | 35 | 58 | 51 | 56 | 54 | 46 | 53 |
| Math Marks | 29 | 23 | 10 | 41 | 38 | 36 | 31 | 24 | ? |
Plot the above marks on scatter plot, with the chemistry marks on the x-axis and the math marks on the y-axis. Draw a line of best fit, and use this line to estimate the mark that Student I would have made in math had he or she taken the test.
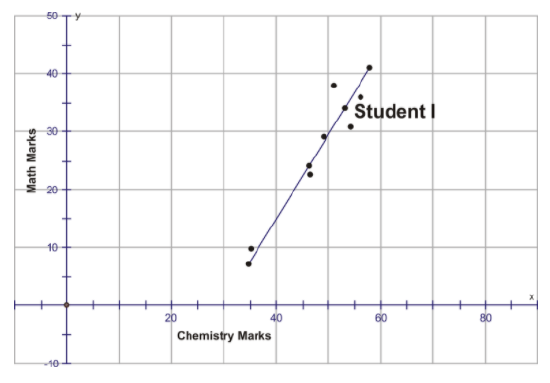
If Student I had taken the math test, his or her mark would have been between 32 and 37.
Points to Consider
- Can the equation for the line of best fit be used to calculate values?
- Is any other graphical representation of data used for estimations?
Examples
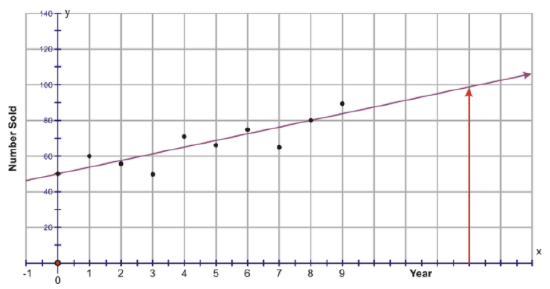
The following table represents the sales of Volkswagen Beetles in Iowa between 1994 and 2003:
| Year | 1994 | 1995 | 1996 | 1997 | 1998 | 1999 | 2000 | 2001 | 2002 | 2003 |
|---|---|---|---|---|---|---|---|---|---|---|
| Beetles Sold | 50 | 60 | 55 | 50 | 70 | 65 | 75 | 65 | 80 | 90 |
Example 1
Create a scatter plot and draw the line of best fit for the data. Hint: Let 0 = 1994, 1 = 1995, etc.
Example 2
Use the graph to predict the number of Beetles that will be sodl in Iowa in the year 2007.
The year 2007 would actually be the number 13 on the x−axis. The number of beetles sold in this year would be approximately 98 to 100.
Example 3
Describe the correlation for the above graph.
The correlation of this graph is strong and positive.
Review
- What is the correlation of a scatter plot that has few points that are not bunched together?
- strong
- no correlation
- weak
- negative
- What term is used to define the connection between 2 data sets?
- relationship
- scatter plot
- correlation
- discrete
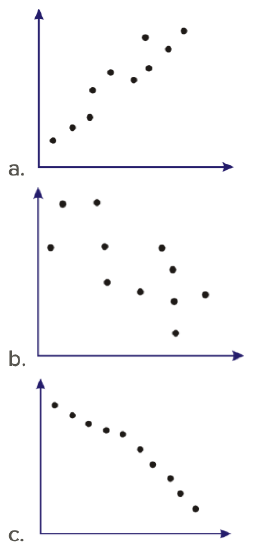
- Describe the correlation of each of the following graphs:
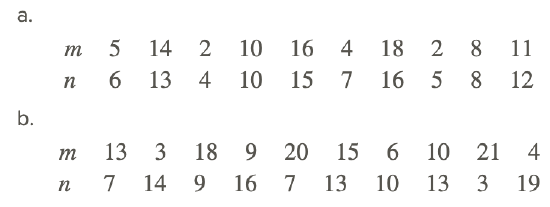
4. Plot the following points on a scatter plot, with m as the independent variable and n as the dependent variable. Number both axes from 0 to 20. If a correlation exists between the values of m and n, describe the correlation (strong negative, weak positive, etc.).
The following scatter plot shows the closing prices of 2 stocks at various points in time. A line of best fit has been drawn. Use the scatter plot to answer the following questions.
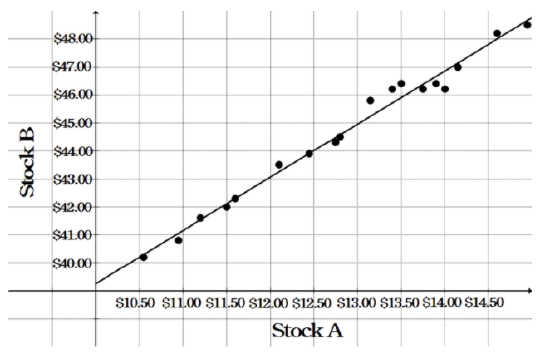
- How would you describe the correlation between the prices of the 2 stocks?
- If the price of stock A is $12.00, what would you expect the price of stock B to be?
- If the price of stock B is $47.75, what would you expect the price of stock A to be?
The following scatter plot shows the hours of exercise per week and resting heart rates for various 30-year-old males. A line of best fit has been drawn. Use the scatter plot to answer the following questions.
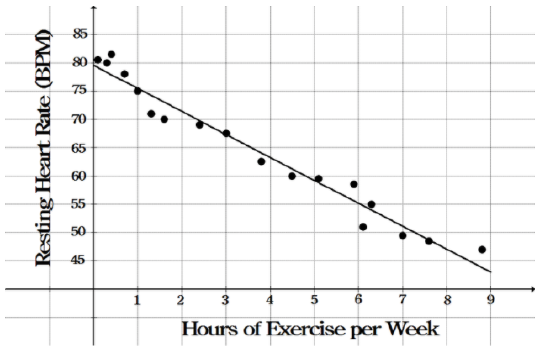
- How would you describe the correlation between hours of exercise per week and resting heart rate?
- If a 30-year-old male exercises 2 hours per week, what would you expect his resting heart rate to be?
- If a 30-year-old male has a resting heart rate of 65 beats per minute, how many hours would you expect him to exercise per week?
Vocabulary
| Term | Definition |
|---|---|
| correlation | Correlation is a statistical method used to determine if there is a connection or a relationship between two sets of data. |
| line of best fit | A line of best fit is a straight line drawn on a scatter plot such that the sums of the distances to the points on either side of the line are approximately equal and such that there are an equal number of points above and below the line. |
| scatter plot | A scatter plot is a plot of the dependent variable versus the independent variable and is used to investigate whether or not there is a relationship or connection between 2 sets of data. |
Additional Resources
PLIX: Play, Learn, Interact, eXplore - Regression and Correlation
Video: Scatter Plots Principles
Activities: Scatter Plots Discussion Questions
Study Aids: Bivariate Data Study Guide
Lesson Plans: Scatter Plots Lesson Plan