
2.8.3: Interpreting Stem and Leaf Plots (Stem and Leaf Plots, Range of a Data Set)
- Page ID
- 5776
Stem-and-Leaf Plots, Mean, Median and Mode

Gaertringen - https://pixabay.com/en/fishing-fishing-rod-lake-pole-454367/
Jevin is participating in a fishing tournament. At the end of the tournament, all of the weights of the fish are placed on a chart. Jevin makes a stem-and-leaf plot to organize the data. Can you find the mean, median and mode of the weights of the fish?
| Stem | Leaf |
|---|---|
| 2 | 9 |
| 3 | 1 |
| 4 | 0 5 |
| 5 | 2 |
| 6 | 2 |
| 7 | 6 |
| 8 | 3 |
| 9 | 2 2 |
In this concept, you will learn how to use a stem-and-leaf plot to find the mean, median and mode of the data set.
Using Stem-and-Leaf Plots to Find The Mean, Median, and Mode of a Data Set
The mean is the average of a set of data.
The median is the middle number of a set of data.
The mode is the number that occurs the most in a set of data.
You can use a stem-and-leaf plot to find the mean, median and mode of a set of data.
CC BY-NC
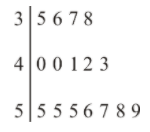
To find the mean, add up all of the numbers in the set and divide by the number of values that you added.
35 + 36 + 37 + 38 + 40 + 40 + 41 + 42 + 43 + 55 + 55 + 55 + 56 + 57 + 58 + 59 = 747
Then, divide by the number of values, which is 16.
747/16=46.68
After rounding, the answer is 47.
Next, let's find the median of the data set. Remember that the median is the middle score.
You just wrote all of the scores in order from the smallest to the greatest. Find the middle score by counting to the middle. Sometimes there will only be one number in the middle, and sometimes there will be two numbers. This data set has two scores in the middle.
42 + 43 are the two middle scores.
Find the mean of these two scores and that will give you the median.
42 + 43 = 42.5
The median score is 42.5 for this data set.
Now, let's find the mode of the data set.
The mode is the value that appears the most.
In this set of data, 55 is the number that appears the most.
The mode is 55 for this data set.
Examples
Example 1
Earlier, you were given a problem about Jevin and his stem-and-leaf plot for the fish weights.
The weight is measured in ounces. What is the mean, median and mode for the data set?
| Stem | Leaf |
|---|---|
| 2 | 9 |
| 3 | 1 |
| 4 | 0 5 |
| 5 | 2 |
| 6 | 2 |
| 7 | 6 |
| 8 | 3 |
| 9 | 2 2 |
Find the mean.
First, add up the weights.
29+31+40+45+52+62+76+83+92+92=602
Next, divide by the total number of weights.
602/10=60.2
Then, round the answer to the nearest whole number.
60
The answer is 60. The mean weight is 60 ounces.
Find the median.
First, list the weights from least to greatest.
29, 31, 40, 45, 52, 62, 76, 83, 92, 92
Next, find the middle weight.
52 and 62
Then calculate the mean of the middle weights.
114/2=57
The answer is 57. The median weight of the fish is 57 ounces.
Find the mode.
First, arrange the weights from least to greatest.
29, 31, 40, 45, 52, 62, 76, 83, 92, 92
Then, identify the weight that occurs the most.
92
The answer is 92. The weight that occurred the most was 92 ounces.
Example 2
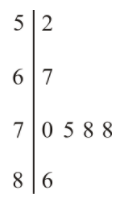
Use the stem-and-leaf plot to calculate the mean of the data set.
pixabay.com - https://pixabay.com/en/fishing-fishing-rod-lake-pole-454367/;en.wikipedia.org - CC BY-NC
First, add up all of the numbers in the set.
52 + 67 + 70 + 75 + 78 + 78 = 420
Then, divide by the number of values that you added.
420/7=60
The answer is 60. The mean of the data set is 60.
Example 3
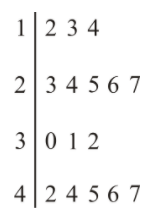
Use this stem-and-leaf plot to answer the question.
https://pixabay.com/en/fishing-fishing-rod-lake-pole-454367/ - CC BY-NC
What is the mean?
First, add up all of the numbers in the set.
12 + 13 + 14 + 23 + 24 + 25 + 26 + 27 + 30 + 31 + 32 + 42 + 44 + 45 + 46 + 47 = 481
Next, divide by the number of values that you added.
481/16=30.0625
Then, round your answer to the nearest whole number.
30
The answer is 30. The mean of the data set is approximately 30.
Example 4
Use the stem-and-leaf plot in example 3 to answer the question.
What is the median?
First, list the values from smallest to largest.
12, 13, 14, 23, 24, 25, 26, 27, 30, 31, 32, 42, 44, 45, 46, 47
Next, find the mean of the two middle numbers.
27 + 30 = 57
572=28.5
Then, round to the nearest whole number.
29
The answer is 29. The median of the data set is approximately 29.
Example 5
Use the stem-and-leaf plot in example 3 to answer the question.
What is the mode?
First, list the values from smallest to largest.
12, 13, 14, 23, 24, 25, 26, 27, 30, 31, 32, 42, 44, 45, 46, 47
Then, select the number that occurs the most.
There isn't one.
The answer is no mode. There isn't a mode for this data set.
Review
Answer each question.
- Define the mean.
- Define the median.
- Define the mode.
Use the stem and leaf plot to answer the following questions.
| Stem | Leaf |
|---|---|
| 6 | 8 |
| 7 | 5 7 9 |
| 8 | 0 2 |
| 9 | 2 6 6 7 |
- What is the lowest value in the plot?
- What is the greatest value in the plot?
- Which interval has the most values in it?
- What is the mean of the data set?
- What is the median of the data set?
- What is the mode of the data set?
- What is the range of the data set?
| Stem | Leaf |
|---|---|
| 0 | 8 |
| 1 | 2 7 8 9 |
| 2 | 2 3 |
| 3 | 1 5 |
| 4 | 0 |
- What is the smallest value in the plot?
- What is the greatest value in the plot?
- What is the mean of the data set?
- What is the median of the data set?
- What is the mode of the data set?
Review (Answers)
To see the Review answers, open this PDF file and look for section 3.23.
Then, select the number that occurs the most.
There isn't one.
The answer is no mode. There isn't a mode for this data set.
Resources
Vocabulary
| Term | Definition |
|---|---|
| Data | Data is information that has been collected to represent real life situations, usually in number form. |
| Mean | The mean of a data set is the average of the data set. The mean is found by calculating the sum of the values in the data set and then dividing by the number of values in the data set. |
| Median | The median of a data set is the middle value of an organized data set. |
| Mode | The mode of a data set is the value or values with greatest frequency in the data set. |
| Stem-and-leaf plot | A stem-and-leaf plot is a way of organizing data values from least to greatest using place value. Usually, the last digit of each data value becomes the "leaf" and the other digits become the "stem". |
Additional Resources
PLIX: Play, Learn, Interact, eXplore - Ordering Leaves
Video: Stem and Leaf Plots - Applications
Practice: Interpreting Stem and Leaf Plots (Stem and Leaf Plots, Range of a Data Set)