
2.8.4: Two-Sided Stem-and-Leaf Plots
- Page ID
- 5777
Two-Sided Stem-and-Leaf Plots
As you have learned in a previous section, stem-and-leaf plots are an excellent tool for organizing data. Remember that stem-and-leaf plots are a visual representation of grouped discrete data, but they can also be referred to as a modal representation. This is because by looking at a stem-and-leaf plot, we can determine the mode by quick visual inspection. The previous section was about single-sided stem-and-leaf plots. In this section, you will learn about two-sided stem-and-leaf plots, which are also often called back-to-back stem-and-leaf plots.
Interpreting Stem-and-Leaf Plots
The girls and boys in one of BDF High School's AP English classes are having a contest. They want to see which group can read the most number of books. Mrs. Stubbard, their English teacher, says that the class will tally the number of books each group has read, and the highest mode will be the winner. The following data was collected for the first semester of AP English:

a. Draw a two-sided stem-and-leaf plot for the data.
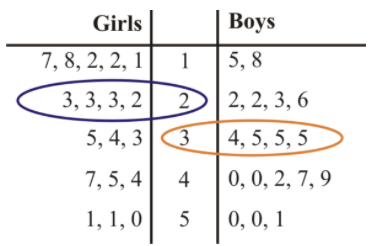
b. Determine the mode for each group.
The mode for the girls is 23 books. It is the number in the girls column that appears most often. The mode for the boys is 35 books. It is the number in the boys column that appears most often.
c. Help Mrs. Stubbard decide which group won the contest.
Mrs. Stubbard should decide that the boys group has won the contest.
Constructing a Two-Sided Stem-and-Leaf Plots
1. Mrs. Cameron teaches AP Statistics at GHI High School. She recently wrote down the class marks for her current grade 12 class and compared it to the previous grade 12 class. The data can be found below. Construct a two-sided stem-and-leaf plot for the data and compare the distributions.
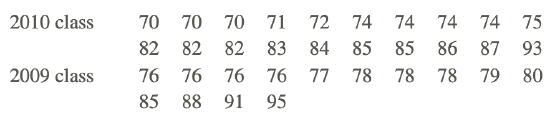
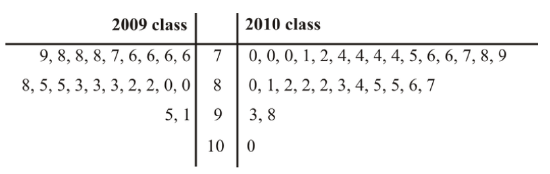
There is a wide variation in the marks for both years in Mrs. Cameron’s AP Statistics Class. In 2009, her class had marks anywhere from 76 to 95. In 2010, the class marks ranged from 70 to 100. The mode for the 2009 class was 76, but for the 2010 class, it was 74. It would seem that the 2009 class had, indeed, done slightly better than Mrs. Cameron’s current class.
2. The following data was collected in a survey done by Connor and Scott for their statistics project. The data represents the ages of people who entered into a new hardware store within its first half hour of opening on its opening weekend. The M's in the data represent males, and the F's represent females.
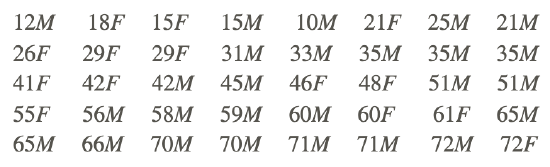
Construct a back-to-back stem-and-leaf plot showing the ages of male customers and the ages of female customers. Compare the distributions.
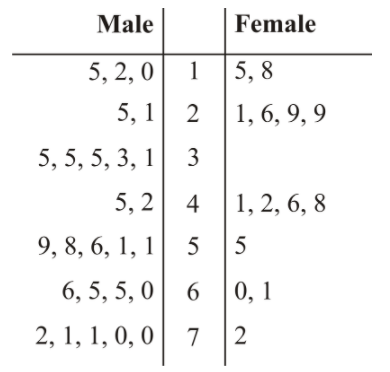
For the male customers, the ages ranged from 10 to 72. The ages for the male customers were spread out throughout this range, with the mode being age 35. In other words, for the males found to be at the store in the first half hour of opening day, there was no real age category where a concentration of males could be found.
For the female customers, the ages ranged from 15 to 72, but they were concentrated between 21 and 48. The mode for the ages of the female customers was 29 years of age.
Example
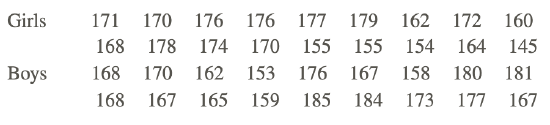
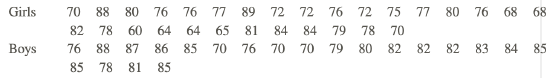
The boys and girls basketball teams at a high school had their heights measured at practice. The following data was recorded for their heights (in centimeters):
Example 1
Construct a two-sided stem-and-leaf plot for the data. Determine the median and mode using the two-sided stem-and-leaf plot for each distribution. What can you conclude from the distributions?
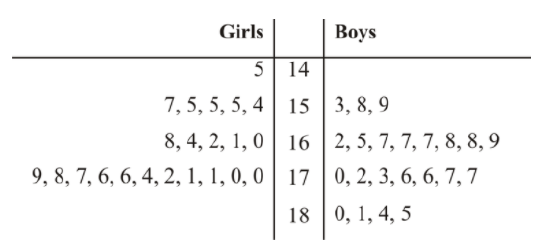
The data suggests that there is a slightly wider variation in the heights for the group of girls than for the group of boys. For the girls, the heights ranged from 145 to 179 centimeters, whereas for the boys, the heights ranged from 153 to 185 centimeters. The median for the girls group is at 168.5 centimeters, and the mode is at 155 centimeters. For the group of boys, however, the median is at 169.5 centimeters, and the mode is at 167 centimeters. The boys seem to be taller than the girls.
Review
The two-sided stem-and-leaf plot below shows the number of home runs hit by the members of 2 major league baseball teams. Use the two-sided stem-and-leaf plot to answer the following questions:

- What was the range for the number of home runs hit by the Mets? What was the range for the Phillies?
- What was the median for the number of home runs hit by the Mets? What was the median for the Phillies?
- What was the mode for the number of home runs hit by the Mets? What was the mode for the Phillies?
- Which team had more players hit 20 or more home runs?
30 girls and 35 boys participated in an intramural bowling league. The two-sided stem-and-leaf plot below shows the highest score of each of the participants. Use the two-sided stem-and-leaf plot to answer the following questions:
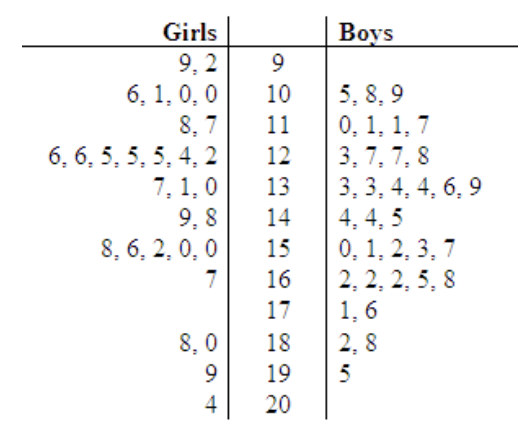
- What was the range for the highest scores for the girls? What was the range for the boys?
- What was the median for the highest scores for the girls? What was the median for the boys?
- What was the mode for the highest scores for the girls? What was the mode for the boys?
- Did a girl or a boy have the highest score in the intramural bowling league?
- Mr. Dugas, the senior high physical education teacher, is doing fitness testing this week in gym class. After each test, students are required to take their pulse rate and record it on the chart in the front of the gym. At the end of the week, Mr. Dugas looks at the data in order to analyze it. The data is shown below:
- Construct a two-sided stem-and-leaf plot for the data and compare the distributions.
- Starbucks prides itself on its low line-up times in order to be served. A new coffee house in town has also boasted that it will have your order in your hands and have you on your way quicker than the competition. The following data was collected for the line-up times (in minutes) for both coffee houses:

- Construct a two-sided stem-and-leaf plot for the data. Determine the median and mode using the two-sided stem-and-leaf plot. What can you conclude from the distributions?
Vocabulary
| Term | Definition |
|---|---|
| two-sided stem-and-leaf plots | Two-sided stem-and-leaf plots are two stem-and-leaf plots plotted side by side and are often called back-to-back stem-and-leaf plots. |
Additional Resources
PLIX: Play, Learn, Interact, eXplore - Gamers
Video: Two Sided Stem and Leaf Plots Examples
Activities: Two-Sided Stem-and-Leaf Plots Discussion Questions
Lesson Plans: Two Sided Stem and Leaf Plots Lesson Plan
Practice: Two-Sided Stem-and-Leaf Plots
Real World: Two Sided Stem and Leaf Plots