
4.3: Ungrouped Data to Find the Mean
- Page ID
- 5717
Ungrouped Data to Find the Mean
When a data set is large, a frequency distribution table is often used to display the data in an organized way. A frequency distribution table lists the data values, as well as the number of times each value appears in the data set. A frequency distribution table is easy to both read and interpret and in this concept is used for ungrouped data, or data that is listed.
The numbers in a frequency distribution table do not have to be put in order. To make it easier to enter the values in the table, a tally column is often inserted. Inserting a tally column allows you to account for every value in the data set, without having to continually scan the numbers to find them in the list. A slash (/) is used to represent the presence of a value in the list, and the total number of slashes will be the frequency. If a tally column is inserted, the table will consist of 3 columns, and if no tally column is inserted, the table will consist of 2 columns. The formula that was written to determine the mean,
\[\bar{x}=\frac{\sum x_{1}+x_{2}+x_{3}+\ldots+x_{n}}{n}\]
does not show any multiplication of the numbers by their frequencies. However, this can be easily inserted into this formula as shown below:
\[\bar{x}=\frac{\sum x_{1} f_{1}+x_{2} f_{2}+x_{3} f_{3}+\ldots+x_{n} f_{n}}{f_{1}+f_{2}+f_{3}+\ldots+f_{n}}\]
Let’s examine this concept with an actual problem and data.
Calculating the Mean Given a Frequency Distribution Table
60 students were asked how many books they had read over the past 12 months. The results are listed in the frequency distribution table below. Calculate the mean number of books read by each student.

Mark Hillary - http://www.flickr.com/photos/markhillary/4182076189/ - CC BY-NC
| Number of Books | Number of Students (Frequency) |
|---|---|
| 0 | 1 |
| 1 | 6 |
| 2 | 8 |
| 3 | 10 |
| 4 | 13 |
| 5 | 8 |
| 6 | 5 |
| 7 | 6 |
| 8 | 3 |

Mark Hillary - http://www.flickr.com/photos/markhillary/4182076189/ - CC BY-NC
To determine the total number of books that were read by the students, each number of books must be multiplied by the number of students who read that particular number of books. Then all the products must be added to determine the total number of books read. This total number divided by 60 will tell you the mean number of books read by each student.
Thus, the mean number of books read by each student can be calculated as follows:
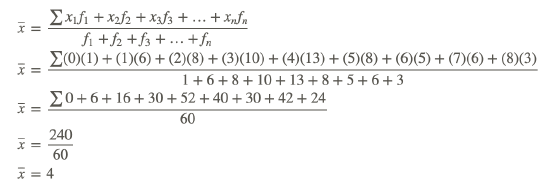
The mean number of books read by each student was 4 books.
Determining the Mean Given a List
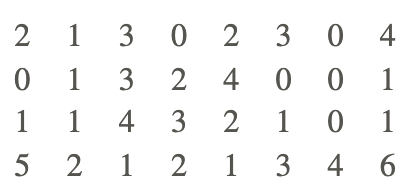
Suppose the numbers of books read by each student in Example A were randomly listed as follows. Determine the mean of the numbers.
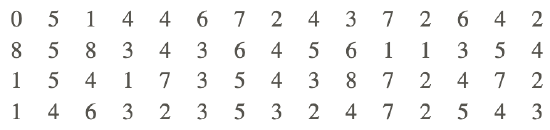
An alternative to entering all the numbers into a calculator would be to create a frequency distribution table like the one shown below:
| Number of Books | Tally | Number of Students (Frequency) |
|---|---|---|
| 0 | | | 1 |
| 1 | |||| | | 6 |
| 2 | |||| ||| | 8 |
| 3 | |||| |||| | 10 |
| 4 | |||| |||| ||| | 13 |
| 5 | |||| ||| | 8 |
| 6 | |||| | 5 |
| 7 | |||| | | 6 |
| 8 | ||| | 3 |

Mark Hillary - http://www.flickr.com/photos/markhillary/4182076189/ - CC BY-NC
Now that the data has been organized, the numbers of books read and the numbers of students who read the books are evident. The mean can now be calculated as it was in Example A:
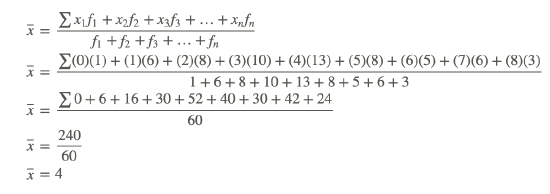
The mean number of books read by each student was 4 books.
Using Technology
Using technology, determine the mean of the following set of numbers:
24,25,25,25,26,26,27,27,28,28,31,32
Technology is a major tool that is available for you to use when doing mathematical calculations, and its use goes beyond entering numbers to perform simple arithmetic operations. For example, the TI-83 calculator can be used to determine the mean of a set of given data values. You will first learn to calculate the mean by simply entering the data values into a list and determining the mean. The second method that you will learn about utilizes the frequency table feature of the TI-83.
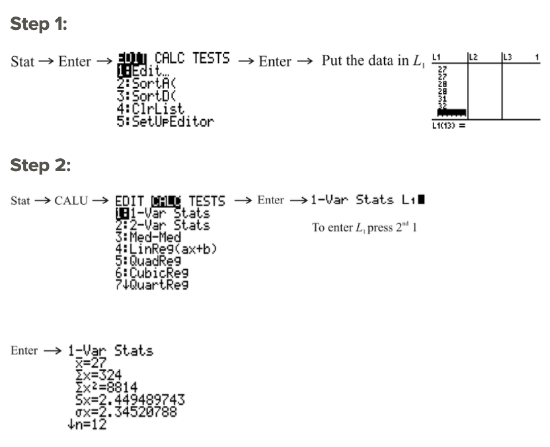
Notice that the sum of the data values is 324 (∑x=324).
Notice that the number of data values is 12 (n=12).
Notice the mean of the data values is 27 (x⎯⎯⎯=27).
Now we will use the same data values and use the TI-83 to create a frequency table.
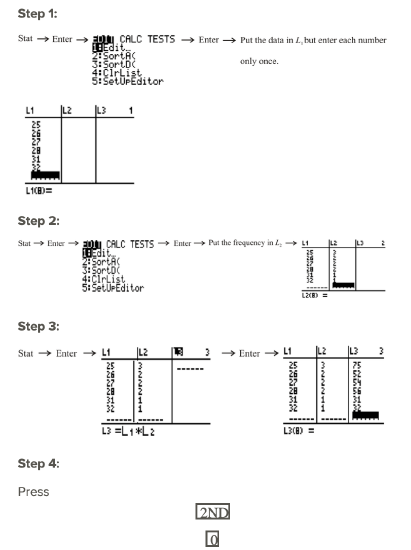
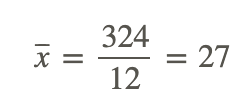
to obtain the CATALOG menu of the calculator. Scroll down to the sum function and enter
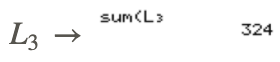
You can repeat this step to determine the sum of
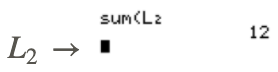
Now the mean of the data can be calculated as follows:
Note that not all the data values and frequencies are visible in the screenshots, but rest assured that they were all entered into the calculator.
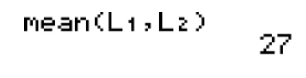
After entering the data into L1, the frequencies into L2, and pressing 2ND MODE, another way to solve this problem with the calculator would have been to press 2ND STAT, go to the MATH menu, choose option 3, and enter L1 and L2 separated by a comma so that you have mean(L1, L2). Then press ENTER to get the answer. This way, the calculator will do all the calculations for you.
Example
Example 1
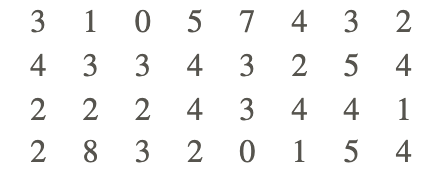
The following data shows the heights in centimeters of a group of grade 10 students:
183171158171182158164183179170182183170171167176176164176179183176170183183167167176171182179170
Organize the data in a frequency distribution table and calculate the mean height of the students.
The data can be organized into a frequency distribution table as shown below:
| Height of Students(cm) | Tally | Number of Students (Frequency) |
|---|---|---|
| 171 | |||| | 4 |
| 158 | || | 2 |
| 176 | |||| | 5 |
| 182 | ||| | 3 |
| 164 | || | 2 |
| 179 | ||| | 3 |
| 170 | |||| | 4 |
| 183 | |||| | | 6 |
| 167 | ||| | 3 |
Now the frequency distribution table can be used to calculate the mean as follows:
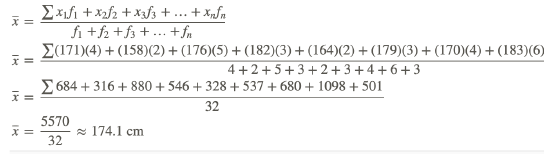
The mean height of the students is approximately 174.1 cm.
Review
- 45 students were asked how many e-mail messages they sent yesterday. The results are listed in the frequency distribution table below. Calculate the mean number of e-mail messages sent by each student.
| Number of E-Mail Messages | Number of Students (Frequency) |
|---|---|
| 0 | 6 |
| 1 | 9 |
| 2 | 8 |
| 3 | 9 |
| 4 | 2 |
| 5 | 3 |
| 6 | 2 |
| 7 | 5 |
| 8 | 1 |
- 70 drivers were asked how many parking tickets they got last year. The results are listed in the frequency distribution table below. Calculate the mean number of parking tickets received by each driver.
| Number of Parking Tickets | Number of Drivers (Frequency) |
|---|---|
| 0 | 11 |
| 1 | 10 |
| 2 | 6 |
| 3 | 9 |
| 4 | 6 |
| 5 | 5 |
| 6 | 8 |
| 7 | 5 |
| 8 | 5 |
| 9 | 3 |
| 10 | 2 |
- The following data shows the numbers of siblings of a group of grade 10 students. Organize the data in a frequency distribution table and calculate the mean number of siblings of the students.
4. The following data shows the numbers of touchdowns scored by each of the teams in the National Football League last week. Organize the data in a frequency distribution table and calculate the mean number of touchdowns scored by the teams.
A set of data values was entered into L1 on a TI calculator, and 1-Var Stats returned the results shown below:
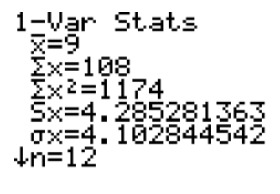
- What is the sum of the data values?
- How many data values are there?
- What is the mean of the data values?
- The following frequency distribution table was entered into a TI calculator. All the data values and frequencies are visible in the screenshot.
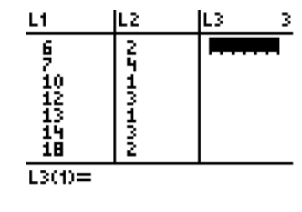
What is the mean of the data?
- The following frequency distribution table was entered into a TI calculator. All the data values and frequencies are visible in the screenshot.
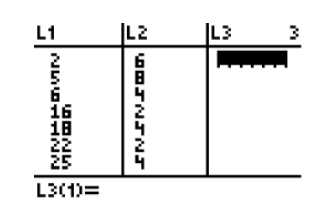
What is the mean of the data?
- The following frequency distribution table was entered into a TI calculator. All the data values and frequencies are visible in the screenshot.
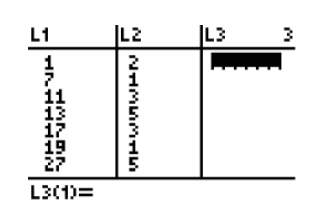
What is the mean of the data?
Vocabulary
| Term | Definition |
|---|---|
| frequency distribution table | A frequency distribution table lists the data values, as well as the number of times each value appears in the data set. |
| ungrouped data | Ungrouped data is data that is listed. |
Additional Resources
Video: Ungrouped Data to Find the Mean Principles
Activities: Ungrouped Data to Find the Mean Discussion
Lesson Plans: Using Ungrouped Data to Find the Mean Lesson Plan
Practice: Ungrouped Data to Find the Mean
Real World: Ungrouped Data to Find the Mean