
4.6: Median of Large Sets of Data
- Page ID
- 5720
Median of Large Sets of Data
Often, the number of data values is quite large, and the task of organizing the data can take a great deal of time. To help organize data, the TI-83 calculator can be used. The following examples will show you how to use the calculator to organize data and find the median for the data values.
Finding the Median Using a Calculator
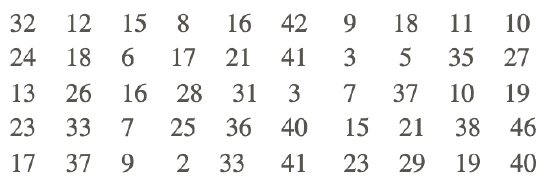
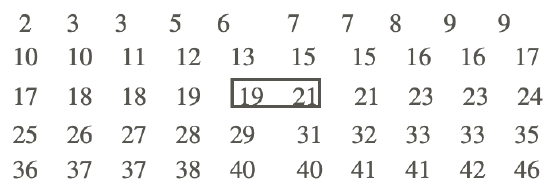
The local police department spent the holiday weekend ticketing drivers who were speeding. 50 locations within the state were targeted as being ideal spots for drivers to exceed the posted speed limit. The number of tickets issued during the weekend in each of the locations is shown in the following table. What is the median number of speeding tickets issued? Use your TI calculator to find the answer.

Using the TI-83 calculator:
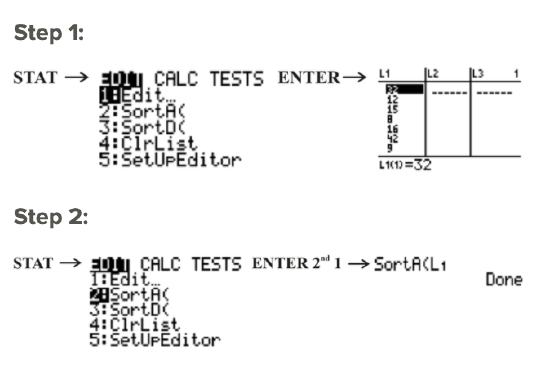
The numbers that you entered into L1 are now sorted from smallest to largest.
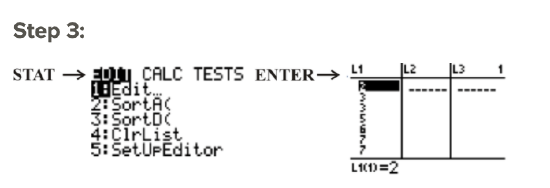
You can now scroll down the list to reveal the ordered numbers.
There are 50 data values in the table. The median will be the mean of the number before the n+1/2 position and the number after the n+12 position: n+1/2=50+1/2=51/2=25.5. The number before the 25.5 position is 19, and the number after the 25.5 position is 21. This means that the median is 19+21/2=40/2=20.
Calculating the Median Without Sorting Data
Calculate the median in the previous example without sorting the data.
The following are 2 ways that you can use the TI-83 to determine the median of the values without sorting the data.
Method One:
All of the data values have been entered into L1. The median of the data values can now be determined by using the TI-83 as follows
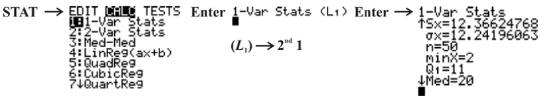
Med = 20 indicates that the median of the data values in L1 is 20.
Method Two:
Above the 0 key is the word CATALOG, and this function acts like the yellow pages of a telephone book. When you press 2ND 0 to access the CATALOG menu, an alphabetical list of terms appears. You can either scroll down to the word median (this will take a long time) or press the blue ÷ to access all terms beginning with the letter ‘m’.
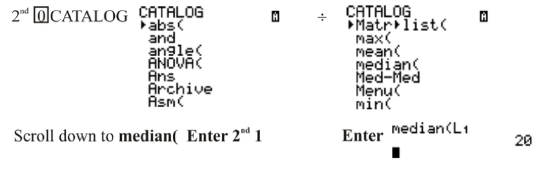
Again, the median of the values in L1 is 20.
Whichever method you use, the result will be same. Using technology will save you time when you are determining the median of a set of data values.
Example C
The following data values represent the numbers of chocolate bars sold by students during a recent fundraising campaign. What was the median number of chocolate bars sold? Use your TI calculator to find the answer.
| Number of Bars | Number of Students |
|---|---|
| 11 | 6 |
| 12 | 8 |
| 13 | 5 |
| 14 | 13 |
| 15 | 17 |
| 16 | 15 |
When a set of data values is given in the form of a frequency table, technology is often used to determine the median. Using the TI-83 calculator:
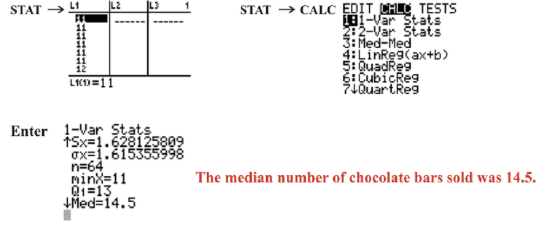
Notice that in this example, each of the individual data values was entered into LI to calculate the median.
Example
Example 1
Calculate the median for the data in the last example by entering the frequency table and not each of the individual data values into your calculator. The data is shown again below:
| Number of Bars | Number of Students |
|---|---|
| 11 | 6 |
| 12 | 8 |
| 13 | 5 |
| 14 | 13 |
| 15 | 17 |
| 16 | 15 |
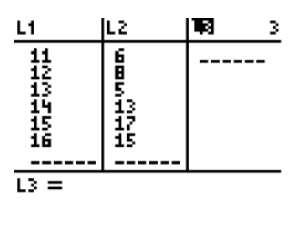
First, the frequency table can be entered into L1 and L2 as follows:
Next, press 2ND MODE to go back to the main screen, and then press 2ND STAT and go to the MATH menu:

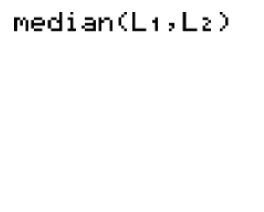
Choose median by pressing 4 or by using the down arrow and pressing ENTER, and then enter L1 and L2 separated by a comma and close the parentheses so that you have median(L1, L2):
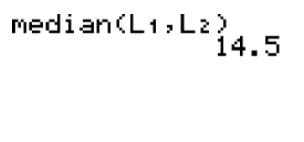
Finally, press ENTER to calculate the answer:
Review
- A minor hockey league has 50 active players who range in age from 10 years to 15 years. The following table shows the ages of the players.

| Age of Players(yrs) | Number of Players |
|---|---|
| 10 | 6 |
| 11 | 8 |
| 12 | 7 |
| 13 | 11 |
| 14 | 10 |
| 15 | 8 |
Use your TI calculator to determine the median age of the players.
- A die was thrown 14 times, and the results of each throw are shown:

3. At a local golf club, 100 players competed in a 1-day tournament. The fifth hole of the course is a par 6. The scores of each player on this hole were recorded, and the results are shown below:

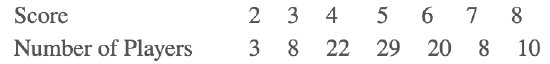
Use your TI calculator to find the median score for the players.
4. A math teacher at a local high school begins every class with a warm-up quiz based on the work presented the previous day. Each test consists of 6 questions valued at 1 point for each correct answer. The results of Monday’s quiz for the 40 students in the class are shown below:

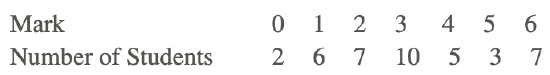
What is the median score for Monday’s quiz? Use your TI calculator to find the answer.
5. In Canada, with the loonie and the toonie, you could have a lot of coins in your pocket. A number of high school students were asked how many coins they had in their pocket, and the results are shown in the following table:

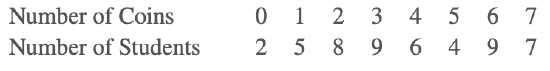
Use your TI calculator to find the median number of coins that a student had in his or her pocket.
6. A group of 12 students participated in a local dirt bike race that required them to cover a 1-mile course in the fastest time possible. The times, in minutes, of the 12 participants are shown below:

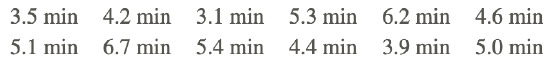
What is the median time of the participants in the race? Use your TI calculator to find the answer.
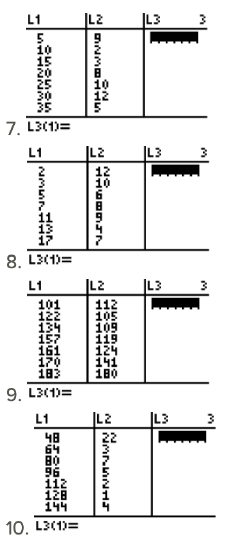
For the data in each of the following frequency tables, find the median. All of the data is shown in each of the screenshots.
Additional Resources
Video: Median of Large Sets of Data Principles
Activities: Median of Large Sets of Data Discussion Questions
Lesson Plans: Using Technology to Find the Median Lesson Plan
Practice: Median of Large Sets of Data
Real World: Median of Large Sets of Data