
5.3: Applications of Variance and Standard Deviation
- Page ID
- 5727
Applications of Variance and Standard Deviation
Your coach has decided to let you figure this out for yourself. He tells you that the scores were normally distributed and provides you with a list of the other mean scores. These average scores are in no particular order. In other words, they are random.
54 88 49 44 96 72 46 58 79 92 44 50 102 80 72 66 64 61 60 56 48 52 54 60 64 72 68 64 60 56 52 55 60 62 64 68
We will discover how your mean bowling score compares to that of the other bowlers in the following example.
Comparing Mean Scores
Use technology to determine the mean and standard deviation of the following bowling averages, which represent a small population.
54 88 49 44 96 72 46 58 79 92 44 50 102 80 72 66 64 61 60 56 48 52 54 60 64 72 68 64 60 56 52 55 60 62 64 68
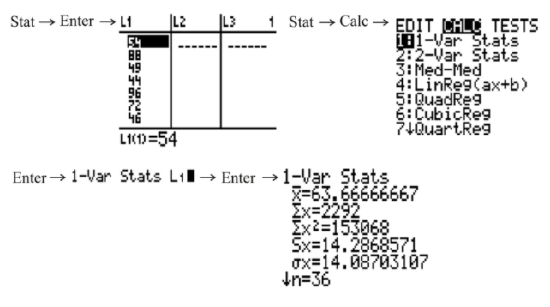
From the list, you can see that the mean of the bowling averages is approximately 63.7 and that the standard deviation is approximately 14.1.
Now you can represent the data that your teacher gave to you for the bowling averages of the players in your league on a normal distribution curve. Again, the mean bowling score was 63.7, and the standard deviation was 14.1.
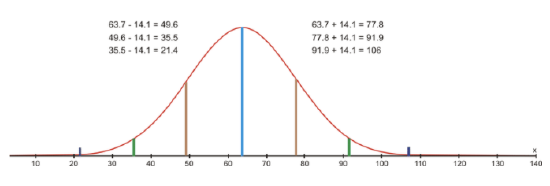
From the normal distribution curve, you can see that your average bowling score of 70 is within 1 standard deviation of the mean. You can also see that 68% of all the data is within 1 standard deviation of the mean, so you did very well bowling this semester. You should definitely return to the league next semester.
Determining the Variance
Use technology to determine the variance of the bowling averages in the previous example.
To use technology to calculate the variance involves naming the lists according to the operations that you need to do in order to determine the correct values. In addition, you can use the CATALOG menu of the calculator to determine the sum of the squared variations. You could also use the CATALOG menu to find the mean of the data, but since you are now familiar with 1-Var Stats, you can use this method.
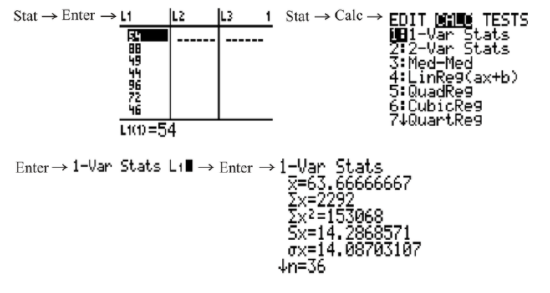
The mean of the data is approximately 63.7. L2 will now be renamed L1−63.7 to compute the values for (x−x̅).
Likewise, L3 will be renamed L22.
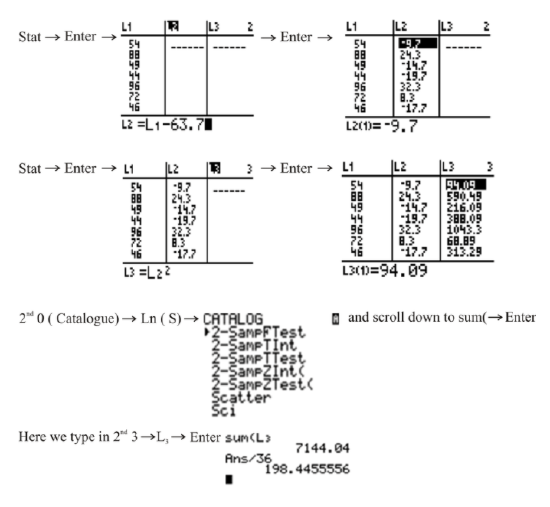
The sum of the values in L3 divided by the number of data values (36) is the variance of the bowling averages.
Using Technology
Use technology to verify that the answer in the previous example is correct.
Although it was not explicitly stated, you may have noticed from the previous 2 concepts that the standard deviation of a data set is just the square root of the variance of the data set. Another way of saying this is that variance of a data set is the square of the standard deviation of the data set. Therefore, in order to find the variance of the bowling averages in Example B, you could have just squared the standard deviation of the bowling averages that you found in Example A.
You can see above that the exact value returned for the standard deviation of the bowling averages was 14.08703107. Let's square this value and see what we get:
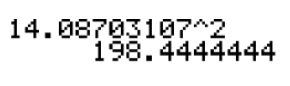
The calculator returned 198.4444444, which is extremely close to the answer of 198.4455556 that we got in Example B. In fact, the only reason why these 2 answers are different at all is simply because of rounding.
Example
Justin scored 84 out of 100 on a test, and he wants to know how his score compares to those of the other students in his class. His teacher has decided to let him figure this out for himself. Justin's teacher told him that the test scores were normally distributed and provided him with a list of the other test scores, which represented a small population. These test scores were in no particular order. In other words, they were random.
Example 1
Use technology to find the mean, standard deviation, and variance of these test scores, which were as follows:
74687984 92825577911008480997459888953708677100 949088839362699685 7590817173
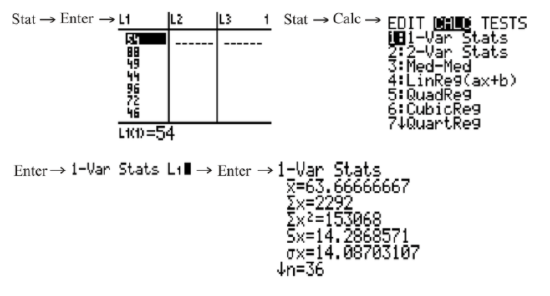
To find the mean, variance, and standard deviation of these test scores, first press STAT on your TI calculator and choose Edit on the EDIT menu. Enter all of the scores into L1, and then press 2ND MODE to go back to the main screen.
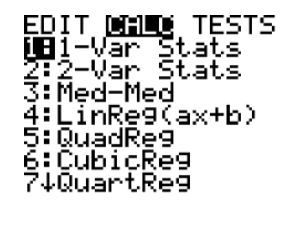
Next, press STAT, go to the CALC menu, and choose 1-Var Stats.
After pressing ENTER to choose 1-Var Stats and then pressing ENTER again, you should see the following screen:
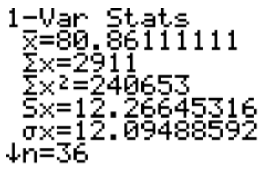
You can see that the mean of the test scores was approximately 80.9, while the standard deviation was approximately 12.1. This means that Justin's test score was less than 1 standard deviation above the mean. To calculate the variance of the test scores, square the exact value of the standard deviation, which is 12.09488592. This can be done as follows:
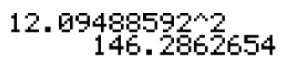
Therefore, the variance of the test scores was approximately 146.3.
Review
- If the standard deviation of a population is 6, the population variance is:
a. 2.44
b. 3
c. 6
d. 36 - If the variance of a sample is 25, the sample standard deviation is:
- 5
- 25
- 125
- 625
- Suppose data are normally distributed, with a mean of 50 and a standard deviation of 10. What would be the variance?
a. 10
b. 40
c. 50
d. 100 - Suppose data in a population are normally distributed, with a variance of 64. What would be the population standard deviation?
a. 4
b. 8
c. 16
d. 64 - What is the population variance of the following data values? 4038424735
a. 4.03
b. 4.51
c. 16.24
d. 20.34 - What is the sample variance of the following data values? 114120138125119
a. 8.18
b. 9.15
c. 66.96
d. 83.7 - What is the population standard deviation of the following data values? 3.32.98.511.5
a. 3.61
b. 4.17
c. 6.55
d.13.52 - What is the sample standard deviation of the following data values? 34.240.131.944.8
a. 5.05
b. 5.83
c. 25.51
d. 34.02 - Mrs. Meery has recorded her exam results for the current mathematics exam. The results are shown below:

64 98 78 76 56 48 89 78 69 90 89 97 67 58 59 50 78 89 68 83 72 91 (a) Determine the mean for this data with technology. (b) Determine the standard deviation for this data with technology. (c) Determine the variance for this data with technology. (d) Draw a normal distribution curve to represent the data Mrs. Meery found in her class.
Mrs. Landry decided to do the same analysis as Mrs. Meery for her math class. She has recorded her exam results for the current mathematics exam. The results are shown below: 89 87 81 84 76 72 67 49 55 38 67 90 59 87 89 69 92 90 79 84 69 93 85 70 87 80 (a) Determine the mean for this data with technology. (b) Determine the standard deviation for this data with technology. (c) Determine the variance for this data with technology. (d) Draw a normal distribution curve to represent the data Mrs. Landry found in her class.
Vocabulary
| Term | Definition |
|---|---|
| disseminated data | Disseminated data is data that has been given out to others. |
| normal distribution curve | A normal distribution curve is a symmetrical curve that shows the highest frequency in the center with an identical curve on either side of the center. |
| tabular data | Tabular data is data presented in the form of a table, or, depending on the use, it may refer to data points separated by tabs. |
Additional Resources
PLIX: Play, Learn, Interact, eXplore - Variance of a Data Set
Video: Applications of Variance and Standard Deviation Principles
Activities: Applications of Variance and Standard Deviation Discussion Questions
Lesson Plans: Calculating the Variance and Standard Deviation with Technology Lesson Plan
Practice: Applications of Variance and Standard Deviation
Real World: Variance of a Data Set