
5.4: Coefficient of Variance
- Page ID
- 5728
Suppose you were given three different sets of data, one with a variance of 3.2 and mean of 9.2, another with a variance of 16 and mean of 45, and the third with a variance of 155 and mean of 2100. If you were asked which set was the least centrally clustered, how could you find out?
Coefficient of Variation
In a prior lesson, we touched on the idea that variance is calculated as a single value, but that the level of clustering that it represents depends on the mean of the data. One measure that accounts for the differences between means when comparing variance is called the coefficient of variation, which is defined as:
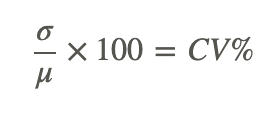
Where σ=standard deviation, μ=arithmetic mean, and CV%=coefficient of variation
Recall that σ, the standard deviation, is simply the square root of σ2, the variance.
There are many ways to compare the relative spread of different data sets, and we will review some of them in more detail in later lessons, particularly in the chapter on ANOVA.
Finding the Coefficient of Variance Percentage
1. What is the CV% of a data set with a variance of 23.91 and mean of 283?
Recall that CV% (coefficient of variance percentage) is equal to 100 times the ratio of the standard deviation to the mean. This means that we should start by finding the standard deviation.
- σ=(σ2)0.5 So the standard deviation would be 23.910.5, or 4.89
- CV%=4.89/283×100=1.728%
2. What is the CV% of the data in the table below?
| Spinner | Frequency |
| 1 | 4 |
| 2 | 9 |
| 3 | 5 |
| 4 | 8 |
| 5 | 9 |
| 6 | 10 |
| 7 | 7 |
First find the population variance and standard deviation.
- μ=(4+9+5+8+9+10+7)/52=7.43
- Sum of squared deviances=32.615
- Variance=32.615/7=4.659
- Standard deviation=4.6590.5=2.16
CV%=2.16/7.43×100=29.07%
Comparing Coefficients of Variation
Which population data set has the highest and which the lowest coefficient of variation?
x={14,16,17,19,16,19}
y={22,24,27,24,29,35,31}
z={41,44,47,44,40,49,52}
First find the mean and standard deviation of each set:
- Set x:
- Mean:101/6=16.83
- Variance:3.139
- Standard Deviation:3.1390.5=1.772
- Set y:
- Mean:192/7=27.43
- Variance:17.96
- Standard Deviation:17.960.5=4.24
- Set z:
- Mean:317/7=45.29
- Variance:15.92
- Standard Deviation:15.920.5=3.99
Divide the standard deviation of each set by its mean, multiply by 100, and compare the percent coefficients of variation:
- Coefficient of variation set x: 1.772/16.83=10.53%
- Coefficient of variation set y: 4.24/27.43=15.46%
- Coefficient of variation set z: 3.99/45.29=8.8%
Set z has the lowest coefficient of variation and set y has the highest.
Earlier Problem Revisited
Suppose you were given three different sets of data, one with a variance of 3.2 and mean of 9.2, another with a variance of 16 and mean of 45, and the third with a variance of 155 and mean of 2100. If you were asked which set was the least centrally clustered, how could you find out?
By finding the square root of the variance (the standard deviation), and dividing the standard deviation by the mean, you can find the coefficient of variation. Comparing the coefficients of variation allows you to directly compare the data clustering of each set, since a higher CV% means the data is more spread out.
Examples
Example 1
3240, 3260, 3250, 3280, 3280, 3300, 3310, 3270
Start by finding the mean and the standard deviation:
- Arithmetic mean: 26,190/8=3273.75
- Find the variance (here I am using “mean of squares minus the square of mean”) :

- Subtract the squared mean (3273.752=10,715,802.25) to get the variance: 10,717,937.5−10,715,802.25=2135.25
- The square root of the variance is the standard deviation: 2135.250.5=46.209
Divide the standard deviation by the mean, and multiply by 100 to get CV%
46.209/3273.75×100=1.4115%
Example 2
34.4. 34.7, 34.7, 34.6, 34, 34.1, 31, 31.3
Find the mean and standard deviation:
- Arithmetic mean:
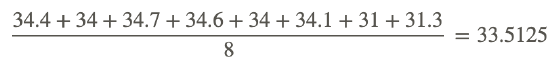
- Standard deviation (square root of the “mean of squares minus square of mean”):
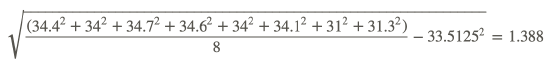
Divide the standard deviation by the mean, and multiply by 100 to get CV%
1.388/33.5125×100=4.0414%
Example 3
898.22, 990.6, 992, 996.9, 981.1, 986, 975
Find the mean and standard deviation:
- Arithmetic mean:
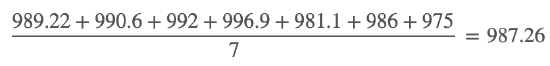
- Standard deviation:
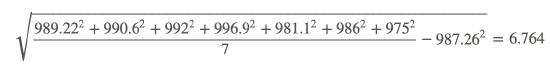
Divide the standard deviation by the mean and multiply by 100 to get CV%:
6.764/987.26×100=.685%
Review
Find the coefficient of variation %:
- 10, 11.1, 10.33, 10.63, 11, 11.2, 11.36, 10.46
- 275, 280.7, 283, 279, 284.2, 280, 282
- 7100.5, 7080, 7065.9, 7100, 7096, 7112, 7116.1
- 37, 35.3, 32.7, 34, 36, 36.2, 33.3, 33.8
- 3607, 3600, 3604, 3631, 3606
- 702, 704, 712, 716, 721, 716, 722
- 3370, 3300.5, 3366, 3306.6, 3310, 3336, 3301.3
- 34.4, 34, 34.7, 34.6, 34, 34.1, 31, 31.3
- 989.22, 990.6, 992, 996.9, 981.1, 986, 985
- 10.2, 16.34, 10.33, 10.63, 10.2, 10.44, 16.36, 10.46
- 3240, 3260, 3250, 3280, 3280, 3300, 3310, 3270
Vocabulary
| Term | Definition |
|---|---|
| coefficient of variation | The coefficient of variation is a measure of data clustering calculated by dividing the standard deviation by the mean, and may be used to compare the spreads of different data sets. |
| Harmonic mean | A harmonic mean is calculated by dividing the number of values in the set by the sum of the inverses of the values in the set. |
Additional Resources
PLIX: Play, Learn, Interact, eXplore - Diverse Populations
Practice: Coefficient of Variation