
5.1.4: Transformations of Polar Graphs
- Page ID
- 4198
Alteration of graph based on changing constants and/or function of a polar equation.
While playing around with your calculator one day, you create a polar plot that looks like this.
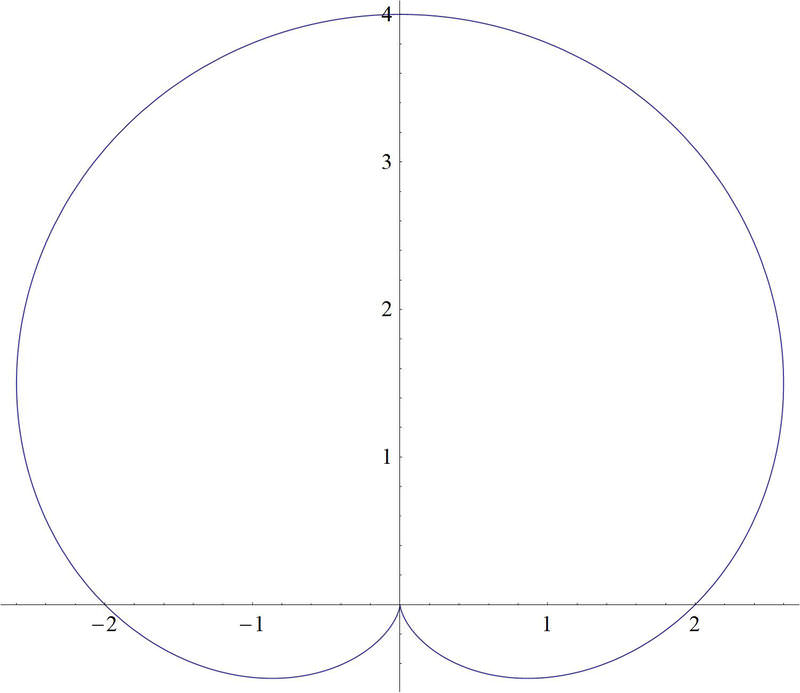
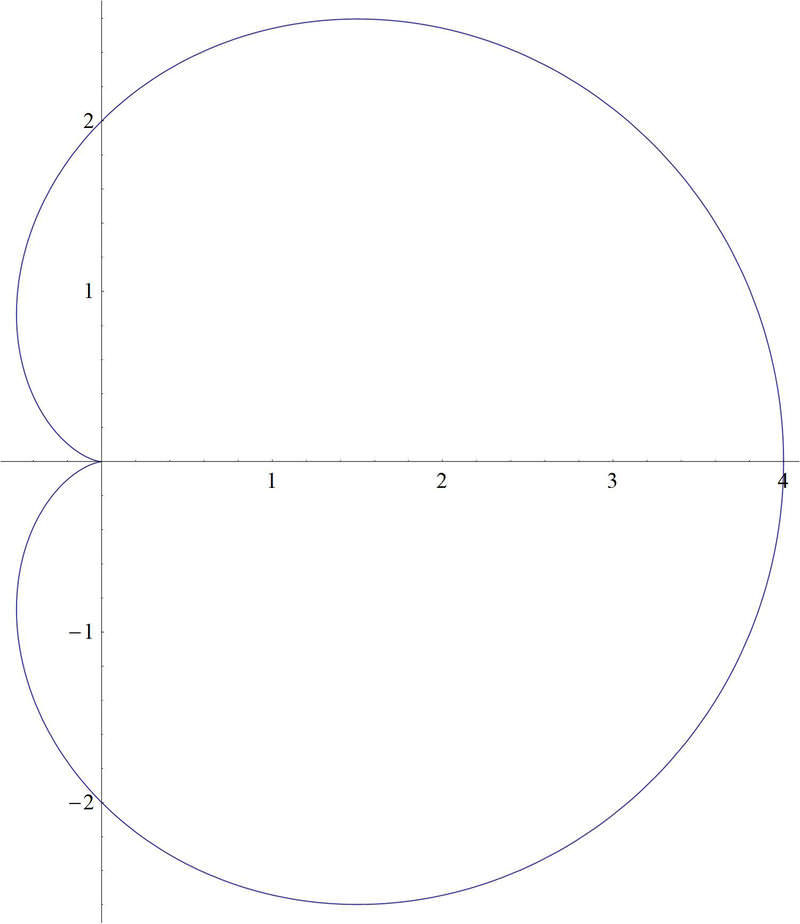
Your teacher tells you that this is a polar plot with an equation \(2+2\sin \theta \). You decide you'd like to rotate the graph, so that it is actually on its side, like this
Transforming Polar Graphs
Just as in graphing on a rectangular grid, you can also graph polar equations on a polar grid.
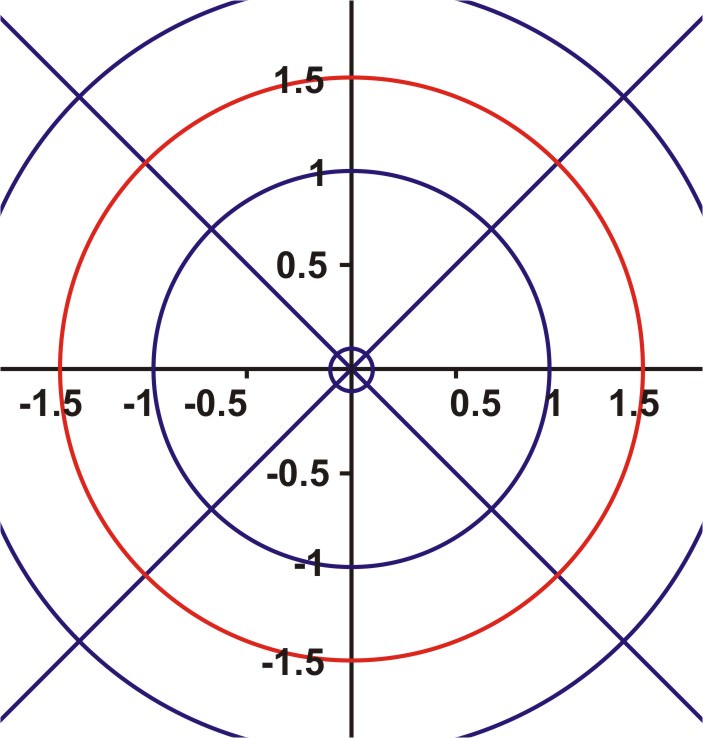
These equations may be simple or complex. To begin, you should try something simple like \(r=k\) or \(\theta =k\) where \(k\) is a constant. The solution for \(r=1.5\) is simply all ordered pairs such that \(r=1.5\) and \(\theta \) is any real number. The same is true for the solution of \(\theta =30^{\circ} \). The ordered pairs will be any real number for \(r\) and \(\theta \) will equal \(30^{\circ} \). Here are the graphs for each of these polar equations.
Graphing Equations
1. On a polar plane, graph the equation \(r=1.5\)
The solution is all ordered pairs of \((r,\theta )\) such that \(r\) is always 1.5. This means that it doesn’t matter what \(\theta \) is, so the graph is a circle with radius 1.5 and centered at the origin.
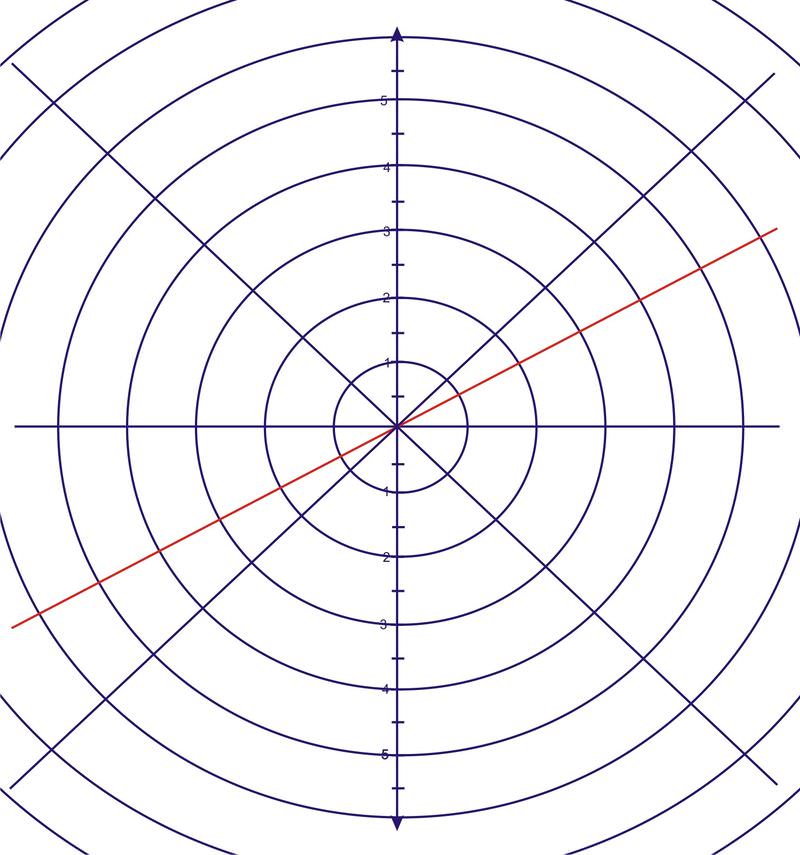
2. On a polar plane, graph the equation \(\theta =30^{\circ}\)
For this problem, the \(r\) value, or radius, is arbitrary. \(\theta \) must equal \(30^{\circ} \), so the result is a straight line, with an angle of elevation of \(30^{\circ} \).
To begin graphing more complicated polar equations, we will make a table of values for \(y=\sin \theta \) or in this case \(r=\sin \theta \). When the table has been completed, the graph will be drawn on a polar plane by using the coordinates \((r,\theta )\).
3. Graph the following polar equations on the same polar grid and compare the graphs.
\(\begin{array}{ll}
r=5+5 \sin \theta & r=5-5 \sin \theta \\
r=5(1+\sin \theta) & r=5(1-\sin \theta)
\end{array}\)
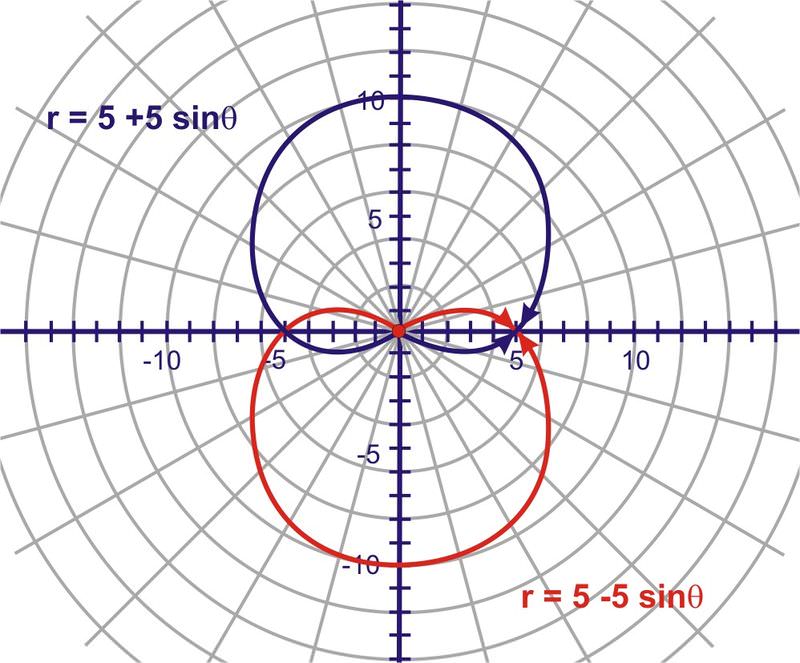
The cardioid is symmetrical about the positive \(y\)−axis and the point of indentation is at the pole. The result of changing + to - is a reflection in the \(x\)−axis. The cardioid is symmetrical about the negative \(y\)−axis and the point of indentation is at the pole.
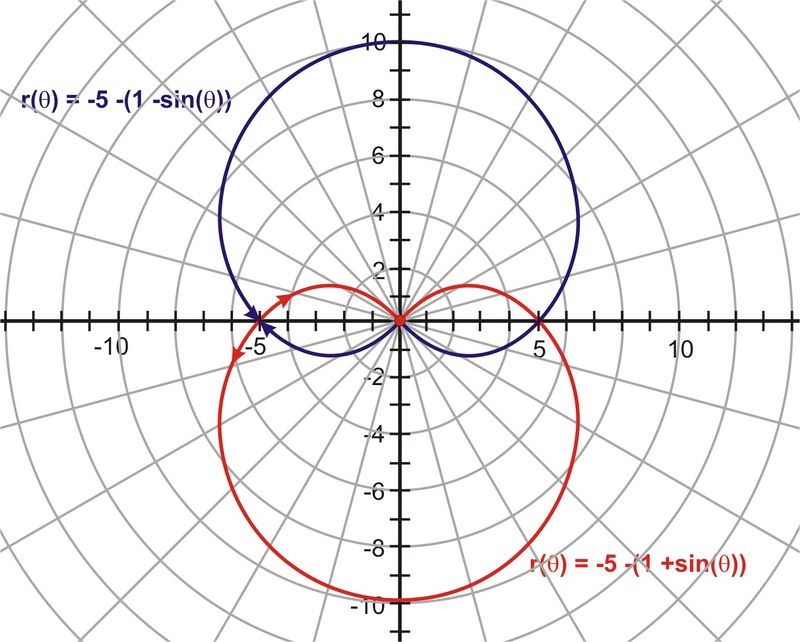
Figure \(\PageIndex{6}\)
Changing the value of ‘‘\(a\)′′ to a negative did not change the graph of the cardioid.
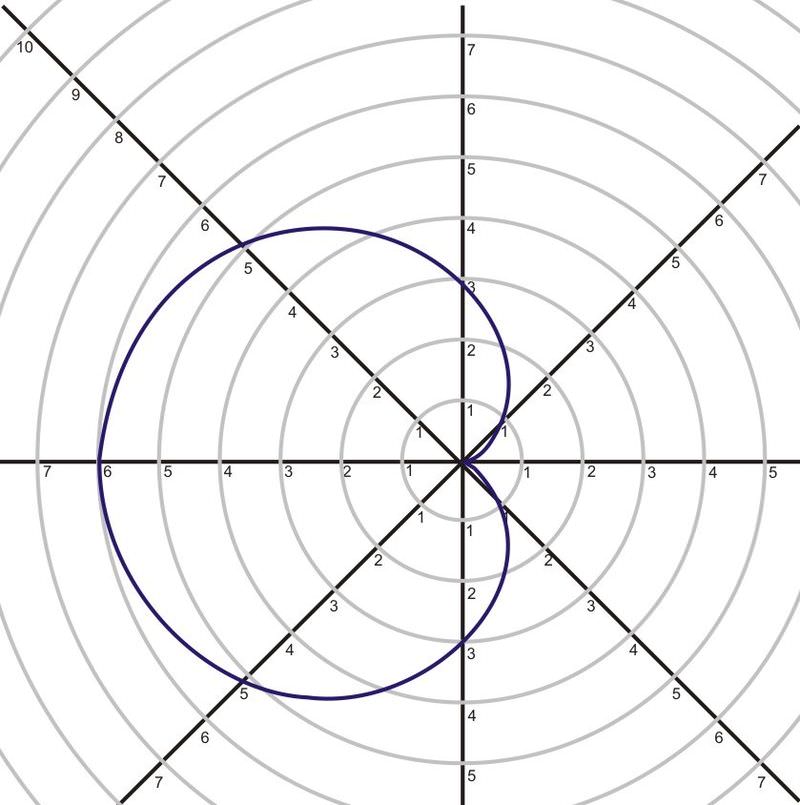
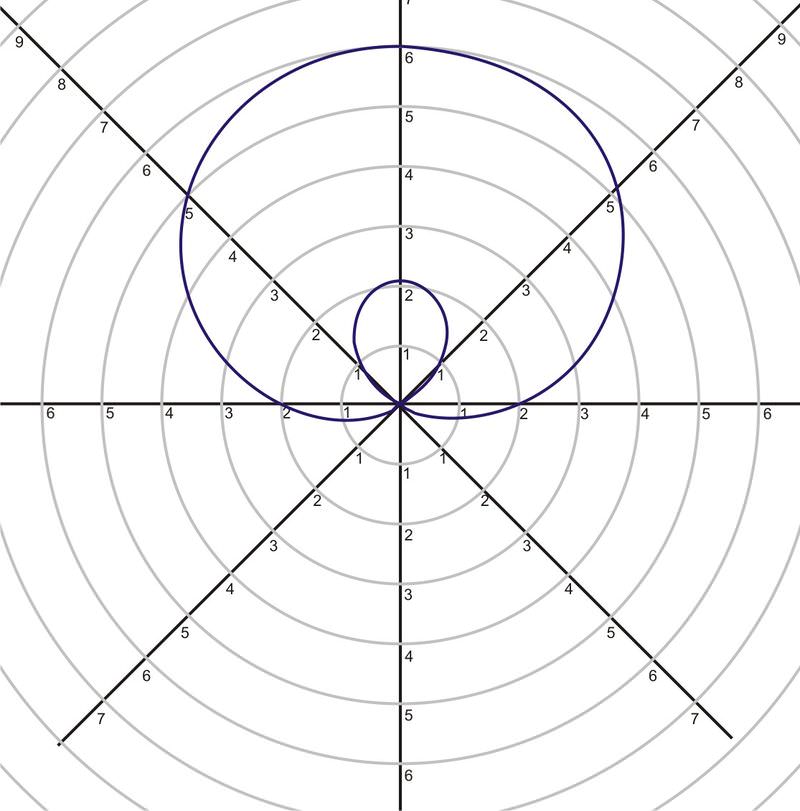
It is also possible to create a sinusoidal curve called a limaçon. It has \(r=a\pm b\sin \theta \) or \(r=a\pm b\cos \theta \) as its polar equation. Not all limaçons have the inner loop as a part of the shape. Some may curve to a point, have a simple indentation (known as a dimple) or curve outward. The shape of the limaçon depends upon the ratio of ab where a is a constant and b is the coefficient of the trigonometric function.
As we've seen with cardioids, it is possible to create transformations of graphs of limaçons by changing values of constants in the equation of the shape.
Earlier, you were asked to graph a polar equation.
Solution
As you've seen in this section, transformations to the graph of a cardioid can be accomplished by 2 different ways. In this case, you want to rotate the graph so that it is around the "\(x\)" axis instead of the "\(y\)" axis. To accomplish this, you change the function from a sine function to a cosine function:
\(r=2+2\cos \theta\)
Graph the curve \(r=−3−3\cos \theta\)
Solution
\(r=−3−3\cos \theta \).
Graph the curve \(r=2+4\sin \theta\)
Solution
\(r=2+4\sin \theta\)
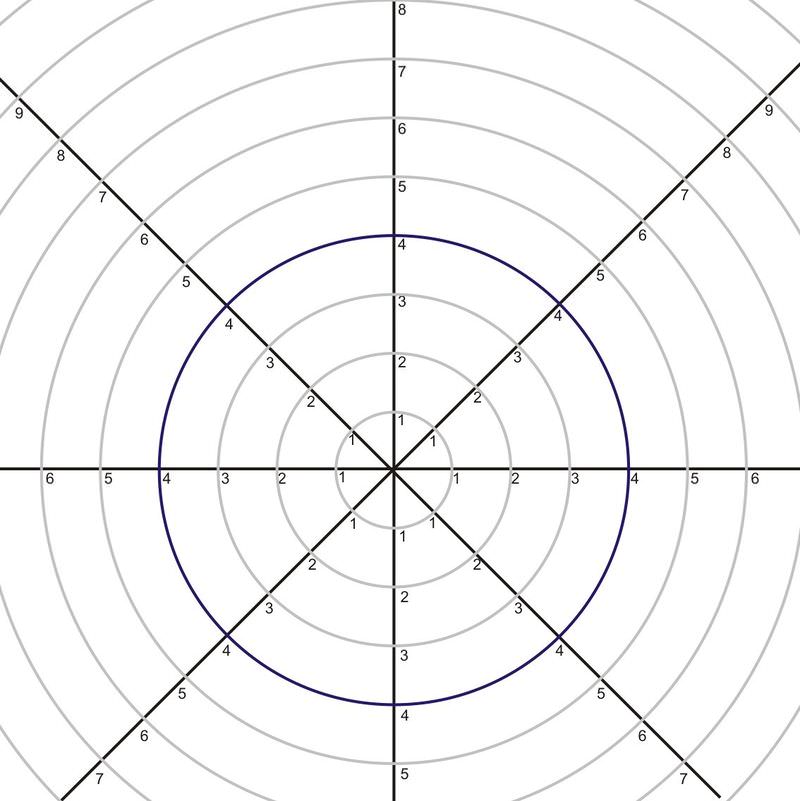
Graph the curve \(r=4\).
Solution
\(r=4\)
Review
Graph each equation.
- \(r=4\)
- \(\theta =60^{\circ}\)
- \(r=2\)
- \(\theta =110^{\circ}\)
Graph each function using your calculator and sketch on your paper.
- \(r=3+3\sin (\theta )\)
- \(r=2+4\sin (\theta )\)
- \(r=1−5\sin (\theta )\)
- \(r=2−2\sin (\theta )\)
- \(r=3+6\sin (\theta )\)
- \(r=−3+6\sin (\theta )\)
- Analyze the connections between the equations and their graphs above. Make a hypothesis about how to graph \(r=a+b\sin (\theta )\) for positive or negative values of \(a\) and \(b\) where \(b\geq a\).
Graph each function using your calculator and sketch on your paper.
- \(r=3+3\cos (\theta )\)
- \(r=2+4\cos (\theta )\)
- \(r=1−5\cos (\theta )\)
- \(r=2−2\cos (\theta )\)
- \(r=3+6\cos (\theta )\)
- \(r=−3+6\cos (\theta )\)
- Analyze the connections between the equations and their graphs above. Make a hypothesis about how to graph \(r=a+b\cos (\theta )\) for positive or negative values of \(a\) and \(b\) where \(b\geq a\).
Review (Answers)
To see the Review answers, open this PDF file and look for section 6.3.
Additional Resources
Video: Example of Graph of Polar Equation
Practice: Transformations of Polar Graphs