6.16: Measuring Earthquake Magnitude
- Page ID
- 5416
Have you ever felt an earthquake?
Small earthquakes are fairly common in some parts of the world. Depending on the quake, the land, and the setting, people experience them differently. You may wonder why your chair is moving, when you are sitting still. You may think someone is running across the roof. In a skyscraper, you may be swaying. Seismometers quantify this and record the energy released in the quake.
Measuring Seismic Waves
Seismic waves are measured on a seismograph. Seismographs contain a lot of information, and not just about earthquakes.
Seismometers
A seismograph is a machine that records seismic waves. In the past, seismographs produced a seismogram. A seismogram is a paper record of the seismic waves the seismograph received. Seismographs have a weighted pen suspended from a stationary frame. A drum of paper is attached to the ground. As the ground shakes in an earthquake, the pen remains stationary but the drum moves beneath it. This creates the squiggly lines that make up a seismogram (Figure below).
This seismograph records seismic waves.
Modern seismometers record ground motions using electronic motion detectors. The data are then kept digitally on a computer.
What We Learn from Seismograms
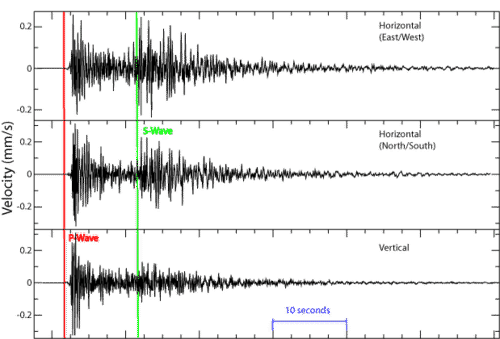
Seismograms contain a lot of information about an earthquake: its strength, length, and distance. Wave height is used to determine the magnitude of the earthquake. The seismogram shows the different arrival times of the seismic waves (Figure below). The first waves are P-waves since they are the fastest. S-waves come in next and are usually larger than P-waves. The surface waves arrive just after the S-waves. If the earthquake has a shallow focus, the surface waves are the largest ones recorded.
These seismograms show the arrival of P-waves and S-waves.
A seismogram may record P-waves and surface waves, but not S-waves. This means that it was located more than halfway around the Earth from the earthquake. What does that mean? Earth's outer core is liquid. S-waves cannot travel through liquid. So the liquid outer core creates an S-wave shadow zone on the opposite side of the Earth from the quake.
Like most things, seismographs are now digital. Information from seismic waves is fed into computers at seismic stations around the world.
Further Reading
Predicting Earthquakes
Earthquake Damage
Earthquake Safe Structures
Staying Safe in an Earthquake
Summary
- A seismograph records seismic waves on a seismogram. A seismometer is a digital seismic wave recorder.
- S-waves do not travel through liquids. So a seismogram with no S-waves is on the other side of the planet from the quake.
- Seismographs yield a tremendous amount of information about an earthquake.
Review
- Define seismograph, seismogram, and seismometer.
- What does a seismogram with P-waves but not S-waves mean and why?
- How can you tell S-wave arrival from the end of the P-wave?
Explore More
- Why was the Alaska Earthquake on March 27, 1964 so large? How large was it?
- Name the types of plate boundaries that experience earthquakes.
- When geologists discovered new oceanic crust forming at divergent plate boundaries, what two explanations did they come up with?
- What happens at a subduction zone?
- What is the common cause of all 6 megathrust earthquakes that have been recorded since 1900?
- Why is it impossible (at least at this time) to predict when an earthquake will take place?


