2.2: Stellar Spectra
- Page ID
- 5651
In 1835, the French philosopher Auguste Comte predicted that we would never know anything about the chemical composition of stars. He could not have been more wrong. Fraunhofer was already beginning to discover the phenomenon of spectroscopy and it has turned out to be an extraordinarily powerful technique in astronomy. It has been said (by Harvard astronomer Andrea Dupree in her prize lecture at the AAS meeting in January 2020) that if a picture is worth a thousand words, a spectrum is worth a thousand pictures. With spectroscopy we can trace velocities and we know the composition of stars throughout the galaxy and beyond with exquisite detail. This powerful technique was also used to detect the first planets orbiting other stars.
Spectroscopy
Light is the manifestation of pure energy. It travels at a constant speed in a vacuum. However, there are small wavelength-dependent differences in the speed of light passing through a medium like water or glass. As a result, when white light passes through a prism, it produces a rainbow of color: red, orange, yellow, green, blue, indigo, violet (the notorious ROY G BIV). This apparition of light is called a continuum (or "continuous") spectrum. To the eye, the wavelengths line up as a continuous, uninterrupted sequence. Since our brain interprets different wavelengths of light (in the visible spectrum) as color, we see a familiar, colorful rainbow.

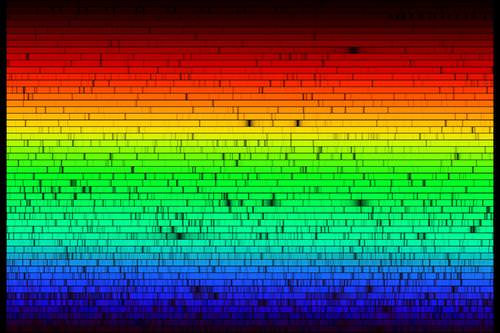
When light from the Sun passes through a prism, it casts a rainbow of light as well. However if the intensity of the rainbow is strong enough and if the dispersion is high enough, narrow dark lines, like those shown in the Figure below, can be observed. Light of all wavelengths should be emitted from the Sun - we should see a continuum spectrum. So, why are there dark lines of missing light? What happened to those wavelengths of light?

Let us start the story by tracing the origin of light from the Sun. As we discuss in the next chapter, energy is produced from fusion reactions in the cores of stars. Initially, that energy does not have a continuous spectrum. Most of the radiation from fusion reactions is in the form of high energy gamma rays that human eyes cannot even see. However, (as noted in the previous chapter) as those gamma photons leave the core of the Sun, they interact with atoms, or "matter" in the Sun. In some cases, the photons are briefly absorbed by atoms and re-emitted in a random direction. In other cases, the photons simply scatter. Both of these interactions between photons and matter can result in energy loss for the photon.
In fact, energy is always conserved during interactions with matter. Energy seems to change because two or more lower energy photons can be emitted in place of the higher energy photon that is absorbed. The sum of the energy from the outgoing photons equals the energy of the incoming photons.
\[E_{initial}\,=\sum_{i=0}^n\,E_i\,=\,E_{i+1}\,...\,E_n\]
The energy of a photon is given by \(E\,=\,h\nu\) (where h = Planck's constant and \(\nu\) equals the frequency of the photon). The energy of one photon decreases only if one or more additional photons are emitted. This process of going from a fewer number of high energy photons to a larger number of lower energy photons is called thermalization.

There are billions of interactions between photons and atoms inside the Sun. As a result, a continuum of EM radiation emerges just below the photosphere of the Sun. The photosphere is defined as the layer we "see" - where most of the photons in the photosphere escape and finally begin their journey through space.
We approximate the energy of a star as a blackbody; however, the continuum spectrum is modified as it leaves the photosphere of the star. In this way, a stellar spectrum deviates from a true blackbody spectrum. Because the photosphere is cooler than the inner part of the star, atoms in the photosphere absorb specific wavelengths of light with energies that correspond exactly to the energy required to move an electron from one quantum mechanical state to another.
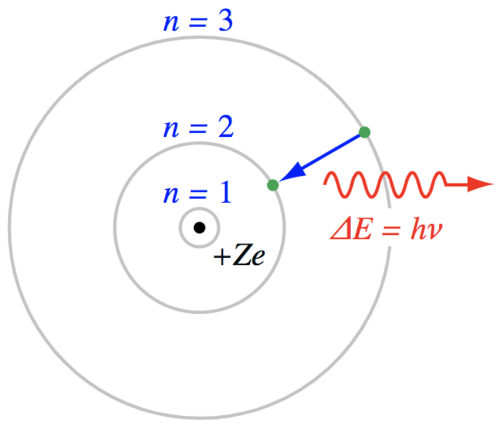
The atom is often diagrammed as a Bohr model with the positively charged protons and neutral neutrons in the nucleus. The number of electrons is equal to the number of protons in an electrically neutral atom. As we will note again when we discuss the chemistry of life, this is a simplification of the fascinating nature of electrons and atoms, but the Bohr model is conceptually useful. In the lowest energy state, the electrons will fill the orbital shells according to the rules of quantum mechanics.
It seems reasonable that the electrons would not move down to an already filled shell in the atom, but what prevents an electron from moving up to a higher energy shell? It just needs some energy to make that transition. If a passing photon has an energy that is exactly equal to the energy difference between any two orbital shells, there is some statistical probability that the atom will absorb the photon, pushing the electron to a higher energy state. That requirement for photon energy is strict with one exception. Photons with enough energy may completely remove an electron, ionizing the atom and leaving any extra energy in the form of kinetic energy for the atom or electron. But, for generating stellar spectra, the photons of interest have an energy that is matched to the energy difference between one or more orbital shells in the Bohr model.
Energetically, the process of absorbing a photon is similar to the action of tossing a ball into the air - the ball gains potential energy but then drops back to the ground. Like the tossed ball, the electron will jump up to a higher orbital shell, but then drop back down to the lower energy state. What happens to the energy when electrons fall back to a lower energy state? The atom loses energy and a photon is emitted. If the electron jumps up one level and drops down to it's original level then the emitted photon has the same energy as the absorbed photon. If the energy of the incoming photon was great enough to push the electron up several energy levels, then a cascade of photons can be emitted as the electron drops through a sequence of orbital shells.

If the photon is re-emitted, why are there dark lines in the continuum spectrum? When an atom releases the absorbed energy (either as a single photon with the same energy as the absorbed photon or as a cascade of lower energy photons), that energy is emitted in a random direction. The direction of the photon has been changed so that the continuum spectrum is now missing photons at those specific wavelengths of light. This appears as a dark "absorption" line imposed upon a bright continuum spectrum.
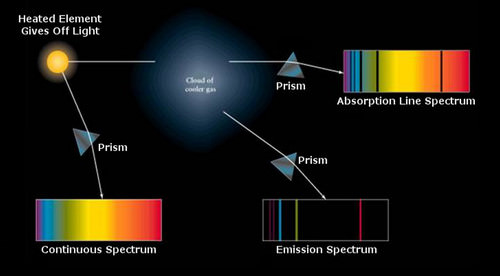
The spectrum from a so-called blackbody in thermal equilibrium is initially a continuum spectrum. If the light from the black body passes through a cooler gas, photons with energy E=h\(\nu\) will be absorbed if and only if the photon energy corresponds exactly to the energy spacing between atomic quantum levels. This process superimposes an absorption spectrum on the blackbody (or continuum) spectrum.
There is a third possibility. If electrons are already in an excited state without a background of blackbody energy, say in a heated gas, then the electrons can spontaneously lose energy and cascade down to lower energy levels, releasing photons with energy h\(\nu\), where that emitted photon energy is exactly the same as the energy spacing of the atomic quantum levels. This physical process produces an emission spectrum with bright lines at specific wavelengths or energies. These three types of spectra: continuum, absorption, and emission are summarized in the figure below.

Most spectra of stars are so-called absorption spectra superimposed on continuum spectra. The process of absorption is possible because the "blackbody" photons pass through a cooler layer of gas where the electrons are in a lower energy state. This condition is typical for stars. If the photosphere were hotter than deeper layers, then the electrons would already be pumped up to higher energy state and the atoms would not be in a state where they could absorb the emerging photons. The absorption lines in a stellar spectrum represent a deviation from a hypothetical black body, but the blackbody law is still a useful construct for characterizing stellar temperatures.
Spectral absorption and emission lines were described above as if they were infinitesimally thin lines - exact energies. Quantum mechanics is more complex. Absorption and emission lines are slightly broadened by a number of effects. The Heisenberg uncertainty principle enforces some energy uncertainty in the electron. The rotation of the star will produce Doppler shifts that broaden absorption lines. Gases in the atmosphere of the star may be cooler than the plasma deep in the star, but at temperatures of a few thousand degrees, there is still turbulence and collisions change the energy of the atoms and therefore the energy of the absorption or emission lines. It is also the case that the ability of a spectrograph to disperse light (the spectral resolution of the instrument) may not be high enough, causing blending of atomic lines. A very high resolution spectrum of the Sun is shown below.

The Doppler effect
If there is relative motion between the observer and an object like a star, the spectrum of the star will be shifted redward or blueward. This phenomenon is called the Doppler effect. Because the universe is expanding, most galaxies are moving away from us. All stars in the Milky Way galaxy are orbiting around the center of our galaxy. From our perspective, some of these stars appear to be moving toward us and some appear to be moving away from us. In addition, we are making observations of stars from a planet that is revolving around the Sun and spinning about an axis. Everything is moving and therefore the Doppler effect is extremely important.
The basic idea is that light is a type of wave. Try this thought experiment. Imagine that you are on a boat in the ocean bouncing with some frequency because large waves rolling under the boat. If you turn on the motor and point your boat in the same direction that the waves are traveling, the waves will appear to pass by the boat with a lower frequency. It is as if the waves in the ocean stretched out or became longer. Now turn your boat around and travel in the opposite direction, riding into the waves. In this case, the waves bounce the boat with a larger frequency, as if the waves are shorter.
In the thought experiment above, the length of the waves in the ocean did not change. But your relative velocity (the boat on the waves) changed and from your perspective, this lead to an "apparent" change in the length of waves. This is the Doppler effect and the same thing happens when we measure wavelengths of light. If we are heading toward the star (or if the star is heading toward us) then we encounter the photons with a higher frequency. The photons appear to be blue-shifted from our point of view. Conversely, if we are moving away from the star (or the star is moving away from us) we encounter the photons from the star appear with a lower frequency; the photons appear to be red-shifted.
Note that it is only the "line of sight" that is affected. In the thought experiment, if your boat had been driving parallel to the waves, they would have hit the boat with the same frequency.
The non-relativistic Doppler equation tells us how the wavelength will change with radial ("line of sight") velocity:
\[\frac{\delta \lambda}}{\lambda}\,=\frac{v}{c}\]
Equation 2 says that the ratio of the change in wavelength relative to the true wavelength is equal to the ratio of the radial velocity to the speed of light. As an example, imagine that a stellar absorption line at 600 nm is shifted in the observed spectrum to 600.2 nm. Using 3e8 m/s for the speed of light, you can can calculate the relative radial velocity between you and the star to be 100,000 m/s. A good astronomer will figure out their velocity and subtract it to get the velocity of the star. So, if our orbital velocity (a combination of rotation and orbit around the Sun) is 24,000 m/s then the actual velocity of the star is (100,000 - 24,000) = 76,000 m/s.
Information content of spectra
Stellar spectra reveal many attributes of stars:
- Composition: each of those dark absorption lines can be traced to electron transitions in specific atoms. A stellar spectrum is an atomic fingerprint, revealing the elemental composition of the star.
- Temperature: approximating the flux from the star as a black body, we can fit a model to the energy distribution and determine the equilibrium temperature of the stellar photosphere - this is also called the effective temperature of the star.
- Radial velocity: as the star moves along our line of site the absorption lines shift in a predictable way. Every spectral line changes it's wavelength by an amount that is proportional to the radial velocity of the star. (Note: we only measure the radial velocity - i.e., the velocity of the star towards us or away from us. This is one dimension even if the velocity of the star has three dimensions.)
- Surface gravity: high gravity increases the density of atoms in the star and results in more collisions that broaden parts of the absorption lines.
- Rotation speed: as the star spins faster, the absorption lines get broader.
Beyond the visible wavelength range
Our human eyes and brains only perceive optical wavelengths of light. But, we can build instruments with detectors that obtain spectra of stars, planets and the universe in wavelengths beyond the visible band: the infrared, millimeter and radio wavelengths. Lower energy photons (infrared to radio wavelengths) induce molecular bonds to vibrate or rotate. Like atomic absorption of optical photons, vibrational and rotational energies are quantized. However, these spectra can be complex because many modes of vibration and rotation exist and can couple to other oscillations in the molecule.
The bonds in molecules are weaker than the binding energy of electrons in atoms. Therefore, molecules dissociate in the photospheres of stars like the Sun but can be detected in cooler stars like M dwarfs. Molecules are also ubiquitous in planetary atmospheres. Symmetric molecules (O2, H2, N2) tend to be spectroscopically inactive in the infrared - they do not have the capacity to absorb infrared photons. But low energy photons can resonate with the bonds of asymmetric molecules (CO2, H2O, CO), soaking up infrared light.

The figure above shows a synthetic spectrum created for a NASA study of future missions to detect Earth-like planets. This simulation is for a relatively low-resolution instrument, so the molecular features appear to be broad and deep. The absorption by symmetrical oxygen atoms can be detected at visible wavelengths, but low energy infrared light excites the vibrational and rotational bonds in asymmetric molecules.

