
16.1: Population Change
- Page ID
- 3461
Objectives
- Explain the factors that affect the size and structure of populations and how sociologists measure these factors.
- Explain how sociologists explain population change and describe the programs
- that have been instituted to control population growth.
Universal Generalizations
- Changes in population have been dramatic and significantly changed the face of the world in a short amount of time.
- Population growth has affected the social world and the nature of human interaction.
Guiding Questions
- What factors contribute to the growth or decline of a region?
- Why do demographers study world population change?
- Why are some countries populations falling?
- What are some proposed theories used to explain population change?
- Why are some countries using the strategy of family planning?
Population Change

We have commented that population change is an important source of other changes in society. The study of population is so significant that it occupies a special subfield within sociology called demography. To be more precise, demography is the study of changes in the size and composition of population. It encompasses several concepts: fertility and birth rates, mortality and death rates, and migration (Weeks, 2012).Weeks, J. R. (2012). Population: An introduction to concepts and issues (11th ed.). Belmont, CA: Wadsworth. Let’s look at each of these briefly.
We recently hit a population milestone of seven billion humans on the earth’s surface. The rapidity with which this happened demonstrated an exponential increase from the time it took to grow from five billion to six billion people. In short, the planet is filling up. How quickly will we go from seven billion to eight billion? How will that population be distributed? Where is population the highest? Where is it slowing down? Where will people live? To explore these questions, we turn to demography, or the study of populations. Three of the most important components affecting the issues above are fertility, mortality, and migration.
Fertility and Birth Rates
Fertility refers to the number of live births. Demographers use several measures of fertility. One measure is the crude birth rate, or the number of live births for every 1,000 people in a population in a given year. To determine the crude birth rate, the number of live births in a year is divided by the population size, and this result is then multiplied by 1,000. For example, in 2009 the United States had a population of about 307 million and roughly 4,136,000 births. Dividing the latter figure by the former figure gives us 0.0135 rounded off. We then multiply this quotient by 1,000 to yield a crude birth rate of 13.5 births per 1,000 population (U.S. Census Bureau, 2010).U.S. Census Bureau. (2010).Statistical abstract of the United States: 2010. Washington, DC: U.S. Government Printing Office.
Retrieved from www.census.gov/compendia/statab. We call this a “crude” birth rate because the denominator, population size, consists of the total population, not just the number of women or even the number of women of childbearing age (commonly considered 15–44 years).
A second measure is the general fertility rate (also just called the fertility rate or birth rate), or the number of live births per 1,000 women aged 15–44 (i.e., of childbearing age). This is calculated in a manner similar to that for the crude fertility rate, but in this case the number of births is divided by the number of women aged 15–44 before multiplying by 1,000. The U.S. general fertility rate for 2009 was about 65.5 (i.e., 65.5 births per 1,000 women aged 15–44; Tejada-Vera & Sutton, 2010). Tejada-Vera, B., & Sutton, P. D. (2010). Births, marriages, divorces, and deaths: Provisional data for 2009. National vital statistics reports, 58 (25), 1–6.
A third measure is the total fertility rate, or the number of children an average woman is expected to have in her lifetime. This measure often appears in the news media and is more easily understood by the public than either of the first two measures. In 2008, the U.S. total fertility rate was about 2.09. Sometimes the total fertility rate is expressed as the average number of births that an average group of 1,000 women would be expected to have. In this case, the average number of children that one woman is expected to have is simply multiplied by 1,000. Using this latter calculation, the U.S. total fertility rate in 2008 was about 2,090 (i.e., an average group of 1,000 women would be expected to have, in their lifetimes, 2,090 children; Hamilton, Martin, & Ventura, 2010).Hamilton, B. E., Martin, J. A., & Ventura, S. J. (2010). Births: Preliminary data for 2008. National vital statistics reports, 58(16), 1–18.
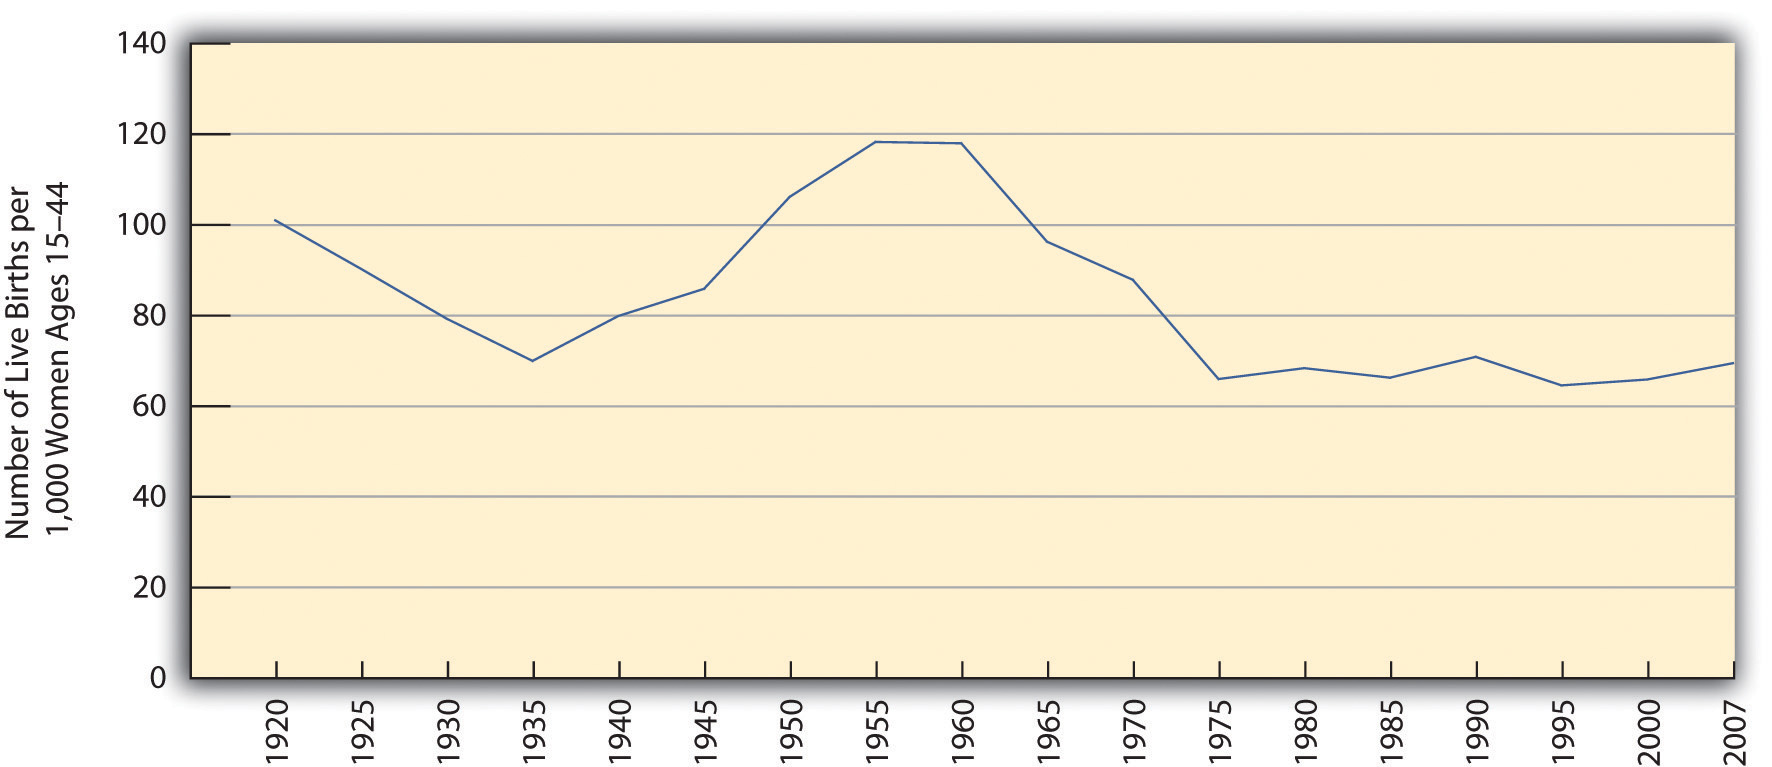
As Figure 16.1.2 "U.S. General Fertility Rate, 1920–2007" indicates, the U.S. general fertility rate has changed a lot since 1920, dropping from 101 (per 1,000 women aged 15–44) in 1920 to 70 in 1935, during the Great Depression, before rising afterward until 1955. (Note the very sharp increase from 1945 to 1955, as the post–World War II baby boom began.) The fertility rate then fell steadily after 1960 until the 1970s but has remained rather steady since then, fluctuating only slightly between 65 and 70 per 1,000 women aged 15–44.

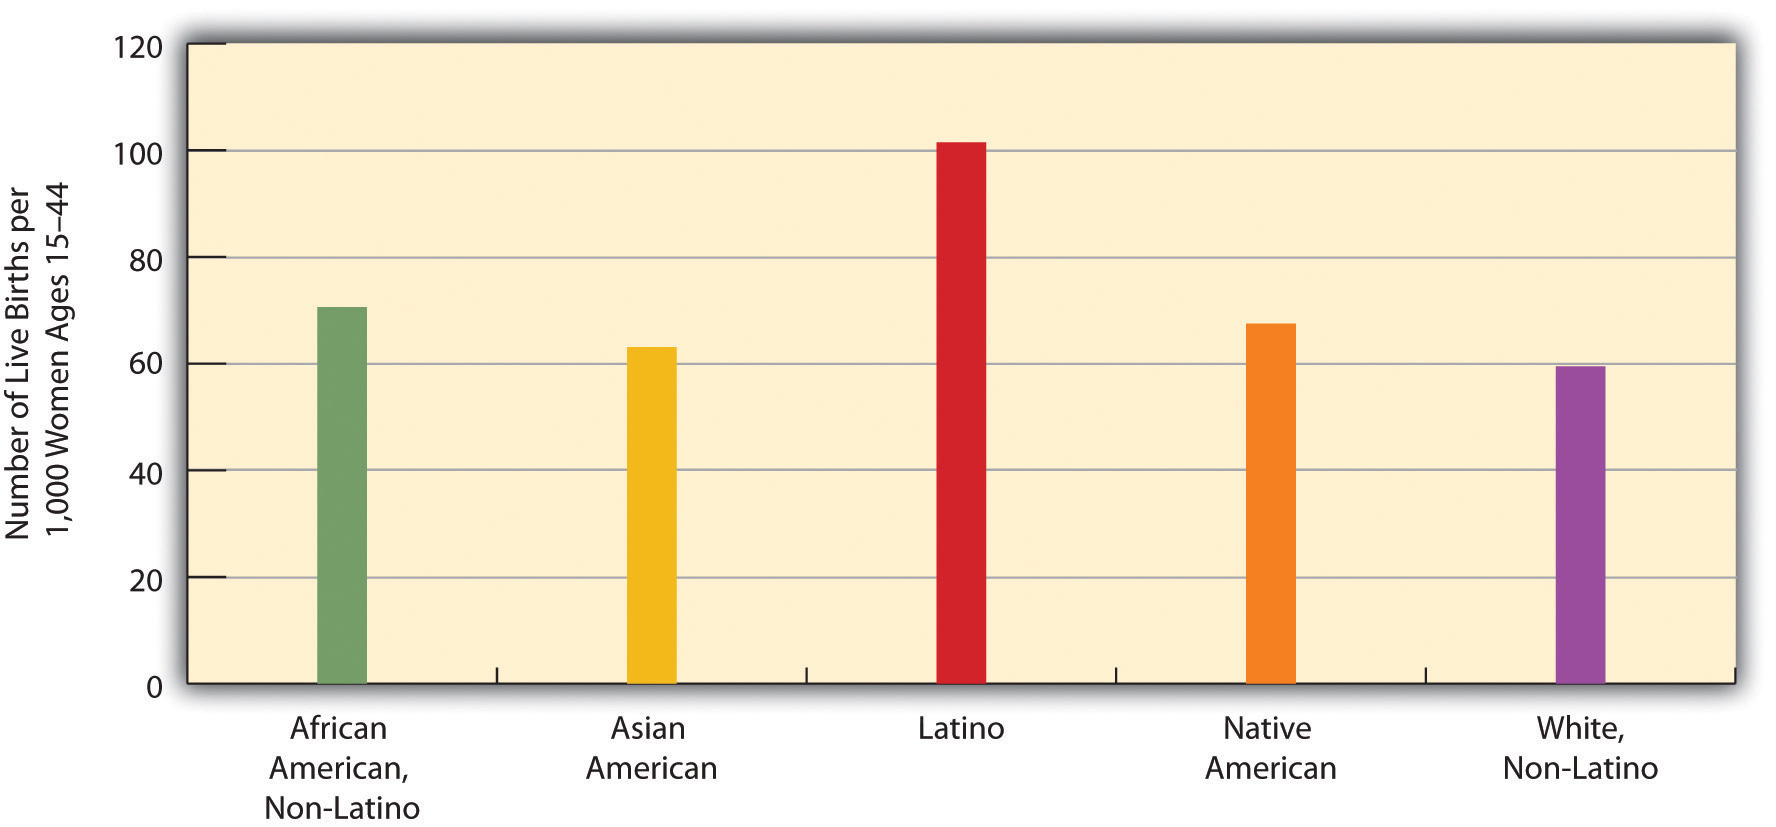
The fertility rate varies by race and ethnicity. As Figure 16.1.4 "Race, Ethnicity, and U.S. Fertility Rates, 2006" shows, it is lowest for non-Latina white women and the highest for Latina women. Along with immigration, the high fertility rate of Latina women has fueled the large growth of the Latino population. Latinos now account for about 16% of the U.S. population, and their proportion is expected to reach more than 30% by 2050 (U.S. Census Bureau, 2010).U.S. Census Bureau. (2010). Statistical abstract of the United States: 2010. Washington, DC: U.S. Government Printing Office. Retrieved from www.census.gov/compendia/statab
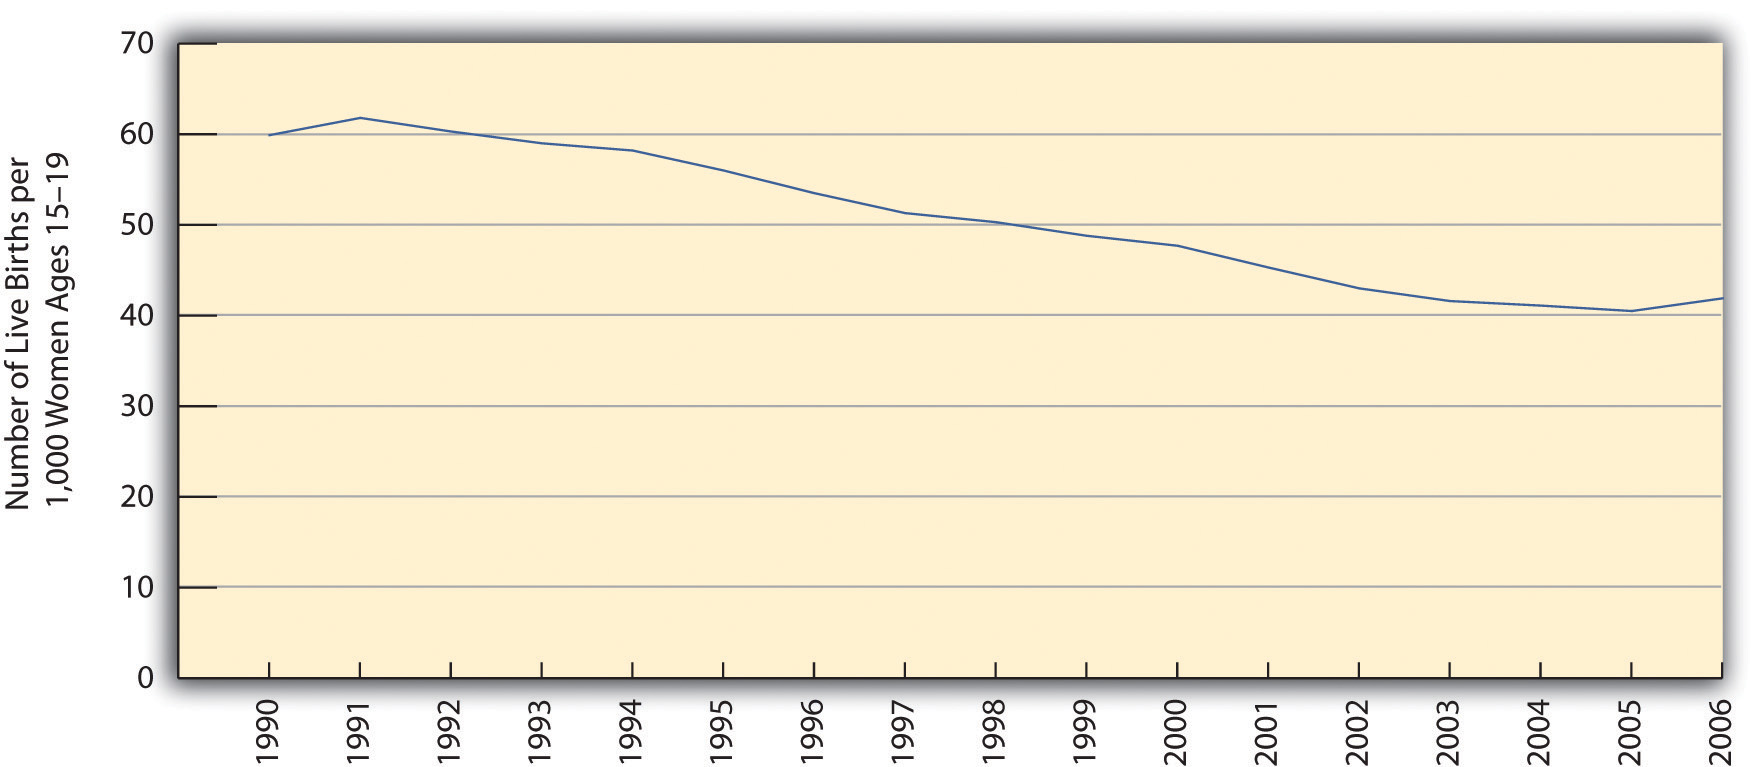
The fertility rate of teenagers is a special concern because of their age. Although it is still a rate that most people wish were lower, it dropped steadily through the 1990s, before leveling off after 2002 and rising slightly afterward (see Figure 16.1.5 "U.S. Teenage Fertility Rate, 1990–2006"). Although most experts attribute this drop to public education campaigns and increased contraception, the United States still has the highest rate of teenage pregnancy and fertility of any industrial nation (Eckholm, 2009).Eckholm, E. (2009, March
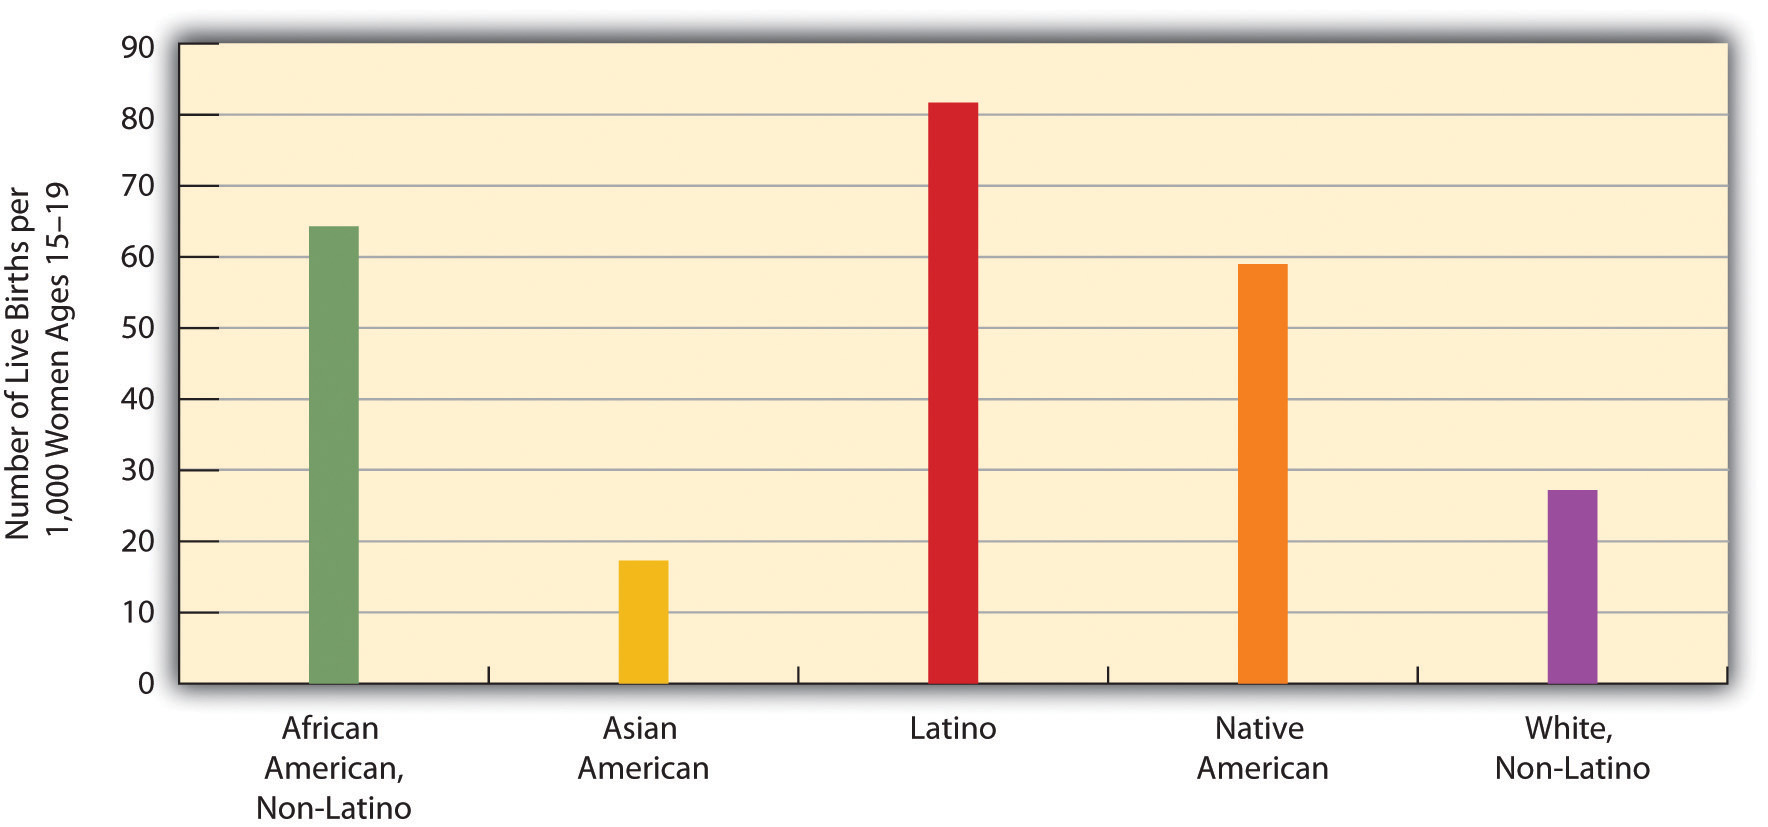
18). ’07 U.S. births break baby boom record. The New York Times, p. A14. Teenage fertility again varies by race and ethnicity, with Latina teenagers having the highest fertility rates and Asian American teenagers the lowest (see Figure 16.1.6 "Race, Ethnicity, and U.S. Teenage Fertility Rates, 2007").
Fertility rates also differ around the world and are especially high in poor nations (see Figure 16.1.7 "Crude Birth Rates Around the World, 2008 (Number of Births per 1,000 Population)"). Demographers identify several reasons for these high rates (Weeks, 2012).Weeks, J. R. (2012).Population: An introduction to concepts and issues (11th ed.). Belmont, CA: Wadsworth.
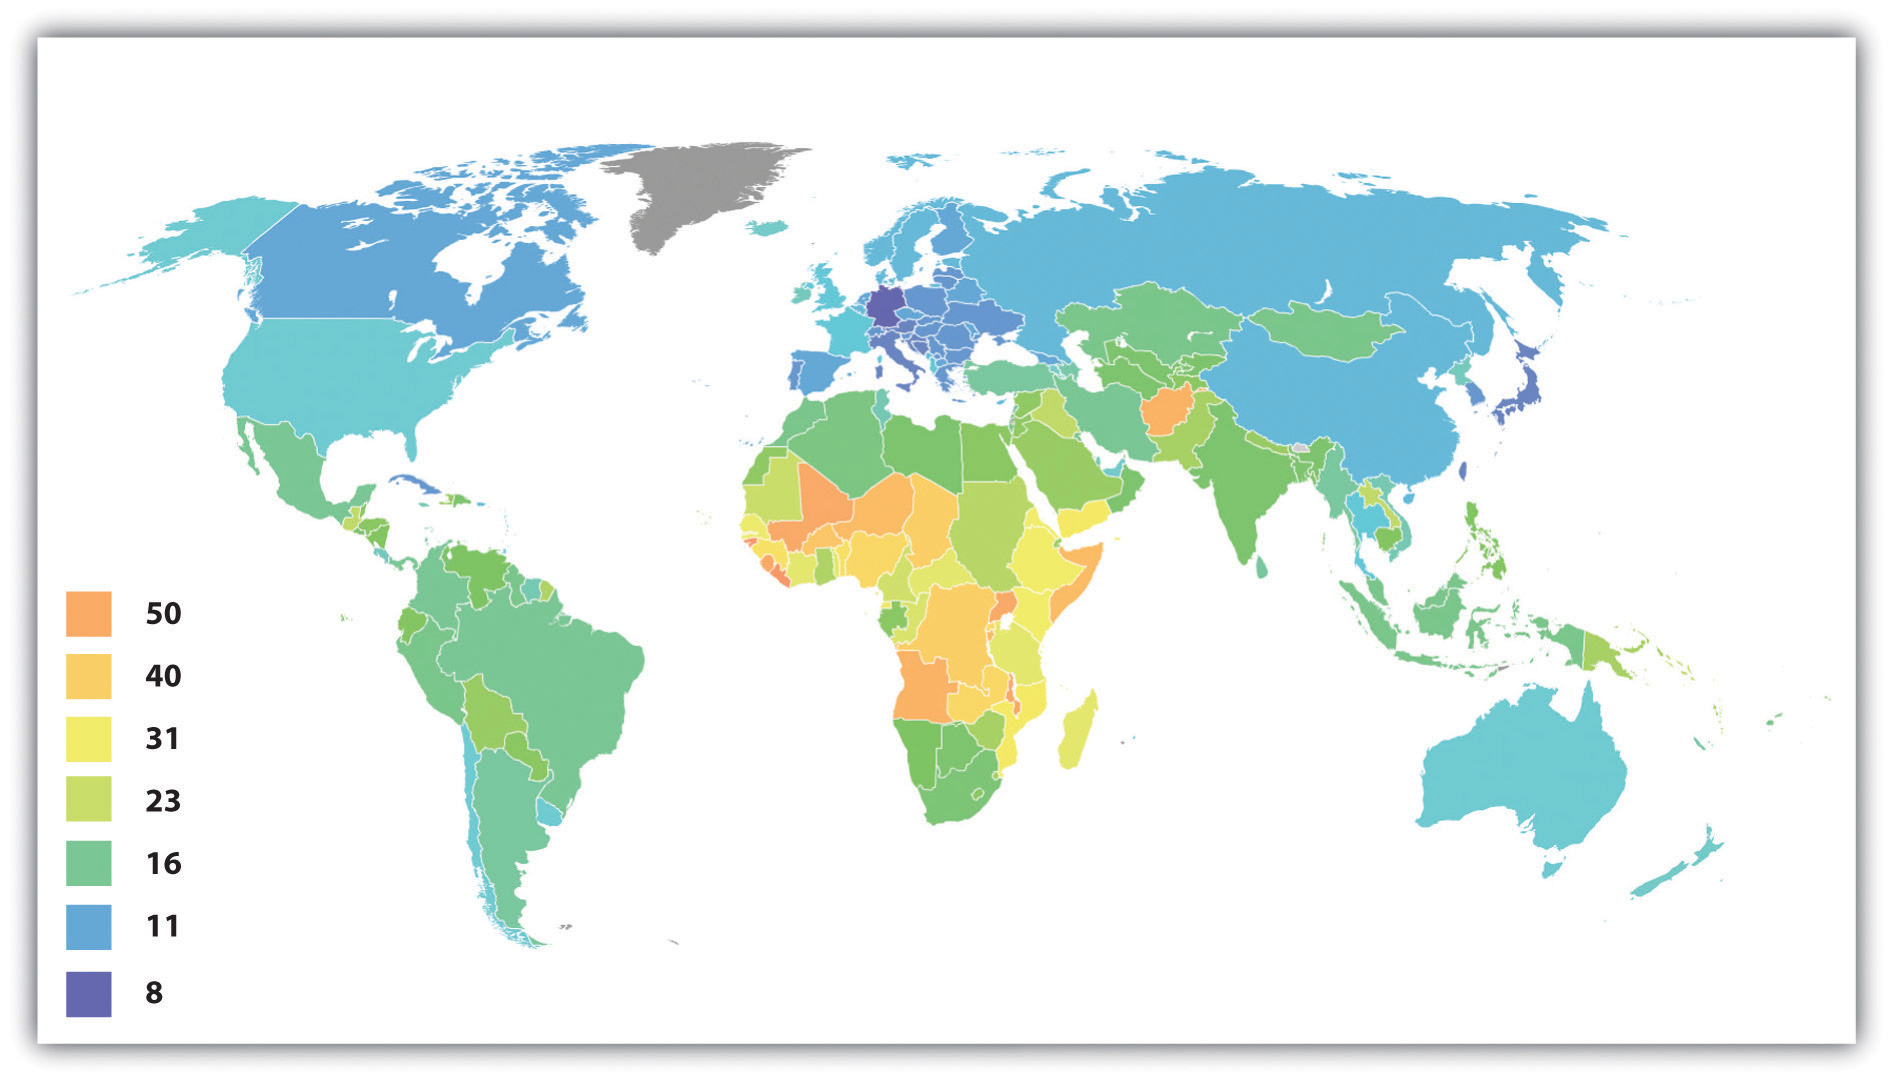
First, poor nations are usually agricultural ones. In agricultural societies, children are an important economic resource, as a family will be more productive if it has more children. This means that families will ordinarily try to have as many children as possible. Second, infant and child mortality rates are high in these nations. Because parents realize that one or more of their children may die before adulthood, they have more children to “make up” for the anticipated deaths. A third reason is that many parents in low-income nations prefer sons to daughters, and, if a daughter is born, they “try again” for a son. Fourth, traditional gender roles are often very strong in poor nations, and these roles include the belief that women should be wives and mothers above all. With this ideology in place, it is not surprising that women will have several children. Finally, contraception is uncommon in poor nations. Without contraception, many more pregnancies and births certainly occur. For all of these reasons, then, fertility is much higher in poor nations than in rich nations.
Population Growth
Changing fertility, mortality, and migration rates make up the total population composition, a snapshot of the demographic profile of a population. This number can be measured for societies, nations, world regions, or other groups. The population composition includes the sex ratio (the number of men for every hundred women) as well as the population pyramid (a picture of population distribution by sex and age).

| Country | Population (in millions) | Fertility Rate | Mortality Rate | Sex Ratio Male to Female |
|---|---|---|---|---|
| Afghanistan | 29.8 | 5.4% | 17.4% | 1.05 |
| Sweden | 9.1 | 1.7% | 10.2% | 0.98 |
| United States of America | 313.2 | 2.1% | 8.4% | 0.97 |
Comparing these three countries reveals that there are more men than women in Afghanistan, whereas the reverse is true in Sweden and the United States. Afghanistan also has significantly higher fertility and mortality rates than either of the other two countries. Do these statistics surprise you? How do you think the population makeup impacts the political climate and economics of the different countries?
Mortality and Death Rates
Mortality is the flip side of fertility and refers to the number of deaths. Demographers measure it with the crude death rate, the number of deaths for every 1,000 people in a population in a given year. To determine the crude death rate, the number of deaths is divided by the population size, and this result is then multiplied by 1,000. In 2006 the United States had slightly more than 2.4 million deaths for a crude death rate of 8.1 deaths for every 1,000 persons. We call this a “crude” death rate because the denominator, population size, consists of the total population and does not take its age distribution into account. All things equal, a society with a higher proportion of older people should have a higher crude death rate. Demographers often calculate age-adjusted death rates that adjust for a population’s age distribution. When analyzed together, fertility and mortality rates help researchers understand the overall growth occurring in a population.
Migration
Another demographic concept is migration, the movement of people into and out of specific regions. Since the dawn of human history, people have migrated in search of a better life, and many have been forced to migrate by ethnic conflict or the slave trade.
Several classifications of migration exist. When people move into a region, we call it in-migration, or immigration; when they move out of a region, we call it out-migration, or emigration. The in-migration rate is the number of people moving into a region for every 1,000 people in the region, while the out-migration rate is the number of people moving from the region for every 1,000 people. The difference between the two is the net migration rate (in-migration minus out-migration). Recalling the news story about Michigan that began this chapter, Michigan has had a net migration of less than zero, as its out-migration has been greater than its in-migration.
Migration can also be either domestic or international in scope. Domestic migration happens within a country’s national borders, as when retired people from the northeastern United States move to Florida or the Southwest. International migration happens across national borders. When international immigration is heavy, as it has been into the United States and Western Europe in the last few decades, the effect on population growth and other aspects of national life can be significant. Domestic migration can also have a large impact. The great migration of African Americans from the South into northern cities during the first half of the 20th century changed many aspects of those cities’ lives (Berlin, 2010).Berlin, I. (2010). The making of African America: The four great migrations. New York, NY: Viking. Meanwhile, the movement during the past few decades of northerners into the South and Southwest also had quite an impact: the housing market initially exploded, for example, and traffic increased.
Explaining Population Growth
Demographers use their knowledge of fertility, mortality, and migration trends to make projections about population growth and decline several decades into the future. Coupled with our knowledge of past population sizes, these projections allow us to understand population trends over many generations. One clear pattern emerges from the study of population growth. When a society is small, population growth is slow because there are relatively few adults to procreate. But as the number of people grows over time, so does the number of adults. More and more procreation thus occurs every single generation, and population growth then soars in a virtual explosion.
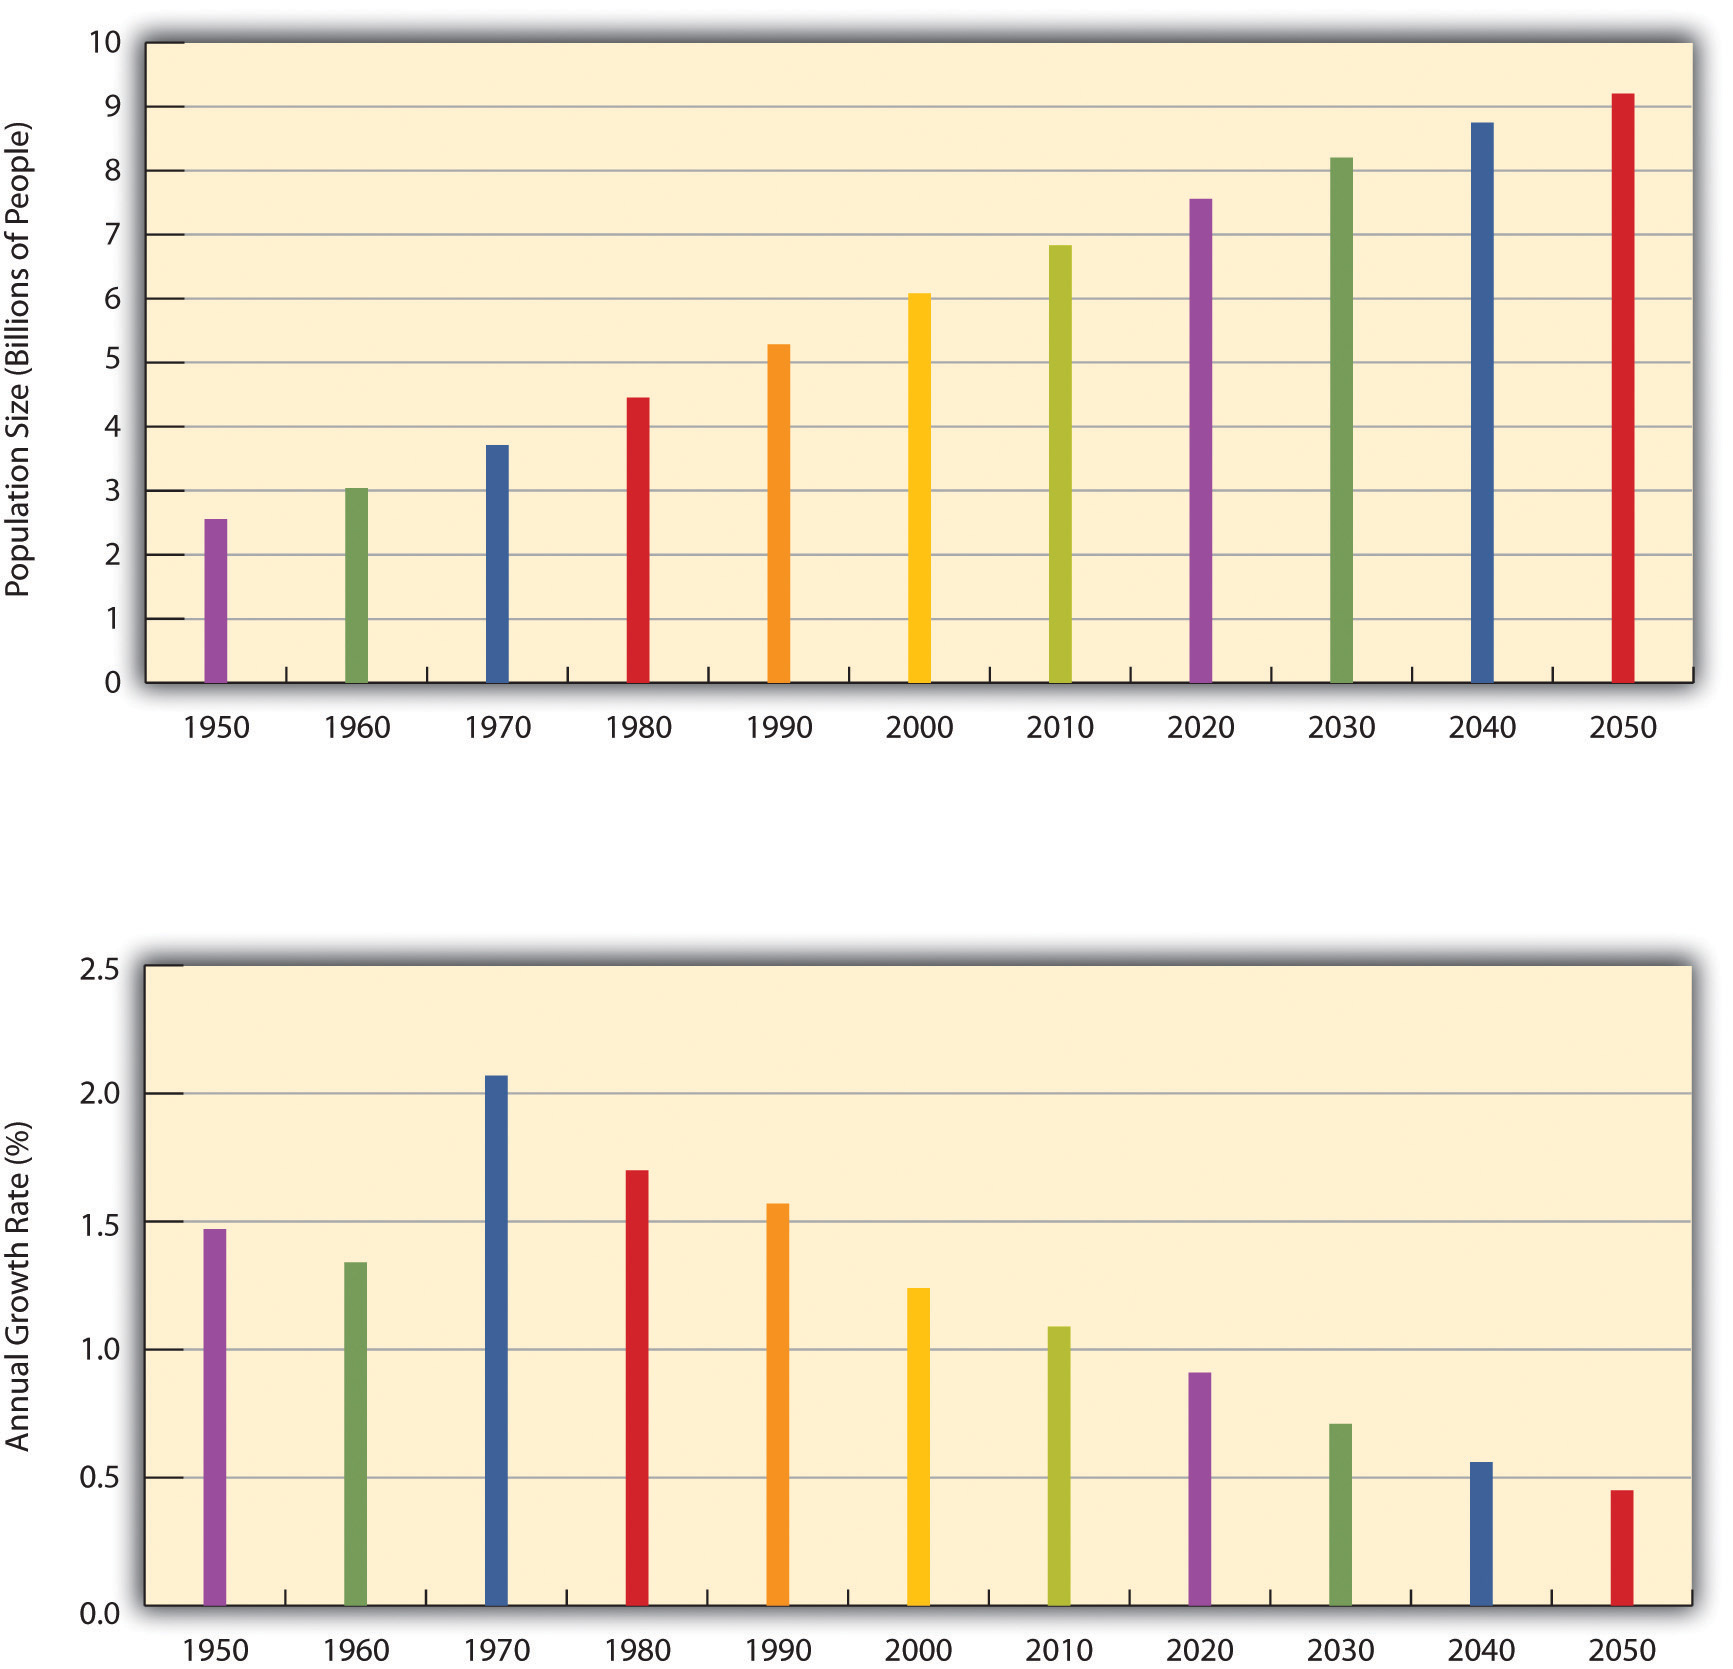
We saw evidence of this pattern when we looked at world population growth. When agricultural societies developed some 12,000 years ago, only about 8 million people occupied the planet. This number had reached about 300 million about 2,100 years ago, and by the 15th century it was still only about 500 million. It finally reached 1 billion by about 1850 and by 1950, only a century later, had doubled to 2 billion. Just 50 years later, it tripled to more than 6.8 billion, and it is projected to reach more than 9 billion by 2050 (U.S. Census Bureau, 2010)U.S. Census Bureau. (2010). Statistical abstract of the United States: 2010. Washington, DC: U.S. Government Printing Office. Retrieved from www.census.gov/compendia/statab (see Figure "Total World Population, 1950–2050").
Malthusian Theory
Thomas Malthus (1766–1834) was an English clergyman who made dire predictions about earth’s ability to sustain its growing population. According to Malthusian theory, three factors would control human population that exceeded the earth’s carrying capacity, or how many people can live in a given area considering the amount of available resources. He identified these factors as war, famine, and disease (Malthus 1798). He termed these “positive checks” because they increased mortality rates, thus keeping the population in check, so to speak. These are countered by “preventative checks,” which also seek to control the population, but by reducing fertility rates; preventive checks include birth control and celibacy. Thinking practically, Malthus saw that people could only produce so much food in a given year, yet the population was increasing at an exponential rate. Eventually, he thought people would run out of food and begin to starve. They would go to war over the increasingly scarce resources, reduce the population to a manageable level, and the cycle would begin anew.
Of course, this has not exactly happened. The human population has continued to grow long past Malthus’s predictions. So what happened? Why didn’t we die off? There are three reasons that sociologists suggest we continue to expand the population of our planet. First, technological increases in food production have increased both the amount and quality of calories we can produce per person. Second, human ingenuity has developed new medicine to curtail death through disease. Finally, the development and widespread use of contraception and other forms of family planning have decreased the speed at which our population increases. But what about the future? Some still believe that Malthus was correct and that ample resources to support the earth’s population will soon run out.

Zero Population Growth
A neo-Malthusian researcher named Paul Ehrlich brought Malthus’s predictions into the 20th century. However, according to Ehrlich, it is the environment, not specifically the food supply, that will play a crucial role in the continued health of planet’s population (Ehrlich 1968). His ideas suggest that the human population is moving rapidly toward complete environmental collapse, as privileged people use up or pollute a number of environmental resources, such as water and air. He advocated for a goal of zero population growth(ZPG), in which the number of people entering a population through birth or immigration is equal to the number of people leaving it via death or emigration. While support for this concept is mixed, it is still considered a possible solution to global overpopulation.
Demographic Transition Theory
Whether you believe that we are headed for environmental disaster and the end of human existence as we know it, or you think people will always adapt to changing circumstances, there are clear patterns that can be seen in population growth. Societies develop along a predictable continuum as they evolve from unindustrialized to postindustrial. Demographic transition theory(Caldwell and Caldwell 2006) suggests that future population growth will develop along a predictable four-stage model.
In Stage 1, birth, death, and infant mortality rates are all high, while life expectancy is short. An example of this stage is 1800s America. As countries begin to industrialize, they enter Stage 2, where birthrates are higher while infant mortality and the death rates drop. Life expectancy also increases. Afghanistan is currently in this stage. Stage 3 occurs once a society is thoroughly industrialized; birthrates decline, while life expectancy continues to increase. Death rates continue to decrease. Mexico’s population is at this stage. In the final phase, Stage 4, we see the postindustrial era of a society. Birth and death rates are low, people are healthier and live longer, and society enters a phase of population stability. Overall population may even decline. Sweden and the United States are considered Stage 4.
This theory links population growth to the level of technological development across three stages of social evolution. In the first stage, coinciding with preindustrial societies, the birth rate and death rate are both high. The birth rate is high because of the lack of contraception and the several other reasons cited earlier for high fertility rates, and the death rate is high because of disease, poor nutrition, lack of modern medicine, and other problems. These two high rates cancel each other out, and little population growth occurs.
In the second stage, coinciding with the development of industrial societies, the birth rate remains fairly high, owing to the lack of contraception and a continuing belief in the value of large families, but the death rate drops because of several factors, including increased food production, better sanitation, and improved medicine. Because the birth rate remains high but the death rate drops, population growth takes off dramatically.
In the third stage, the death rate remains low, but the birth rate finally drops as families begin to realize that large numbers of children in an industrial economy are more of a burden than an asset. Another reason for the drop is the availability of effective contraception. As a result, population growth slows, and, as we saw earlier, it has become quite low or even gone into a decline in several industrial nations.
Demographic transition theory, then, gives us more reason to be cautiously optimistic regarding the threat of overpopulation: as poor nations continue to modernize—much as industrial nations did 200 years ago—their population growth rates should start to decline. Still, population growth rates in poor nations continue to be high, and, as the “Sociology Making a Difference” box discussed, inequalities in food distribution allow rampant hunger to persist. Hundreds of thousands of women die in poor nations each year during pregnancy and childbirth. Reduced fertility would save their lives, in part because their bodies would be healthier if their pregnancies were spaced farther apart (Schultz, 2008).Schultz, T. P. (2008). Population policies, fertility, women’s human capital, and child quality. In T. P. Schultz & J. Strauss (Eds.), Handbook of development economics (Vol. 4, pp. 3249–3303). Amsterdam, Netherlands: North-Holland, Elsevier. Although world population growth is slowing, then, it is still growing too rapidly in much of the developing and least developed worlds. To reduce it further, more extensive family-planning programs are needed, as is economic development in general.
Population Decline and Pronatalism
Still another reason for the reduced concern over population growth is that birth rates in many industrial nations have slowed considerably. Some nations are even experiencing population declines, while several more are projected to have population declines by 2050 (Goldstein, Sobotka, & Jasilioniene, 2009).Goldstein, J. R., Sobotka, T., & Jasilioniene, A. (2009). The end of “lowest-low” fertility? Population & Development Review, 35(4), 663–699. doi:10.1111/j.1728–4457.2009.00304.xFor a country to maintain its population, the average woman needs to have 2.1 children, the replacement level for population stability. But several industrial nations, not including the United States, are far below this level. Increased birth control is one reason for their lower fertility rates but so are decisions by women to stay in school longer, to go to work right after their schooling ends, and to not have their first child until somewhat later.
Ironically, these nations’ population declines have begun to concern demographers and policymakers (Shorto, 2008). Shorto, R. (2008, June 2). No babies? The New York Times Magazine. Retrieved from http://www.nytimes.com/2008/06/29/magazine/29Birth-t.html?scp=1&sq=&st=nyt Because people in many industrial nations are living longer while the birth rate drops, these nations are increasingly having a greater proportion of older people and a smaller proportion of younger people. In several European nations, there are more people 61 or older than 19 or younger. As this trend continues, it will become increasingly difficult to take care of the health and income needs of so many older persons, and there may be too few younger people to fill the many jobs and provide the many services that an industrial society demands. The smaller labor force may also mean that governments will have fewer income tax dollars to provide these services.

To deal with these problems, several governments have initiatedpronatalist policies aimed at encouraging women to have more children. In particular, they provide generous child-care subsidies, tax incentives, and flexible work schedules designed to make it easier to bear and raise children, and some even provide couples outright cash payments when they have an additional child. Russia in some cases provides the equivalent of about $9,000 for each child beyond the first, while Spain provides 2,500 euros (equivalent to about $3,400) for each child (Haub, 2009).Haub, C. (2009). Birth rates rising in some low birth-rate countries. Washington, DC: Population Reference Bureau. Retrieved from www.prb.org/Articles/2009/fallingbirthrates.aspx
Current Population Trends
The earth’s population is seven billion. That number might not seem particularly jarring on its own; after all, we all know there are lots of people around. But consider the fact that human population grew very slowly for most of our existence, then doubled in the span of half a century to reach six billion in 1999. And now, just over ten years later, we have added another billion. A look at the graph of projected population indicates that growth is not only going to continue, but it will continue at a rapid rate.
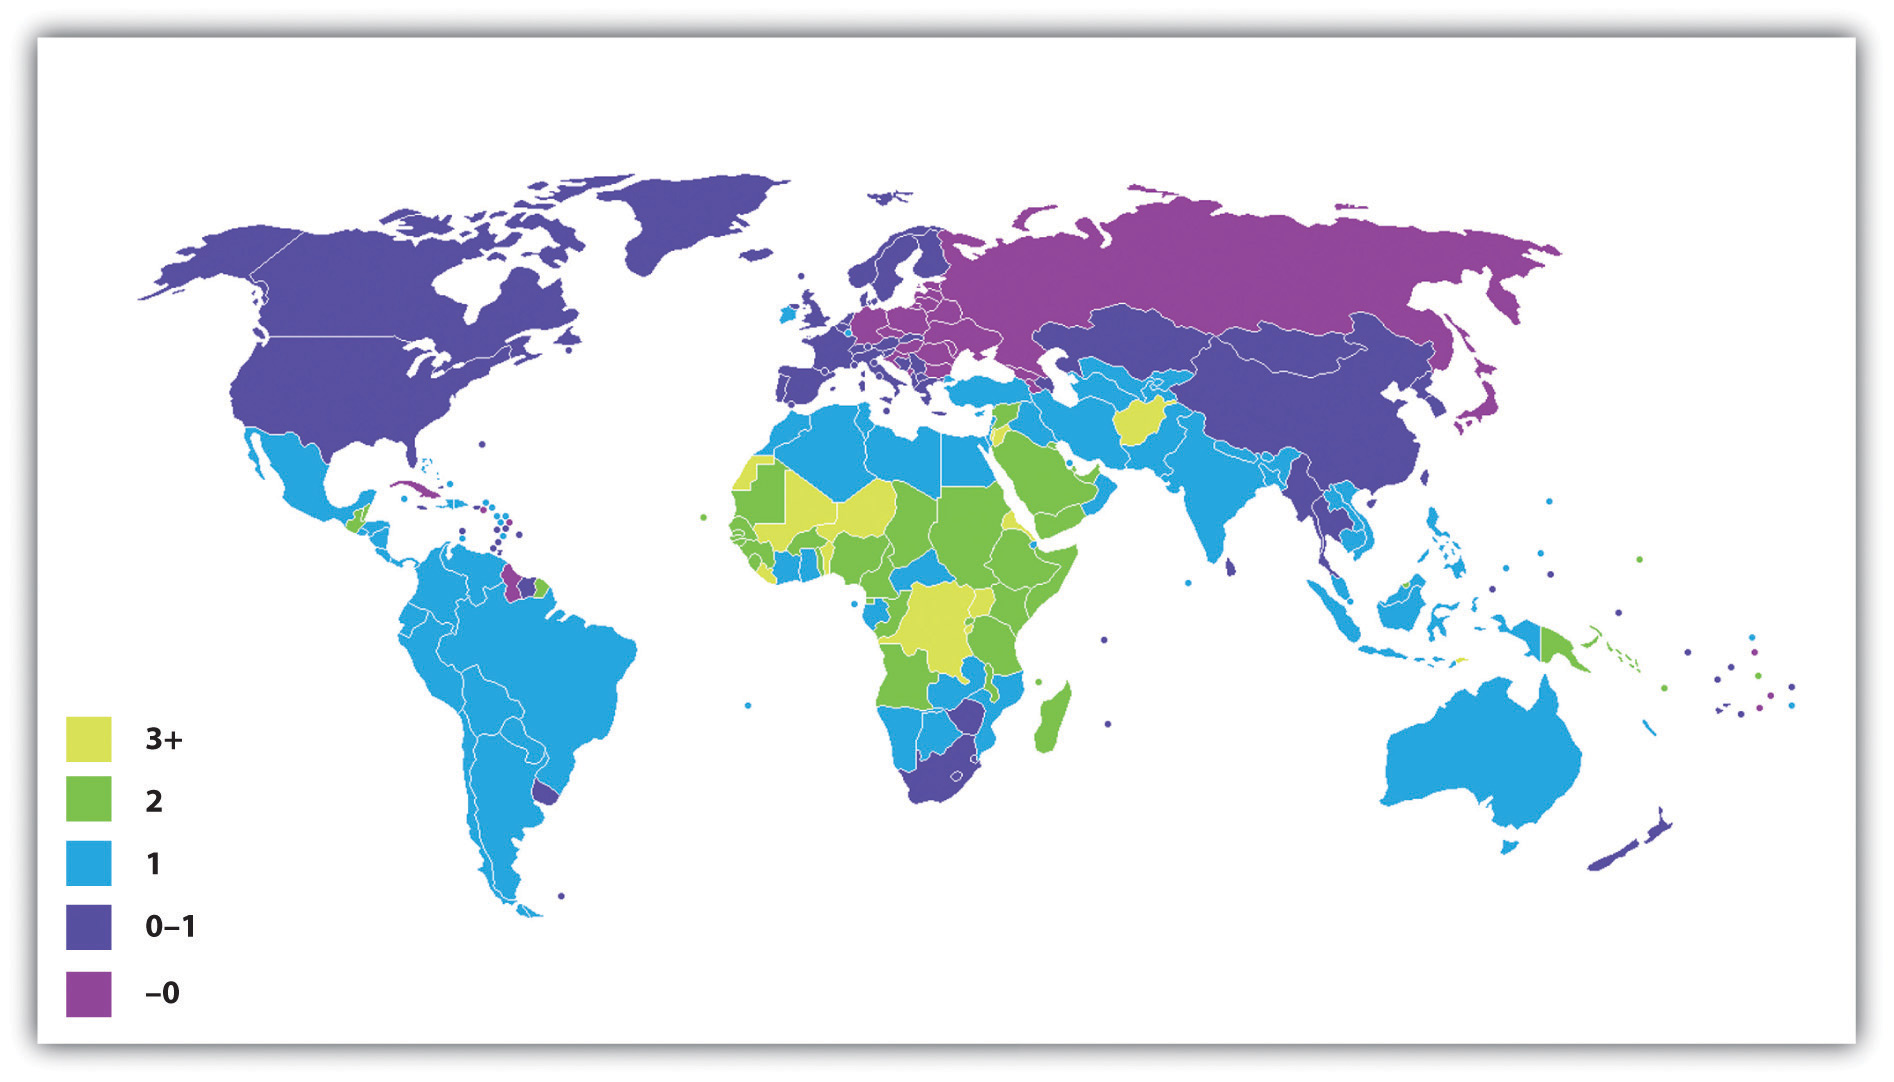
The United Nations Population Fund (2008) categorizes nations as high fertility, intermediate fertility, or low fertility. They anticipate the population growth to triple between 2011 and 2100 in high-fertility countries, which are currently concentrated in sub-Saharan Africa. For countries with intermediate fertility rates (the U.S., India, and Mexico all fall into this category), growth is expected to be about 26 percent. And low-fertility countries like China, Australia, and most of Europe will actually see population declines of approximately 20 percent. The graphs below illustrate this trend.


It would be impossible to discuss population growth and trends without addressing access to family planning resources and birth control. As the stages of population growth indicate, more industrialized countries see birthrates decline as families limit the number of children they have. Today, many people—over 200 million—still lack access to safe family planning, according to USAID (2010). By their report, this need is growing, with demand projected to increase by 40 percent in the next 15 years. Many social scholars would assert that until women are able to have only the children they want and can care for, the poorest countries will always bear the worst burden of overpopulation.