How do you write a math problem to represent a physical object?
The video below, and the first portion of the lesson thereafter, both describe different challenges involving modeling a box created by cutting corners out of a flat sheet of cardboard and then folding up the sides. In the video, the specific problem is to identify the size of the cardboard needed to result in a given volume. In the lesson, the challenge is to identify the greatest volume possible from a given size sheet of cardboard.
How would you mathematically model a divider to split the volume of the box described in the lesson into multiple spaces?
Cubic Models
Cubic functions and piece-wise functions can be used to model real-world situations, allowing you to identify missing bits of information you may need to complete a project. Cubic functions are commonly used to model three-dimensional objects to allow you to identify a missing dimension or explore the result of changes to one or more dimensions.
Piece-wise functions may be used to model the interactions of multiple items each previously modeled by a simpler function.
Examples
Example 1
Solution
Earlier, you were asked to create a different model describing the cardboard box.
There are a number of different possibilities, for instance:
In the case of the box in the video above: \(\ t(v)=v / h\) could be used to describe the area of the top of the box as a function of the volume.
In the case of the box in the lesson text: d(x)=(12−x)x or d(x)=(8−x)x could be used to find the area of a divider run the long way or the wide way across the box as a function of the length of one side of the square corner cut-outs.
Example 2
Consider a situation in which a rectangular piece of cardboard is folded into a box. The folding is made possible by cutting squares out of the four corners of the cardboard.
Calculate the maximum volume possible of a box made from a sheet of cardboard 12" x 8".
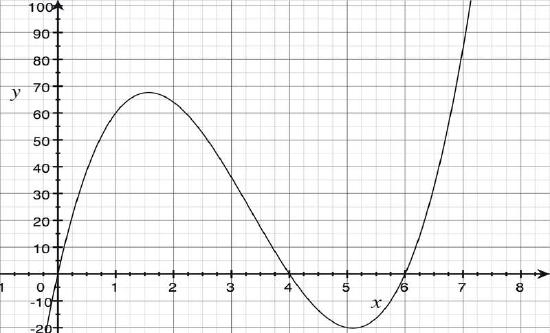
The function \(\ v(x)=(12-2 x)(8-2 x) x\) could be used to represent the volume of the box as a function of x, the side-length of the squares cut out of the corners. If we multiply out the factors of this function we can verify that this is a cubic function:
This function could be used to find the maximum possible volume of the box. We can also analyze the graph to understand how the volume changes as a function of x.
When analyzing the function to determine the maximum volume of the box, we only look at the portion of the graph that looks “parabolic”. This is because the function ceases to model the situation if x is more than 4. If we cut out {4x4} squares, we would cut out the entire short side of the cardboard rectangle, and we would not be able to make a box. Focusing then on the interval (0, 4) we can see that the volume of the box increases, and then decreases.
If we are using a graphing calculator and want to know the volume of a box with particular dimensions, we can trace on the graph, input values into the table, or take advantage of the graph being in trace mode. That is, if you press GRAPH to view the graph, and then press TRACE, you can input x values. For example, say that you wanted to cut out squares of side-length 2.5. Press TRACE, then press 2.5, then press ENTER. At the bottom of the screen you will see x = 2.5 and y = 52.5. This tells you that the volume of the box will be 52.5in3.
Example 3
Using the information given in Example 2 above, calculate the size of the square corners to cut out to result specifically in a volume of 50 in3.
Solution
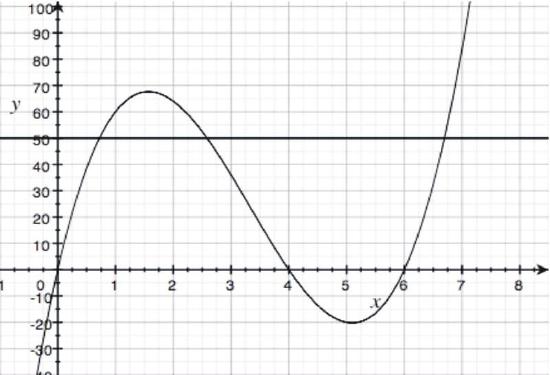
One way to determine the value of x is to graph the constant function y = 50, and find the point where the volume function intersects y = 50. Press Y= and enter 50 into Y2. Now press GRAPH. You should see the horizontal line y = 50 intersecting the volume function in several places. We are interested in the two intersection points in the interval (0, 4).
To find a good approximation of an intersection point, trace close to one of the two points. If you trace close to the first point, you will see that it is around x = 0.8. Now press 2nd, CALC, and choose option 5, INTERSECT. The calculator will send you back to the graph screen, and ask you to choose the first curve. (The calculator does this in case you have more than two functions graphed at the same time.) You should see the cubic equation at the top of the screen. Press ENTER, and the calculator will ask you for the second curve. You should see y = 50 at the top of the screen. Press ENTER, and then enter a guess. (If you have already traced close to an intersection point, and you only have two functions graphed, you can simply press ENTER three times.) You should now see the coordinates of the intersection point at the bottom of the screen: x is approximately 0.723. (You can use the same process to estimate the other intersection point.)
A cubic function can be used to model situations that involve volume, but can also be used to model situations that follow particular growth patterns.
Example 4
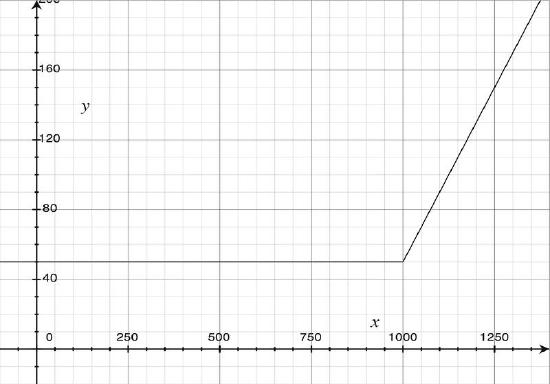
Piece-wise functions can be used to describe situations in which quantitative relationships are different in different intervals within the domain of the function. For example, consider a situation in which a wireless provider offers customers a monthly plan that costs $50, but then charges $0.40 cents per minute for every minute over 1000 included daytime minutes.
Solution
Model the monthly cost, C, of the plan as a function of m, the number of daytime minutes you use:
This function is comprised of a constant function, and a linear function with slope 0.40. If in a given month you use 1000 minutes or fewer, your monthly cost is a constant $50. If you use more than 1000, each additional minute influences the value of C. For example, if you use 1,020 minutes, your cost is:
C(1020) = 50 + 0.40(1020 - 1000)
= 50 + 0.4(20)
= 50 + 8
= $58.00
It is important to note that in this kind of situation, the time used may to be rounded to the nearest minute. So, for example, if you use 20.5 minutes, you will be charged for 21 minutes. This is an example of a non-continuous, or discontinuous, function, where there are definite steps from value to value rather than a smooth line connecting all possible values.
Example 5
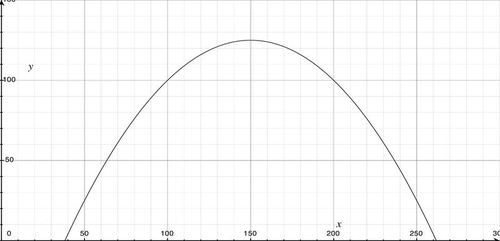
The profits for a business can be determined by subtracting the costs from the revenue. Suppose the revenue of a business is modeled by the function R(x)=5x−0.01x2, and the costs of manufacturing the product is modeled by C(x)=100+2x, where x is the number of units of the product.
Write a function P(x) to model the company’s profits.
Graph P(x) and determine the maximum profit.
Solution
P(x) = R(x) - C(x) = -0.01x2 + 3x - 100
[Figure1]
The maximum profit is 125 (usually in thousands, or another larger unit!)
Example 6
Express the following situation as a composition of functions: You are running a small business making wooden jewelry boxes. It costs you $5.00 per unit to produce wooden boxes, plus an initial investment of $300 in other materials. It then costs you an additional $2.00 per box to decorate the boxes.
A box is to be made by cutting squares out of the corners of a rectangular piece of cardboard. The dimensions of the cardboard are n inches by m inches. Assume that n > m. a. Write a model for the volume of the box. b. What is the largest square that can be cut out of the corners of the cardboard?
Suppose you were told that you could use a single sheet of paper for notes on your math final. The instructor says that you may use any sheet you like, but the shape must be a quadrangle and the perimeter may not exceed 45in. a) What dimensions should you use to provide the greatest area for your notes? b) How does a graphing calculator help to simplify this question?
Is \(\ f(x)=-3^{4 x}\) a power function?
Is \(\ f(x)=\sqrt[3]{8 x^{5}}\) a power function?
Is \(\ g(x)=7 \cdot 2^{x}\) a power function? If not, why not?
Is \(\ h(x)=2 x^{-5}\) a power function? If not, why not?
The volume v of a sphere varies directly as the cube of the radius r. When the radius of a sphere is 6 cm, the volume is 904.779cm3. What is the radius of a sphere whose volume is 268.083cm3?
The force of gravity (F) acting on an object is inversely proportional to the square of the distance d from the object to the center of the earth. Write an equation that models this situation.
Sue and Betty gathered the data in the table below using a 100-watt light bulb and a Calculator-Based Laboratory(CBL) with a light-intensity probe.
Light Intensity Data for a 100w light bulb
Distance (m)
Intensity (W/m2)
1.0
7.95
1.5
3.53
2.0
2.01
2.5
1.27
3.0
0.90
Use your calculator to find the power regression model of the data.
Describe the relationship between the intensity and distance modeled with the equation in Q #9
Use the regression model from Q #9 to predict the intensity of an object 2.75 meters away.
Number of births to females in the US under 15 years of age for years 1990 - 2005
Year
CPI Annual Change %
Year
CPI Annual Change %
Year
CPI Annual Change %
1990
5.4
1996
3.0
2002
1.6
1991
4.2
1997
2.3
2003
2.3
1992
3.0
1998
1.6
2004
2.7
1993
3.0
1999
2.2
2005
3.4
1994
2.6
2000
3.4
1995
2.8
2001
2.8
Find the cubic function that models the data, where (y) is the number of thousands of births and (x) is the number of years from 1970.
Use the function to estimate the number of such births that occured in 2005.
When do we know this model is no longer valid?
Review (Answers)
To see the Review answers, open this PDF file and look for section 1.18.
Vocabulary
Term
Definition
Cubic model
A cubic model is a mathematical function including an x3 term, used to describe a real-world situation, such as the volume of a three-dimensional object.
Model
A model is a mathematical expression or function used to describe a physical item or situation.
piecewise functions
A piecewise function is a function that pieces together two or more parts of other functions to create a new function.

 [Figure1]