
2.1: Population and Culture (5 Days)
- Page ID
- 1945
\( \newcommand{\vecs}[1]{\overset { \scriptstyle \rightharpoonup} {\mathbf{#1}} } \)
\( \newcommand{\vecd}[1]{\overset{-\!-\!\rightharpoonup}{\vphantom{a}\smash {#1}}} \)
\( \newcommand{\dsum}{\displaystyle\sum\limits} \)
\( \newcommand{\dint}{\displaystyle\int\limits} \)
\( \newcommand{\dlim}{\displaystyle\lim\limits} \)
\( \newcommand{\id}{\mathrm{id}}\) \( \newcommand{\Span}{\mathrm{span}}\)
( \newcommand{\kernel}{\mathrm{null}\,}\) \( \newcommand{\range}{\mathrm{range}\,}\)
\( \newcommand{\RealPart}{\mathrm{Re}}\) \( \newcommand{\ImaginaryPart}{\mathrm{Im}}\)
\( \newcommand{\Argument}{\mathrm{Arg}}\) \( \newcommand{\norm}[1]{\| #1 \|}\)
\( \newcommand{\inner}[2]{\langle #1, #2 \rangle}\)
\( \newcommand{\Span}{\mathrm{span}}\)
\( \newcommand{\id}{\mathrm{id}}\)
\( \newcommand{\Span}{\mathrm{span}}\)
\( \newcommand{\kernel}{\mathrm{null}\,}\)
\( \newcommand{\range}{\mathrm{range}\,}\)
\( \newcommand{\RealPart}{\mathrm{Re}}\)
\( \newcommand{\ImaginaryPart}{\mathrm{Im}}\)
\( \newcommand{\Argument}{\mathrm{Arg}}\)
\( \newcommand{\norm}[1]{\| #1 \|}\)
\( \newcommand{\inner}[2]{\langle #1, #2 \rangle}\)
\( \newcommand{\Span}{\mathrm{span}}\) \( \newcommand{\AA}{\unicode[.8,0]{x212B}}\)
\( \newcommand{\vectorA}[1]{\vec{#1}} % arrow\)
\( \newcommand{\vectorAt}[1]{\vec{\text{#1}}} % arrow\)
\( \newcommand{\vectorB}[1]{\overset { \scriptstyle \rightharpoonup} {\mathbf{#1}} } \)
\( \newcommand{\vectorC}[1]{\textbf{#1}} \)
\( \newcommand{\vectorD}[1]{\overrightarrow{#1}} \)
\( \newcommand{\vectorDt}[1]{\overrightarrow{\text{#1}}} \)
\( \newcommand{\vectE}[1]{\overset{-\!-\!\rightharpoonup}{\vphantom{a}\smash{\mathbf {#1}}}} \)
\( \newcommand{\vecs}[1]{\overset { \scriptstyle \rightharpoonup} {\mathbf{#1}} } \)
\(\newcommand{\longvect}{\overrightarrow}\)
\( \newcommand{\vecd}[1]{\overset{-\!-\!\rightharpoonup}{\vphantom{a}\smash {#1}}} \)
\(\newcommand{\avec}{\mathbf a}\) \(\newcommand{\bvec}{\mathbf b}\) \(\newcommand{\cvec}{\mathbf c}\) \(\newcommand{\dvec}{\mathbf d}\) \(\newcommand{\dtil}{\widetilde{\mathbf d}}\) \(\newcommand{\evec}{\mathbf e}\) \(\newcommand{\fvec}{\mathbf f}\) \(\newcommand{\nvec}{\mathbf n}\) \(\newcommand{\pvec}{\mathbf p}\) \(\newcommand{\qvec}{\mathbf q}\) \(\newcommand{\svec}{\mathbf s}\) \(\newcommand{\tvec}{\mathbf t}\) \(\newcommand{\uvec}{\mathbf u}\) \(\newcommand{\vvec}{\mathbf v}\) \(\newcommand{\wvec}{\mathbf w}\) \(\newcommand{\xvec}{\mathbf x}\) \(\newcommand{\yvec}{\mathbf y}\) \(\newcommand{\zvec}{\mathbf z}\) \(\newcommand{\rvec}{\mathbf r}\) \(\newcommand{\mvec}{\mathbf m}\) \(\newcommand{\zerovec}{\mathbf 0}\) \(\newcommand{\onevec}{\mathbf 1}\) \(\newcommand{\real}{\mathbb R}\) \(\newcommand{\twovec}[2]{\left[\begin{array}{r}#1 \\ #2 \end{array}\right]}\) \(\newcommand{\ctwovec}[2]{\left[\begin{array}{c}#1 \\ #2 \end{array}\right]}\) \(\newcommand{\threevec}[3]{\left[\begin{array}{r}#1 \\ #2 \\ #3 \end{array}\right]}\) \(\newcommand{\cthreevec}[3]{\left[\begin{array}{c}#1 \\ #2 \\ #3 \end{array}\right]}\) \(\newcommand{\fourvec}[4]{\left[\begin{array}{r}#1 \\ #2 \\ #3 \\ #4 \end{array}\right]}\) \(\newcommand{\cfourvec}[4]{\left[\begin{array}{c}#1 \\ #2 \\ #3 \\ #4 \end{array}\right]}\) \(\newcommand{\fivevec}[5]{\left[\begin{array}{r}#1 \\ #2 \\ #3 \\ #4 \\ #5 \\ \end{array}\right]}\) \(\newcommand{\cfivevec}[5]{\left[\begin{array}{c}#1 \\ #2 \\ #3 \\ #4 \\ #5 \\ \end{array}\right]}\) \(\newcommand{\mattwo}[4]{\left[\begin{array}{rr}#1 \amp #2 \\ #3 \amp #4 \\ \end{array}\right]}\) \(\newcommand{\laspan}[1]{\text{Span}\{#1\}}\) \(\newcommand{\bcal}{\cal B}\) \(\newcommand{\ccal}{\cal C}\) \(\newcommand{\scal}{\cal S}\) \(\newcommand{\wcal}{\cal W}\) \(\newcommand{\ecal}{\cal E}\) \(\newcommand{\coords}[2]{\left\{#1\right\}_{#2}}\) \(\newcommand{\gray}[1]{\color{gray}{#1}}\) \(\newcommand{\lgray}[1]{\color{lightgray}{#1}}\) \(\newcommand{\rank}{\operatorname{rank}}\) \(\newcommand{\row}{\text{Row}}\) \(\newcommand{\col}{\text{Col}}\) \(\renewcommand{\row}{\text{Row}}\) \(\newcommand{\nul}{\text{Nul}}\) \(\newcommand{\var}{\text{Var}}\) \(\newcommand{\corr}{\text{corr}}\) \(\newcommand{\len}[1]{\left|#1\right|}\) \(\newcommand{\bbar}{\overline{\bvec}}\) \(\newcommand{\bhat}{\widehat{\bvec}}\) \(\newcommand{\bperp}{\bvec^\perp}\) \(\newcommand{\xhat}{\widehat{\xvec}}\) \(\newcommand{\vhat}{\widehat{\vvec}}\) \(\newcommand{\uhat}{\widehat{\uvec}}\) \(\newcommand{\what}{\widehat{\wvec}}\) \(\newcommand{\Sighat}{\widehat{\Sigma}}\) \(\newcommand{\lt}{<}\) \(\newcommand{\gt}{>}\) \(\newcommand{\amp}{&}\) \(\definecolor{fillinmathshade}{gray}{0.9}\)- Explain the demographic transition process. Understand the concept of carrying capacity as it relates to the planet’s human population.
- Outline the relationship between urbanization and family size. Show how the rural-to-urban shift relates to industrialization and the change in rural populations.
- Draw or paste a population pyramid from this section, and interpret and infer trends from a population pyramid.
- Determine if the population is increasing or declining and if the pace of growth is intensifying or slowing.
- Explain the difference between the concepts of culture and ethnicity as referenced in this book.
- Explain the difficulty in determining the number of languages and religions existing on Earth.
- List the main language families and the world’s major religions.
TEKS Regional Unit 02 Human Geographic Systems Chapter 2.1 Population and Culture
WG.5A Analyze how the character of a place is related to its political, economic, social, and cultural elements
WG.5B Interpret political, economic, social, and demographic indicators (gross domestic product per capita, life expectancy, literacy, and infant mortality) to determine the level of development and standard of living in nations using the terms Human Development Index, less developed, newly industrialized, and more developed
WG.6B Explain the processes that have caused changes in settlement patterns, including urbanization, transportation, access to and availability of resources, and economic activities.
WG.7A Construct and analyze population pyramids and use other data, graphics, and maps to describe the population characteristics of different societies and to predict future population trends
WG.7C Describe trends in world population growth and distribution.
WG.9A Identify physical and/or human factors such as climate, vegetation, language, trade networks, political units, river systems, and religion that constitute a region
WG.13B Compare maps of voting patterns or political boundaries to make inferences about the distribution of political power.
WG.14BCompare how democracy, dictatorship, monarchy, republic, theocracy, and totalitarian systems operate in specific countries
WG.16C Explain ways various groups of people perceive the characteristics of their own and other cultures, places, and regions differently.
WG.17B Describe major world religions, including Animism, Buddhism, Christianity, Hinduism, Islam, Judaism, Sikhism, and their spatial distribution.
WG.21B Describe the rights and responsibilities of citizens and noncitizens in civic participation throughout history
WG.21C Create and interpret different types of maps to answer geographic questions, infer relationships, and analyze change
Population and Culture
Demographic Transition
Demography is the study of how human populations change over time and space. It is a branch of human geography related to population geography, which is the examination of the spatial distribution of human populations. Geographers study how populations grow and migrate, how people are distributed around the world, and how these distributions change over time. For most of human history, relatively few people lived on Earth and the world population grew slowly. Only about 500 million people lived on the entire planet in 1650 (that’s less than half of India’s population in 2000).
Things changed dramatically during Europe’s Industrial Revolution in the late 1700s and into the 1800s when declining death rates due to improved nutrition and sanitation allowed more people to survive to adulthood and reproduce. The population of Europe grew rapidly. However, by the middle of the twentieth century, birth rates in developed countries declined, as children had become an economic liability rather than an economic asset to families. Fewer families worked in agriculture, more families lived in urban areas, and women delayed the age of marriage to pursue education, resulting in a decline in family size and a slowing of population growth. In some countries (e.g., Russia and Japan), the population is actually in decline, and the average age in developed countries has been rising for decades. The process just described is called the demographic transition.
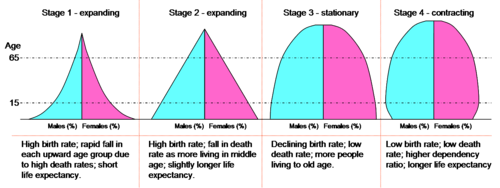 The Demographic Transition Model is the transition from higher birth and death rates to lower birth and death rates as a country or region develops from pre-industrial to an industrialized economic system.
At the beginning of the 20th century, the world’s population was about 1.6 billion. One hundred years later, there were roughly six billion people in the world, and as of 2018, the population is approximately 7.6 billion. This rapid growth occurred as the demographic transition spread from developed countries to the rest of the world. During the 20th century, death rates due to disease and malnutrition decreased in nearly every corner of the globe. In developing countries with agricultural societies, however, birth rates remained high. Low death rates and high birth rates resulted in rapid population growth.
Meanwhile, birth rates and family size have also been declining in most developing countries as people leave agricultural professions for urban areas. This means that population growth rates—while still higher in the developing world than in the developed world—are declining. Although the exact figures are unknown, demographers expect the world’s population to stabilize by 2100 and then decline somewhat.
In 2010, the world’s population was growing by about 80 million people per year, a growth rate found almost exclusively in developing countries, as populations are stable or in decline in places such as Europe and North America. World population increase is more pronounced on the continent of Asia. Moreover, China and India are the most populous countries in the world, each with more than a billion people. Pakistan is an emerging population giant with a high rate of population growth. The continent of Africa has the highest fertility rates in the world, with countries such as Nigeria—Africa’s most populous and the world’s eighth most populous country—growing rapidly each year.
The most striking paradox within population studies is that while there has been marked decline in fertility (a declining family size) in developing countries, the world’s population will grow substantially by 2030 because of the compounding effect of a large number of people already in the world—that is, even though population growth rates are in decline in many countries, the population is still growing. A small growth rate on a large base population still results in the birth of many millions of people.
Earth’s human population is growing at a rate of about 1.4 percent per year. If the current growth rate continues, the human population will double in about 50 years to more than 12 billion. The current population increase remains at about 80 million per year. A change in the growth rate will change the doubling time. Between 2010 and 2050, world population growth will be generated exclusively in developing countries.
The three largest population clusters in the world are the regions of eastern China, South Asia, and Europe. Southeast Asia also has large population clusters. Additional large population centers exist in various countries with high urbanization. An example is the urbanized region between Boston and Washington, DC, which includes New York City, Philadelphia, Baltimore, and neighboring metropolitan areas, resulting in a region often called a megalopolis. The coastal country of Nigeria in West Africa or the island of Java in Indonesia are good examples of large population clusters centered in the tropics.
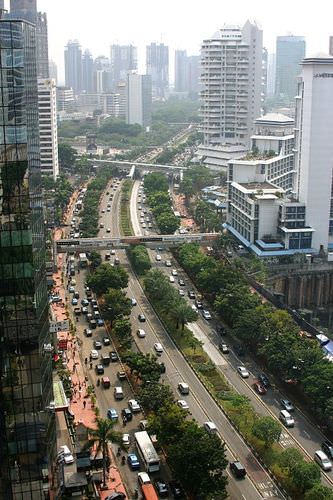
Jakarta, Indonesia, is located on the northwest coast of the world's most populous island of Java.
Social dynamics and geography will determine where the new additions to the human family will live. Providing food, energy, and materials for these additional humans will tax many countries of the world. Poverty, malnutrition, and disease are expected to increase in regions with poor sanitation, limited clean water, and lack of economic resources. In 2018, more than one-third of the planet’s population live in poverty and earn less than the equivalent of two US dollars per day. The carrying capacity of the planet is not and cannot be known. How many humans can the earth sustain in an indefinite manner? There is the possibility that we have already reached the threshold of its carrying capacity.
Human population will continue to grow until it either crashes due to the depletion of resources or stabilizes at a sustainable carrying capacity. Population growth exacts a toll on the earth as more people use more environmental resources. The areas most immediately affected by increased populations include forests (a fuel resource and a source of building material), fresh water supplies, and agricultural soils. These systems get overtaxed, and their depletion has serious consequences.
Type C climates, which are moderate and temperate, are usually the most productive and are already vulnerable to serious deforestation, water pollution, and soil erosion. Maintaining adequate food supplies will be critical to supporting a sustainable carrying capacity. The ability to transport food supplies quickly and safely is a major component of the ability to manage the conservation of resources. Deforestation by humans using wood for cooking fuel is already a serious concern in the arid and dry type B climates.
Urbanization and Family Size
As countries move from an agricultural to an industrial economy, there is a major shift in population from rural to urban settings. The Industrial Revolution of the 19th century ushered in major technological developments and changes in labor practices, which encouraged migration from the farm to the city. Because of increased mechanization, fewer farm workers are needed to produce larger agricultural yields. At the same time, factories in urban areas have a great need for industrial workers. This shift continued into the information age of the late 20th century and continues in many parts of the developing world in the current century.
A basic principle of population growth that addresses this rural-to-urban shift states that as countries industrialize and urbanize, family size typically decreases and incomes traditionally increase. Though this may not be true in all cases, it is a general principle that is consistent across cultural lines. Agricultural regions generally have a larger average family size than that of their city counterparts. The fertility rate is the average number of children a woman in a particular country has in her lifetime, whether or not they all live to adulthood.
If a fertility rate for a given country is less than 2.1—the replacement level—the population of that country is in decline, unless there is significant immigration. A fertility rate greater than 2.1 indicates that the country’s population is increasing. Some children will never reach reproductive age or have children of their own, so the replacement rate has to be slightly greater than two. The concept of fertility rate is slightly different from the term family size, which indicates the number of living children raised by a parent or parents in the same household. In this textbook, family size is used to illustrate the concept of population growth and decline.
Population Demands
A country’s demographic statistics can be illustrated graphically by a population pyramid. A population pyramid is essentially two bar graphs that depict male and female age cohorts either in absolute size or as a percentage of the total population. Male cohorts are typically shown on the left side of the pyramid and females are on the right side. The three pyramid types are rapid growth, slow growth, and negative growth.
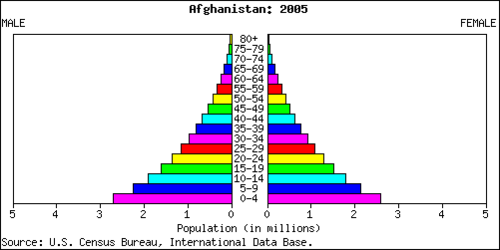
This population pyramid of Afghanistan is an example of rapid growth.
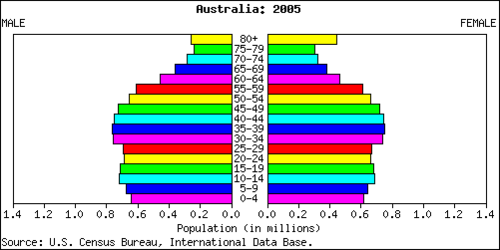
This population pyramid of Australia is an example of slow growth.
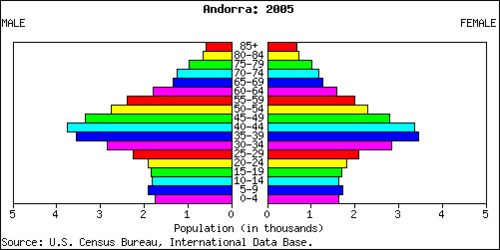
This population pyramid of Andorra is an example of negative growth.
The shape of a country’s population pyramid tells a story about the history of its population growth. For example, a high-growth-rate country has a pyramid that is narrow at the top and wide at the bottom, showing that every year more children have been born than the year before. As family size decreases and women in a society have fewer children, the shape of the pyramid changes. A population pyramid for a post-industrialized country that has negative growth would be narrower at the bottom than in the middle, indicating that there are fewer children than middle-aged people. These shapes also illustrate the percentage of a population under the age of 15 or over the age of 65, which are standard indicators of population growth. Many post-industrial countries have a negative population growth rate. Their population pyramids are narrow at the bottom, indicating an urbanized population with small family sizes.
Culture and Ethnicity
The term culture is often difficult to differentiate from the term ethnicity. In this textbook, ethnicity indicates traits people are born with, including genetic backgrounds, physical features, or birthplaces. People have little choice in matters of ethnicity. The term culture indicates what people learn after they are born, including language, religion, and customs or traditions. Individuals can change matters of culture by individual choice after they are born. These two terms help us identify human patterns and understand a country’s driving forces.
The terms culture and ethnicity might also be confused in the issue of ethnic cleansing, which refers to the forced removal of a people from their homeland by a stronger force of a different people. Ethnic cleansing might truly indicate two distinct ethnic groups: one driving the other out of their homeland and taking it over. On the other hand, ethnic cleansing might also mean cultural cleansing if both the aggressor and the group driven out are of the same ethnic stock but hold different cultural values, such as religion or language. The term ethnic cleansing has been used to describe either case.
Languages of the World
Language is the communication mode of human culture and it represents the complete diversity of thought, literature, and the arts. All the billions of people on the planet speak at least one language. While Ethnologue, a publication pertaining to the world’s languages, estimates that there were 6,909 living languages in the world as of 2009, the exact number may never be determined. Other data sets count languages differently, but most agree that there are more than 6,000. There are communities in various parts of the world where people can communicate by whistling messages to each other or by using clicking sounds.
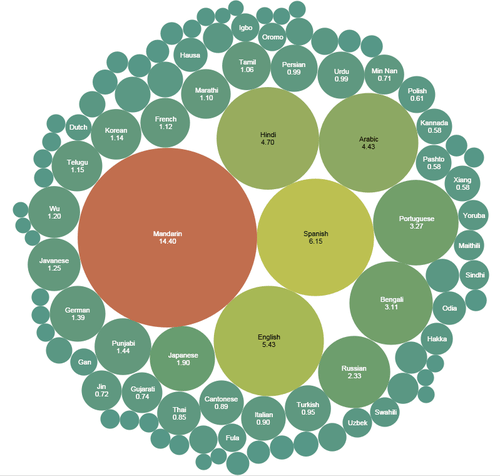
This bubble chart illustrates the languages by the proportion of native speakers worldwide from Mikael Parkvall, "Världens 100 största språk 2007" (The World's 100 Largest Languages in 2007).
Of the more than 6,000 languages, about a dozen are spoken by more than 100 million people each. These are the world’s main languages used in the most populous countries. However, the vast majority of the world’s languages are spoken by a relatively small number of people. In fact, many languages have no written form and are spoken by declining numbers of people. Language experts estimate that up to half the world’s living languages could be lost by the end of the 21st century as a result of globalization. New languages form when populations live in isolation, and in the current era, as the world’s populations are increasingly interacting with each other, languages are being abandoned and their speakers are switching to more useful tongues.
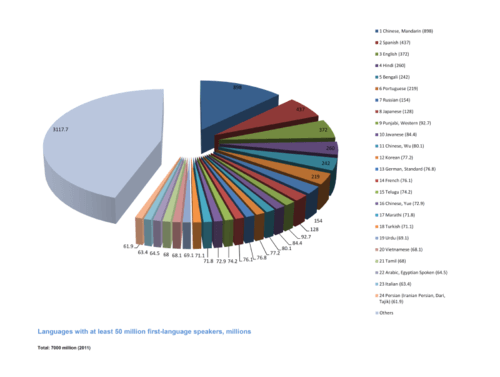
This pie chart shows the languages of the world with at least 50 million first-language speakers (in millions).
There are nine dominant language families in the world. Each of the languages within a language family shares a common ancestral language. An example of a language family is the Indo-European family, which has a number of branches of language groups that come from the same base: a language called Proto-Indo-European that was probably spoken about 6,000 years ago. As populations migrated away from the ancestral homeland, their language evolved and separated into many new languages. The three largest language groups of the Indo-European family used in Europe are the Germanic, Romance, and Slavic groups. Other Indo-European languages include Hindi (spoken in India) and Persian (spoken in Iran).
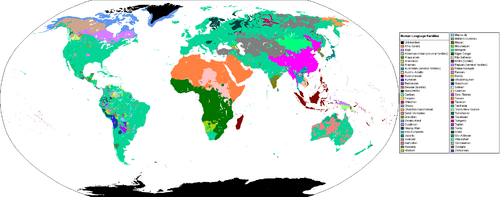
This map of the world shows the primary human languages and the locations where they are dominant.
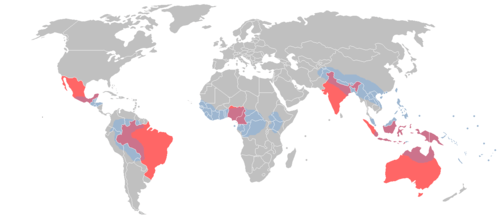
Together, the eight countries in red contain more than 50 percent of the world's languages. The areas in blue are the most linguistically diverse in the world, and the locations of most of the world's endangered languages.
Language Characteristics
The following terms are used to describe language characteristics.
- An accent is the pronunciation of words within a language that is different from that used by a different group of the same language. For example, people in Mississippi pronounce words differently from people in North Dakota, but the differences are less severe than dialects.
- Similar to pidgin, a Creole language arises from contact between two other languages and has features of both. However, Creole is a pidgin that becomes a primary language spoken by people at home. Creole languages are often developed in colonial settings as a dialect of the colonial language (usually French or English). For example, in the former French colony of Haiti, a French-based Creole language was developed that is spoken by people at home, while French is typically used for professional purposes.
- A dead language is one that is no longer used for local communication. For example, Latin is no longer used by local people to communicate but is still used by the Roman Catholic Church in some of its services.
- A dialect is a regional variety of a language that uses different grammar or pronunciation. Examples include American English versus British English. Linguists suggest that there are three main dialects of the English language in the United States: a Southern dialect, a Midland dialect, and a Northern dialect. Television and public media communication have brought a focus on more uniform speech patterns that have diminished the differences between these three dialects.
- An isolated language is one not connected to any other language on Earth. For example, Basque is not connected to any other language and is only spoken in the region of the Pyrenees between Spain and France.
- A lingua franca is a second language used for commercial purposes with others outside a language group but not used in personal lives. For example, Swahili is used by millions in Africa for doing business with people outside their own group but is not used to communicate within local communities.
- The official language is the language that is on record by a country to be used for all its official government purposes. For example, in India, the official language is Hindi, though in many places the lingua franca is English and several local languages may be spoken.
- A pidgin is a simplified, created language used to communicate between two or more groups that do not have a language in common. For example, Residents of New Guinea mix English words with their own language to create a new language that can bridge speakers of different local language groups. Though the words are in English, the grammar and sentence structure is mixed up according to local vocabulary. There are many English-based pidgin languages around the world.
- Slang is the local use of informal words or phrases that are not part of the official language. For example, a lot of musicians use slang in their lyrics.
Religions of the World
Religious geography is the study of the distribution of religions and their relationship to their place of origin. Religious geographers recognize three main types of religions: universal (or universalizing), ethnic (or cultural), and tribal (or traditional) religions. Universal religions include Christianity, Islam, and various forms of Buddhism. These religions attempt to gain worldwide acceptance and appeal to all types of people, and they actively look for new members or converts. Ethnic religions appeal to a single ethnic group or culture. These religions do not actively seek out converts.
Broader ethnic religions include Judaism, Shintoism, Hinduism, and Chinese religions that embrace Confucianism and Taoism. Finally, traditional religions involve the belief in some form of supernatural power that people can appeal to for help, including ancestor worship and the belief in spirits that live in various aspects of nature, such as trees, mountaintops, and streams (this is often called animism). Sub-Saharan Africa is home to many traditional religions.
Although the world’s primary religions are listed here, many other religions are practiced around the world, as well as many variations of the religions outlined here. The top four religions by population are Christianity, Islam, Hinduism, and Buddhism. Because the official doctrine of Communism was nonreligious or atheist, there are actually many more followers of Buddhism in China than demographic listings indicate. The percentage of the world’s population that follows Buddhism is probably much higher than the six percent often listed for this religion.
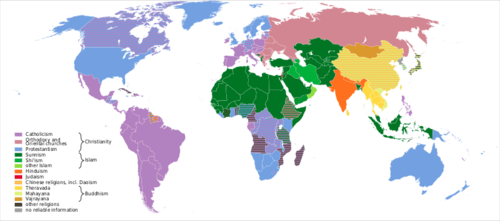
This world map is color-coded to denote the major religions found worldwide.
Buddhism is a religion or way of life based on the teachings and life of Siddhartha Gautama, also known as the Buddha, who lived in what is now India and Nepal around the 5th century B.C.E. There are three main branches of Buddhism: (1) southern or Theravada Buddhism; (2) eastern or Mahayana Buddhism; (3) and northern or Vajrayana Buddhism. Followers of Buddhism are called Buddhists. Buddhists follow the Eightfold Path and aspire to know and understand the Four Noble Truths.
Christianity originated out of Judaism in the eastern Mediterranean and the Arabian Peninsula. It is a monotheistic religion that looks to the Jewish patriarch Abraham as the founder. Christianity, based on the life and teachings of Jesus Christ, who lived in Palestine in the first century C.E., spread rapidly through the Roman Empire. Followers of Christianity are called Christians. The central religious text for Christians is The Bible.
Hinduism, a religious tradition that originated on the Indian subcontinent, is one of the oldest major religions in the world. It may date back to as far as 2000 B.C.E. or earlier. Unlike other world religions, Hinduism has no single founder and has diverse beliefs and traditions. Followers of Hinduism are called Hindus. Hinduism has a large body of scripture, including the Vedas, the Upanishads, and epic tales such as the Mahabharata and the Ramayana.
Islam also originated out of Judaism and is based on the teachings of Muhammad, a seventh-century religious and political figure who lived on the Arabian Peninsula. Islam spread rapidly across North Africa, east across southern Asia, and north to Europe in the centuries after Muhammad’s death. Followers of Islam are called Muslims. The central religious text for Muslims is the Koran.
Judaism is the religion of the Jewish people, whose traditions and ethics are embodied in the Tanakh and the Talmud. According to Jewish tradition, Judaism began with the covenant between God and Abraham around 2000 B.C.E. The second covenant happened 450 years later when Moses led the Jews out of slavery in Egypt and gave them the 10 Commandants.
1.Activity space: The area within which people move freely on their rounds of regular activity
2.Agricultural revolution: The time when human beings first domesticated plants and animals and no longer relied entirely on hunting and gathering
3.AIDS: A serious (often fatal) disease of the immune system transmitted through blood products especially by sexual contact or contaminated needles
4.Arable land: land suitable for growing crops
5.Arithmetic growth: population growth where population increases by the same amount over each time interval
6.Arithmetic population density: The total number of people divided by the total land area
7.Assimilation: the social process of absorbing one cultural group into harmony with another
8.Authenticity: In the context of local cultures or customs, the accuracy with which a single stereotypical or typecast image or experience conveys an otherwise dynamic and complex local culture or its customs
9.Awareness space: Knowledge of opportunity activities well beyond the normal activity space
10.Carrying capacity: The largest number of individuals of a population that an environment can support
11.Commodification: Giving a price tag or value to something that was not previously perceived as having a money-related value.
12.Crude birth rate: The total number of live births in a year for every 1,000 people alive in the society.
13.Crude death rate: The number of deaths per year per 1,000 people.
14.Cultural Appropriation: the process by which cultures adopt customs and knowledge from other cultures and use them for their own benefit
15.Cultural Landscape: the visible imprint of human activity and culture on the landscape
16.Custom: Practices followed by the people of a particular cultural group
17.Demographic equation: The formula that calculates population change. The formula finds the increase (or decrease) in a population. The formula is found by doing births minus deaths plus (or minus) net migration. This is important because it helps to determine which stage in the demographic transition model a country is in
18.Demographic momentum: this is the tendency for a growing population to continue growing after a fertility decline because of their young age distribution. This is important because once this happens a country moves to a different stage in the demographic transition model
19.Demographic transition theory: Multistage model, based on Western Europe's experience, of changes in population growth exhibited by countries undergoing industrialization. High birth rates and death rates are followed by plunging death rates, producing a huge net population gain; this is followed by the convergence of birth rates and death rates at a low overall level
20.demography: The scientific study of population characteristics
21.Diffusion routes: The spatial trajectory through which cultural traits or other phenomena spread
22.distance decay: The decline of activity or function with increasing distance from its point of origin
23.Dot maps: Thematic maps that use points to show the precise locations of specific observations or occurrences, such as crimes, car accidents, or births
24.Doubling rate: The length of time needed to double the population
25.endemic: confined to a particular country or area
26.Epidemiologic transition: distinctive causes of death in each stage of the demographic transition
27.Ethnic neighborhood: a neighborhood, typically situated in a larger metropolitan city and constructed by or comprised of a local culture, in which a local culture can practice its customs
28.Exponential growth: Growth pattern in which the individuals in a population reproduce at a constant rate
29.Female infanticide: the intentional killing of baby girls due to the preference for male babies and from the low value associated with the birth of females
30.Folk Culture: Culture traditionally practiced by a small, homogeneous, rural group living in relative isolation from other groups
31.Folk-Housing Regions: A region in which the housing stock predominantly reflects styles of building that are particular to the culture of the people who have long inhabited the area
32.Geometric growth: an increase in quantity by a constant proportion each year
33.Global-Local Continuum: notion that what happens at the global scale directly effects what happens at the global scale directly effects what happens at a local scale, and vice versa
34.Glocalization: The process by which people in a local place mediate and alter regional, national, and global processes
35.Hearth: The region from which innovative ideas originate
36.Hierarchical Diffusion: A form of diffusion in which an idea or innovation spreads by passing first among the most connected places or peoples
37.Infant mortality rate: The percentage of children who die before their first birthday within a particular area or country
38.Life expectancy: The average number of years an individual can be expected to live, given current social, economic, and medical conditions. Life expectancy at birth is the average number of years a newborn infant can expect to live
39.Local Culture: A set of common experiences or customs that shape the identity of a place and the people who live there. Local cultures are often the subjects of preservation or economic development efforts
40.Material culture: the art, housing, clothing, sports, dances, foods, and other similar items constructed or created by a group of people
41.Natural increase: Population growth measured as the excess of live births over deaths; does not reflect either emigrant or immigrant movements
42.Neolocalism: A renewed interest in sustaining and promoting the uniqueness of a place
43.Neo-Malthusians: A group who built on Malthus' theory and suggested that people wouldn't just starve for lack of food, but would have wars about food and other scarce resources
44.Non-material culture: Human creations, such as values, norms, knowledge, systems of government, language, and so on, that are not embodied in physical objects
45.One-child policy: A program established by the Chinese government in 1979 to slow population growth in China
46.Overpopulation: The number of people in an area exceeds the capacity of the environment to support life at a decent standard of living
47.Pandemic: Disease that occurs over a wide geographic area and affects a very high proportion of the population.
48.Physiological population density: The number of people per unit of area of arable land, which is land suitable for agriculture
49.Placelessness: the loss of uniqueness of place in the cultural landscape so that one place looks like the next
50.Popular Culture: cultural patterns that are widespread among a society's population
51.Population concentrations: Areas of the world with a large population density
52.Population density: A measurement of the number of people per given unit of land
53.Population explosion: a sudden increase or burst in the population in either a certain geographical area or worldwide
54.Population geography: the study of spatial variations among populations and population-environment interactions
55.Population pyramid: A bar graph representing the distribution of the population by age and sex
56.Restrictive population policies: Government policies designed to reduce the rate of natural increase
57.Reterritorialization: with respect to popular culture, when people within a place start to produce an aspect of popular culture themselves, doing so in the context of their local culture and making it their own
58.Stationary population level: The level at which a national population ceases to grow
59.sustainability: The use of Earth's renewable and nonrenewable natural resources in ways that do not constrain resource use
- The human population is moving closer to eight billion in 2018 and is increasing rapidly, mainly in developing regions of Asia and Africa.
- There is no agreement on the earth’s carrying capacity for our human population, but unless the growth rate changes, the human population will double in about 50 years.
- Since the Industrial Revolution, humans have been moving from rural areas to urban areas.
- Workers were needed in the factories and fewer workers were needed on the farms because of improved technology. This trend continues in many rural areas of developing countries.
- Population pyramids are one method of illustrating demographic data for a country to show if the population is declining or increasing and at what rate.
- Though often interchangeable in general terms, ethnicity is what you are born with and culture is what you learn after you are born.
- There are about 6,000 languages in the world today, with about 13 of them spoken by over 100 million people or more.
- Of the main language families, nine include at least one percent or more of the human population.
- There are thousands of religions or variants of them in the world.
- Religious geographers recognize three main types of religions: universal, ethnic, and traditional.
- The four main religions of the world are Buddhism, Christianity, Hinduism, and Islam.
Interactive Notebook Activities
Applying Knowledge
- Describe the demographic transition process and define the concept of carrying capacity as it relates to the planet’s human population.
- Outline the relationship between urbanization and family size. Show how the rural-to-urban shift relates to industrialization and the change in rural populations.
- Draw or paste a population pyramid from this section, and interpret and infer trends from it.
- Analyze your population pyramid to determine whether the population is increasing or declining and if the pace of growth is intensifying or slowing.
- Explain the difference between the concepts of culture and ethnicity as these terms are used in this textbook.
- Summarize the difficulty in determining the number of languages and religions existing on Earth.
- List the main language families and the world’s major religions.
Discussion and Study Questions
- What is the planet’s current human population?
- What happens when overpopulation occurs? Do we know the earth’s carrying capacity?
- Where are the earth’s three main high-density population regions?
- Outline the four basic shapes of population pyramids. What do they indicate?
- What is the difference between culture and ethnicity?
- What is ethnic cleansing? Where has ethnic cleansing occurred in the world during your lifetime?
- Approximately how many languages are there in the world? Which continent has the most?
- What are the five most widely spoken languages in the world? Where would each be mainly spoken?
- What are the four major world religions by the percentage of followers?
- What is the difference between an ethnic, universal, or a traditional religion? Give an example of each.
Real-World Geography Exercise
- Create a population pyramid for your state, province, or country using the population data available at census.gov.
- Compare population pyramids for countries from each world region found at the census.gov International Data Base.
- Using Google Translator, learn five common phrases in a language you do not speak.
Mapping Exercise
World Population: Students will explore the patterns of the world population in terms of total population, arithmetic density, total fertility rate, natural increase rate, and infant mortality rate. The activity uses a web-based map.
Language and Religion: Students will explore patterns of cultural diffusion through linguistic and religious data. The activity uses a web-based map.
Videos for Geography Enrichment
Helpful Websites for the Study of Geography
Canadian Encyclopedia is an encyclopedia funded by the Canadian government covering all branches of knowledge. Their scholarly collection includes interactive materials.
CIA World Factbook provides information on the people, history, government, economy, energy, geography, communications, transportation, military, and transnational issues for the world's entities.
Congress.gov is a US government website where you can find federal legislation, past and present, as well as information about the US legal system.
Drug Enforcement Administration (DEA) is a government agency website that provides current news, resources, topics of interest, information about drugs, careers in the DEA, and a tip hotline.
Library of Congress is the largest library in the world and provides manuscripts, files, information, pictures, and videos.
NASA Earth Observatory (NEO) is a US government agency website that allows users to search for and retrieve satellite images of Earth.
National Archives is a US government website that provides historical documents, photos, records, publications, and educator resources.
National Oceanic and Atmospheric Association (NOAA) is a US government agency website that provides weather-related information and ocean research.
National Map is a website by the United States Geological Survey and other federal, state, and local agencies that delivers topographic information for the United States.
NationMaster is a massive central data source and a handy way to graphically compare nations.
Real-Time World Air Quality Index is a website that measures most locations in the world for air pollution in real time.
StateMaster is a unique statistical database, which allows you to research and compare a multitude of different data on US states.
United Nations (UN) is an international organization founded in 1945 and made up of 193 member states. The UN maintains international peace and security, protects human rights, delivers humanitarian aid, promotes sustainable development, and upholds international law.
United States Census Bureau is a US government agency that provides a population clock, data, surveys, statistics, a library with information and infographics, news about the economy, and much more.
United States Geological Survey (USGS) is a US government agency website that provides scientific information about the natural hazards that threaten lives, the natural resources we rely on, the health of our ecosystems and environment, and the impacts of climate and land-use change.
Whitehouse.gov is a US government website that provides the latest presidential news, information about the budget, policy, defense, and many more topics.
World Health Organization (WHO) is under the United Nations and provides leadership on matters critical to health, shapes the research agenda on health, and monitors the health situation and assessing health trends around the world. Their website provides information on the state of health around the world, outbreaks, current health news, and more.
World Trade Organization (WTO) is an intergovernmental organization that regulates international trade. The website provides information on the history of the multilateral trading system, featured videos, news and events, trade topics, and more.
| # | Answer Key | Region | Topic |
| 11 | 1B 2C 3C 4D 5B 6D 7B 8A | Poland | Reading A Map |
| 12 | 1C 2B 3D 4A 5C 6D 7C | Europe | Interpreting Map Data |
| 13 | 1D 2B 3B 4B 5B 6A 7D | World | Reading Line Graphs |
| 14 | 1B 2D 3D 4C 5A 6D 7A 8D 9B 10C | World | Reading Tables |
| 15 | 1A 2A 3C 4A 5B 6A 7B 8A 9C 10D | France | Finding Routes and Distances |
| Image | Reference | Attributions |
 |
[Figure 1] | Credit: By User:SuzanneKn [Public domain], via Wikimedia Commons Source: https://commons.wikimedia.org/wiki/File%3ADtm_pyramids.png License: CC BY-NC 3.0 |
|
[Figure 2] | Credit: By Sanko (Own work) [CC BY-SA 3.0 (https://creativecommons.org/licenses/by-sa/3.0)], via Wikimedia Commons Source: https://commons.wikimedia.org/wiki/File%3AJalanJenderalSudirmanJakarta.jpg License: CC BY-NC 3.0 |
|
[Figure 3] | Credit: U.S. Census Bureau [Public domain], via Wikimedia Commons Source: commons.wikimedia.org/wiki/File:Afghanistan_population_pyramid_2005.png License: CC BY-NC 3.0 |
|
[Figure 4] | Credit: U.S. Census Bureau [Public domain], via Wikimedia Commons Source: commons.wikimedia.org/wiki/File:Australia_population_pyramid_2005.png License: CC BY-NC 3.0 |
|
[Figure 5] | Credit: U.S. Census Bureau [Public domain], via Wikimedia Commons Source: commons.wikimedia.org/wiki/File:Andorra_population_pyramid_2005.png License: CC BY-NC 3.0 |
|
[Figure 6] | Credit: Mikael Parkvall, "Världens 100 största språk 2007" (The World's 100 Largest Languages in 2007), in Nationalencyklopedin. Asterisks mark the 2010 estimates for the top dozen languages. Source: en.Wikipedia.org/wiki/List_of_languages_by_number_of_native_speakers License: CC BY-NC 3.0 |
|
[Figure 7] | Credit: By Nikolay Omonov (Own work) [CC BY-SA 4.0 (https://creativecommons.org/licenses/by-sa/4.0)], via Wikimedia Commons Source: en.Wikipedia.org/wiki/List_of_languages_by_number_of_native_speakers#/media/File:Languages_with_at_least_50_million_first-language_speakers.png License: CC BY-NC 3.0 |
|
[Figure 8] | Credit: By PiMaster3 (Own work) [CC BY-SA 3.0 (https://creativecommons.org/licenses/by-sa/3.0)], via Wikimedia Commons Source: commons.wikimedia.org/wiki/File%3APrimary_Human_Language_Families_Map.png License: CC BY-NC 3.0 |
|
[Figure 9] | Credit: By Davius (Own work) [Public domain], via Wikimedia Commons Source: commons.wikimedia.org/wiki/File%3ALinguistic_diversity.png License: CC BY-NC 3.0 |
|
[Figure 10] | Credit: By World religions map ru.svg: Tetromino et al. derivative work: — Obsuser [CC BY 3.0 (http://creativecommons.org/licenses/by/3.0) or GFDL (http://www.gnu.org/copyleft/fdl.html)], via Wikimedia Commons Source: commons.wikimedia.org/wiki/File%3AWorld_religions_map_en.svg License: CC BY-NC 3.0 |