
4.1.1: Graphs in the Coordinate Plane
- Page ID
- 4303
\( \newcommand{\vecs}[1]{\overset { \scriptstyle \rightharpoonup} {\mathbf{#1}} } \)
\( \newcommand{\vecd}[1]{\overset{-\!-\!\rightharpoonup}{\vphantom{a}\smash {#1}}} \)
\( \newcommand{\id}{\mathrm{id}}\) \( \newcommand{\Span}{\mathrm{span}}\)
( \newcommand{\kernel}{\mathrm{null}\,}\) \( \newcommand{\range}{\mathrm{range}\,}\)
\( \newcommand{\RealPart}{\mathrm{Re}}\) \( \newcommand{\ImaginaryPart}{\mathrm{Im}}\)
\( \newcommand{\Argument}{\mathrm{Arg}}\) \( \newcommand{\norm}[1]{\| #1 \|}\)
\( \newcommand{\inner}[2]{\langle #1, #2 \rangle}\)
\( \newcommand{\Span}{\mathrm{span}}\)
\( \newcommand{\id}{\mathrm{id}}\)
\( \newcommand{\Span}{\mathrm{span}}\)
\( \newcommand{\kernel}{\mathrm{null}\,}\)
\( \newcommand{\range}{\mathrm{range}\,}\)
\( \newcommand{\RealPart}{\mathrm{Re}}\)
\( \newcommand{\ImaginaryPart}{\mathrm{Im}}\)
\( \newcommand{\Argument}{\mathrm{Arg}}\)
\( \newcommand{\norm}[1]{\| #1 \|}\)
\( \newcommand{\inner}[2]{\langle #1, #2 \rangle}\)
\( \newcommand{\Span}{\mathrm{span}}\) \( \newcommand{\AA}{\unicode[.8,0]{x212B}}\)
\( \newcommand{\vectorA}[1]{\vec{#1}} % arrow\)
\( \newcommand{\vectorAt}[1]{\vec{\text{#1}}} % arrow\)
\( \newcommand{\vectorB}[1]{\overset { \scriptstyle \rightharpoonup} {\mathbf{#1}} } \)
\( \newcommand{\vectorC}[1]{\textbf{#1}} \)
\( \newcommand{\vectorD}[1]{\overrightarrow{#1}} \)
\( \newcommand{\vectorDt}[1]{\overrightarrow{\text{#1}}} \)
\( \newcommand{\vectE}[1]{\overset{-\!-\!\rightharpoonup}{\vphantom{a}\smash{\mathbf {#1}}}} \)
\( \newcommand{\vecs}[1]{\overset { \scriptstyle \rightharpoonup} {\mathbf{#1}} } \)
\( \newcommand{\vecd}[1]{\overset{-\!-\!\rightharpoonup}{\vphantom{a}\smash {#1}}} \)
\(\newcommand{\avec}{\mathbf a}\) \(\newcommand{\bvec}{\mathbf b}\) \(\newcommand{\cvec}{\mathbf c}\) \(\newcommand{\dvec}{\mathbf d}\) \(\newcommand{\dtil}{\widetilde{\mathbf d}}\) \(\newcommand{\evec}{\mathbf e}\) \(\newcommand{\fvec}{\mathbf f}\) \(\newcommand{\nvec}{\mathbf n}\) \(\newcommand{\pvec}{\mathbf p}\) \(\newcommand{\qvec}{\mathbf q}\) \(\newcommand{\svec}{\mathbf s}\) \(\newcommand{\tvec}{\mathbf t}\) \(\newcommand{\uvec}{\mathbf u}\) \(\newcommand{\vvec}{\mathbf v}\) \(\newcommand{\wvec}{\mathbf w}\) \(\newcommand{\xvec}{\mathbf x}\) \(\newcommand{\yvec}{\mathbf y}\) \(\newcommand{\zvec}{\mathbf z}\) \(\newcommand{\rvec}{\mathbf r}\) \(\newcommand{\mvec}{\mathbf m}\) \(\newcommand{\zerovec}{\mathbf 0}\) \(\newcommand{\onevec}{\mathbf 1}\) \(\newcommand{\real}{\mathbb R}\) \(\newcommand{\twovec}[2]{\left[\begin{array}{r}#1 \\ #2 \end{array}\right]}\) \(\newcommand{\ctwovec}[2]{\left[\begin{array}{c}#1 \\ #2 \end{array}\right]}\) \(\newcommand{\threevec}[3]{\left[\begin{array}{r}#1 \\ #2 \\ #3 \end{array}\right]}\) \(\newcommand{\cthreevec}[3]{\left[\begin{array}{c}#1 \\ #2 \\ #3 \end{array}\right]}\) \(\newcommand{\fourvec}[4]{\left[\begin{array}{r}#1 \\ #2 \\ #3 \\ #4 \end{array}\right]}\) \(\newcommand{\cfourvec}[4]{\left[\begin{array}{c}#1 \\ #2 \\ #3 \\ #4 \end{array}\right]}\) \(\newcommand{\fivevec}[5]{\left[\begin{array}{r}#1 \\ #2 \\ #3 \\ #4 \\ #5 \\ \end{array}\right]}\) \(\newcommand{\cfivevec}[5]{\left[\begin{array}{c}#1 \\ #2 \\ #3 \\ #4 \\ #5 \\ \end{array}\right]}\) \(\newcommand{\mattwo}[4]{\left[\begin{array}{rr}#1 \amp #2 \\ #3 \amp #4 \\ \end{array}\right]}\) \(\newcommand{\laspan}[1]{\text{Span}\{#1\}}\) \(\newcommand{\bcal}{\cal B}\) \(\newcommand{\ccal}{\cal C}\) \(\newcommand{\scal}{\cal S}\) \(\newcommand{\wcal}{\cal W}\) \(\newcommand{\ecal}{\cal E}\) \(\newcommand{\coords}[2]{\left\{#1\right\}_{#2}}\) \(\newcommand{\gray}[1]{\color{gray}{#1}}\) \(\newcommand{\lgray}[1]{\color{lightgray}{#1}}\) \(\newcommand{\rank}{\operatorname{rank}}\) \(\newcommand{\row}{\text{Row}}\) \(\newcommand{\col}{\text{Col}}\) \(\renewcommand{\row}{\text{Row}}\) \(\newcommand{\nul}{\text{Nul}}\) \(\newcommand{\var}{\text{Var}}\) \(\newcommand{\corr}{\text{corr}}\) \(\newcommand{\len}[1]{\left|#1\right|}\) \(\newcommand{\bbar}{\overline{\bvec}}\) \(\newcommand{\bhat}{\widehat{\bvec}}\) \(\newcommand{\bperp}{\bvec^\perp}\) \(\newcommand{\xhat}{\widehat{\xvec}}\) \(\newcommand{\vhat}{\widehat{\vvec}}\) \(\newcommand{\uhat}{\widehat{\uvec}}\) \(\newcommand{\what}{\widehat{\wvec}}\) \(\newcommand{\Sighat}{\widehat{\Sigma}}\) \(\newcommand{\lt}{<}\) \(\newcommand{\gt}{>}\) \(\newcommand{\amp}{&}\) \(\definecolor{fillinmathshade}{gray}{0.9}\)Graphs in the Coordinate Plane
Suppose that every year you go to the doctor for a routine physical, and each time the doctor measures your resting heart rate in beats per minute. The doctor has kept this data, and in order to see how your resting heart rate has changed over time, you want to plot the data on a coordinate plane. Could you do it? Or what if the doctor has already plotted the points for you? Could you look at the points and determine what your resting heart rate was each year?
The Coordinate Plane
Previously, you graphed ordered pairs. This Concept will expand upon your knowledge of graphing ordered pairs to include vocabulary and the naming of specific items related to ordered pairs.
An ordered pair is also called a coordinate. The y−value is called the ordinate and the x−value is called the abscissa.
A two-dimensional (2-D) coordinate has the form (x,y).
The 2-D plane that is used to graph coordinates or equations is called a Cartesian plane or a coordinate plane. This 2-D plane is named after its creator, Rene Descartes. The Cartesian plane is separated into four quadrants by two axes. The horizontal axis is called the x−axis and the vertical axis is called the y−axis. The quadrants are named using Roman numerals. The image below illustrates the quadrant names.

The first value of the ordered pair is the x−value. This value moves along the x−axis (horizontally). The second value of the ordered pair is the y−value. This value moves along the y−axis (vertically). This ordered pair provides the direction of the coordinate.
Let's find the coordinates of the two points on the graph below:
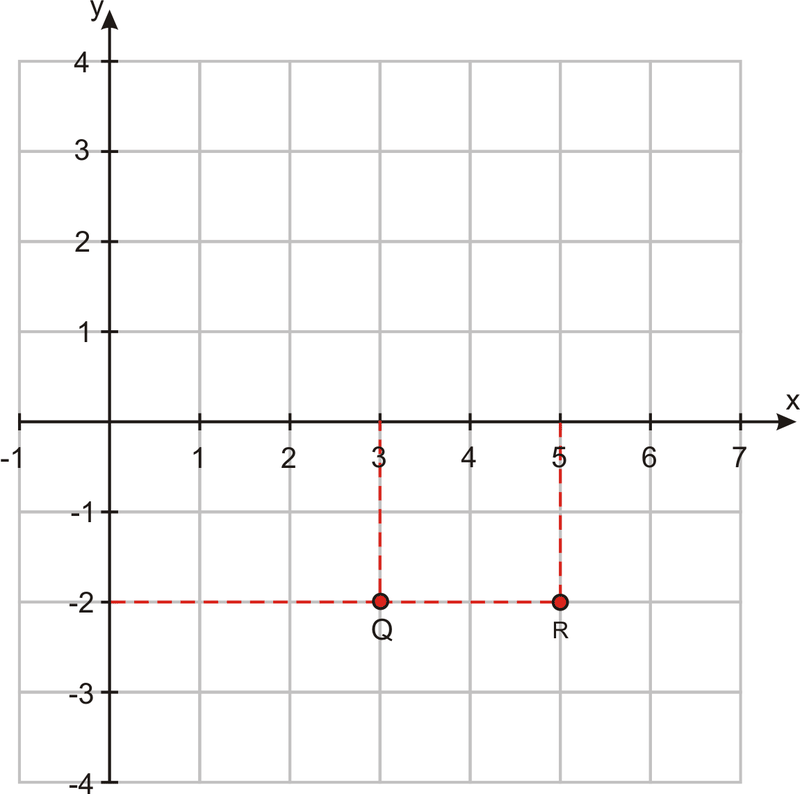
- In order to get to Q, we move three units to the right, in the positive x direction, then two units down, in the negative y direction. The x−coordinate of Q is +3; the y−coordinate of Q is –2.
Q=(3,−2)
- The coordinates of R are found in a similar way. The x−coordinate is +5 (five units in the positive x direction). The y−coordinate is –2 (two units in the negative y direction).
R=(5,−2).
Not all axes will be labeled for you. There will be many times you are required to label your own axes. Some problems may require you to graph only the first quadrant. Others need two or all four quadrants. The tic marks do not always count by ones. They can be marked in increments of 2, 5, or even 12. The axes do not even need to have the same increments. The Cartesian plane below shows an example of this.

The increments by which you count your axes should MAXIMIZE the clarity of the graph.
Domain, Range, and Graphs
Recall the vocabulary words relation, function, domain, and range.
A relation is a set of ordered pairs.
A function is a relation in which every x−coordinate matches with exactly one y−coordinate.
The set of all possible x−coordinates is the domain.
The set of all possible y−coordinates is called the range.
Suppose you kept track of the amount of money you earned for different hours of babysitting. This would be a relation. You can graph the information in this table to visualize the relationship between these two variables.

Hours 4 5 10 12 16 18
Total$ 12 15 30 36 48 54
The domain of the situation would be all positive real numbers. You can babysit for a fractional amount of time but not a negative amount of time. The domain would also be all positive real numbers. You can earn fractional money, but not negative money.
Now, suppose you read a book and can read twenty pages an hour. There is a relationship between how many hours you read and how many pages you read. You may even know that you could write the formula as either:
n=20⋅h n=number of pages;h=time measured in hours. OR...
h=n/20
To graph this relation, you could make a chart. By picking values for the number of hours, you can determine the number of pages read. By graphing these coordinates, you can visualize the relation.
| Hours | Pages |
|---|---|
| 1 | 20 |
| 1.5 | 30 |
| 2 | 40 |
| 3.5 | 70 |
| 5 | 100 |

This relation appears to form a straight line. Therefore, the relationship between the total number of read pages and the number of hours can be called linear. The study of linear relationships is the focus of the next series of lessons.
Examples
Example 4.1.1.1
Earlier, you were told that the doctor keeps data on your resting heart rate in beats per minute. How would you plot the points on a coordinate plane? Could you read a graph of points and determine what your resting heart rate was each year?
Solution
To graph the doctor's data, you would plot the year on the x-axis and your heart rate on the y-axis. The domain would be all positive whole numbers and the range would be all positive numbers. If you were to read a graph with points, you would look for the year on the x-axis and move up to find the y-value which would represent your heart rate for that year.
Example 4.1.1.2
Graph the following points, and give their coordinates:
- 3 to the left, and 5 down.
- 4 up, and 1 to the left.
- 2 to the right, and 2 down.
Solution
The yellow point is the origin, from where you start. Following the instructions, arrive at the red point (-3,-5), blue point (-1,4), and green point (2,-2).

Review
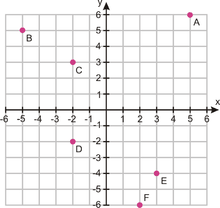
In 1 – 6, identify the coordinates of the given letter.
- D
- A
- F
- E
- B
- C
Graph the following ordered pairs on one Cartesian plane. Identify the quadrant in which each ordered pair is located.
- (4, 2)
- (–3, 5.5)
- (4, –4)
- (–2, –3)
- (1/2,−3/4)
- (–0.75, 1)
- (−2(1/2),−6)
- (1.60, 4.25)
In 15 – 22, using the directions given in each problem, find and graph the coordinates on a Cartesian plane. The directions tell how far the point should be from the origin.
- Six left, four down
- One-half right, one-half up
- Three right, five down
- Nine left, seven up
- Four and one-half left, three up
- Eight right, two up
- One left, one down
- One right, three-quarter down
- Plot the vertices of triangle ABC:(0,0),(4,−3),(6,2).
- The following three points are three vertices of square ABCD. Plot them on a coordinate plane then determine what the coordinates of the fourth point, D, would be. Plot that fourth point and label it. A(−4,−4) B(3,−4) C(3,3)
- Does the ordered pair (2, 0) lie in a quadrant? Explain your thinking.
- Why do you think (0, 0) is called the origin?
- Becky has a large bag of M&Ms that she knows she should share with Jaeyun. Jaeyun has a packet of Starburst candy. Becky tells Jaeyun that for every Starburst he gives her, she will give him three M&Ms in return. If x is the number of Starburst that Jaeyun gives Becky, and yis the number of M&Ms he gets in return, complete each of the following.
- Write an algebraic rule for y in terms of x.
- Make a table of values for y with x values of 0, 1, 2, 3, 4, 5.
- Plot the function linking x and y on the following scale 0≤x≤10,0≤y≤10.
- Consider the rule: y=(1/4)x+8. Make a table. Then graph the relation.
- Ian has the following collection of data. Graph the ordered pairs and make a conclusion from the graph.
| Year | % of Men Employed in the United States |
|---|---|
| 1973 | 75.5 |
| 1980 | 72.0 |
| 1986 | 71.0 |
| 1992 | 69.8 |
| 1997 | 71.3 |
| 2002 | 69.7 |
| 2005 | 69.6 |
| 2007 | 69.8 |
| 2009 | 64.5 |
Review (Answers)
To see the Review answers, open this PDF file and look for section 4.1.
Vocabulary
| Term | Definition |
|---|---|
| graph of a function | The graph of a function is a visual aid showing the relationship between an independent variable and its dependent variable. |
| linear function | A function is linear when its graph appears to form a straight line. |
| range | The set of all possible y−coordinates. |
| relation | A relation is a set of ordered pairs. |
Additional Resources
PLIX: Play, Learn, Interact, eXplore: Plotting Profits
Video:
Activity: Graphs in the Coordinate Plane Discussion Questions
Practice: Graphs in the Coordinate Plane
Real World Application: SF Map