
4.1.5: Graphs on a Coordinate Plane
- Page ID
- 4305
\( \newcommand{\vecs}[1]{\overset { \scriptstyle \rightharpoonup} {\mathbf{#1}} } \)
\( \newcommand{\vecd}[1]{\overset{-\!-\!\rightharpoonup}{\vphantom{a}\smash {#1}}} \)
\( \newcommand{\id}{\mathrm{id}}\) \( \newcommand{\Span}{\mathrm{span}}\)
( \newcommand{\kernel}{\mathrm{null}\,}\) \( \newcommand{\range}{\mathrm{range}\,}\)
\( \newcommand{\RealPart}{\mathrm{Re}}\) \( \newcommand{\ImaginaryPart}{\mathrm{Im}}\)
\( \newcommand{\Argument}{\mathrm{Arg}}\) \( \newcommand{\norm}[1]{\| #1 \|}\)
\( \newcommand{\inner}[2]{\langle #1, #2 \rangle}\)
\( \newcommand{\Span}{\mathrm{span}}\)
\( \newcommand{\id}{\mathrm{id}}\)
\( \newcommand{\Span}{\mathrm{span}}\)
\( \newcommand{\kernel}{\mathrm{null}\,}\)
\( \newcommand{\range}{\mathrm{range}\,}\)
\( \newcommand{\RealPart}{\mathrm{Re}}\)
\( \newcommand{\ImaginaryPart}{\mathrm{Im}}\)
\( \newcommand{\Argument}{\mathrm{Arg}}\)
\( \newcommand{\norm}[1]{\| #1 \|}\)
\( \newcommand{\inner}[2]{\langle #1, #2 \rangle}\)
\( \newcommand{\Span}{\mathrm{span}}\) \( \newcommand{\AA}{\unicode[.8,0]{x212B}}\)
\( \newcommand{\vectorA}[1]{\vec{#1}} % arrow\)
\( \newcommand{\vectorAt}[1]{\vec{\text{#1}}} % arrow\)
\( \newcommand{\vectorB}[1]{\overset { \scriptstyle \rightharpoonup} {\mathbf{#1}} } \)
\( \newcommand{\vectorC}[1]{\textbf{#1}} \)
\( \newcommand{\vectorD}[1]{\overrightarrow{#1}} \)
\( \newcommand{\vectorDt}[1]{\overrightarrow{\text{#1}}} \)
\( \newcommand{\vectE}[1]{\overset{-\!-\!\rightharpoonup}{\vphantom{a}\smash{\mathbf {#1}}}} \)
\( \newcommand{\vecs}[1]{\overset { \scriptstyle \rightharpoonup} {\mathbf{#1}} } \)
\( \newcommand{\vecd}[1]{\overset{-\!-\!\rightharpoonup}{\vphantom{a}\smash {#1}}} \)
\(\newcommand{\avec}{\mathbf a}\) \(\newcommand{\bvec}{\mathbf b}\) \(\newcommand{\cvec}{\mathbf c}\) \(\newcommand{\dvec}{\mathbf d}\) \(\newcommand{\dtil}{\widetilde{\mathbf d}}\) \(\newcommand{\evec}{\mathbf e}\) \(\newcommand{\fvec}{\mathbf f}\) \(\newcommand{\nvec}{\mathbf n}\) \(\newcommand{\pvec}{\mathbf p}\) \(\newcommand{\qvec}{\mathbf q}\) \(\newcommand{\svec}{\mathbf s}\) \(\newcommand{\tvec}{\mathbf t}\) \(\newcommand{\uvec}{\mathbf u}\) \(\newcommand{\vvec}{\mathbf v}\) \(\newcommand{\wvec}{\mathbf w}\) \(\newcommand{\xvec}{\mathbf x}\) \(\newcommand{\yvec}{\mathbf y}\) \(\newcommand{\zvec}{\mathbf z}\) \(\newcommand{\rvec}{\mathbf r}\) \(\newcommand{\mvec}{\mathbf m}\) \(\newcommand{\zerovec}{\mathbf 0}\) \(\newcommand{\onevec}{\mathbf 1}\) \(\newcommand{\real}{\mathbb R}\) \(\newcommand{\twovec}[2]{\left[\begin{array}{r}#1 \\ #2 \end{array}\right]}\) \(\newcommand{\ctwovec}[2]{\left[\begin{array}{c}#1 \\ #2 \end{array}\right]}\) \(\newcommand{\threevec}[3]{\left[\begin{array}{r}#1 \\ #2 \\ #3 \end{array}\right]}\) \(\newcommand{\cthreevec}[3]{\left[\begin{array}{c}#1 \\ #2 \\ #3 \end{array}\right]}\) \(\newcommand{\fourvec}[4]{\left[\begin{array}{r}#1 \\ #2 \\ #3 \\ #4 \end{array}\right]}\) \(\newcommand{\cfourvec}[4]{\left[\begin{array}{c}#1 \\ #2 \\ #3 \\ #4 \end{array}\right]}\) \(\newcommand{\fivevec}[5]{\left[\begin{array}{r}#1 \\ #2 \\ #3 \\ #4 \\ #5 \\ \end{array}\right]}\) \(\newcommand{\cfivevec}[5]{\left[\begin{array}{c}#1 \\ #2 \\ #3 \\ #4 \\ #5 \\ \end{array}\right]}\) \(\newcommand{\mattwo}[4]{\left[\begin{array}{rr}#1 \amp #2 \\ #3 \amp #4 \\ \end{array}\right]}\) \(\newcommand{\laspan}[1]{\text{Span}\{#1\}}\) \(\newcommand{\bcal}{\cal B}\) \(\newcommand{\ccal}{\cal C}\) \(\newcommand{\scal}{\cal S}\) \(\newcommand{\wcal}{\cal W}\) \(\newcommand{\ecal}{\cal E}\) \(\newcommand{\coords}[2]{\left\{#1\right\}_{#2}}\) \(\newcommand{\gray}[1]{\color{gray}{#1}}\) \(\newcommand{\lgray}[1]{\color{lightgray}{#1}}\) \(\newcommand{\rank}{\operatorname{rank}}\) \(\newcommand{\row}{\text{Row}}\) \(\newcommand{\col}{\text{Col}}\) \(\renewcommand{\row}{\text{Row}}\) \(\newcommand{\nul}{\text{Nul}}\) \(\newcommand{\var}{\text{Var}}\) \(\newcommand{\corr}{\text{corr}}\) \(\newcommand{\len}[1]{\left|#1\right|}\) \(\newcommand{\bbar}{\overline{\bvec}}\) \(\newcommand{\bhat}{\widehat{\bvec}}\) \(\newcommand{\bperp}{\bvec^\perp}\) \(\newcommand{\xhat}{\widehat{\xvec}}\) \(\newcommand{\vhat}{\widehat{\vvec}}\) \(\newcommand{\uhat}{\widehat{\uvec}}\) \(\newcommand{\what}{\widehat{\wvec}}\) \(\newcommand{\Sighat}{\widehat{\Sigma}}\) \(\newcommand{\lt}{<}\) \(\newcommand{\gt}{>}\) \(\newcommand{\amp}{&}\) \(\definecolor{fillinmathshade}{gray}{0.9}\)Functions on a Cartesian Plane
Suppose that you have a set of points, where the x-coordinates represent the number of months since you purchased a computer and the y-coordinates represent how much the computer is worth. Would you know how to plot these points on a Cartesian plane? How about if the situation were reversed and you had the plotted points? Could you come up with the coordinates of the points and the function rule that would generate these points?
Functions on a Cartesian Plane
Once a table has been created for a function, the next step is to visualize the relationship by graphing the coordinates of each data point. Data points are formatted as (x,y), where the first coordinate represents the horizontal distance from the origin (remember that the origin is the point where the axes intersect). The second coordinate represents the vertical distance from the origin.

To graph a coordinate point such as (4, 2), we start at the origin.
Because the first coordinate is positive four, we move 4 units to the right.
From this location, since the second coordinate is positive two, we move 2 units up.

Plot the following coordinate points on the Cartesian plane:
- (5, 3)
- (-2, 6)
- (3, -4)
- (-5, -7)
We show all the coordinate points on the same plot.

Notice that:
For a positive x value we move to the right.
For a negative x value we move to the left.
For a positive y value we move up.
For a negative y value we move down.
When referring to a coordinate plane, also called a Cartesian plane, the four sections are called quadrants. The first quadrant is the upper right section, the second quadrant is the upper left, the third quadrant is the lower left and the fourth quadrant is the lower right.

Consider a student named Joseph, who is going to a theme park where each ride costs $2.00. The function that represents the cost of riding r rides is J(r)=2r.
Suppose we wanted to visualize Joseph’s total cost of riding at the amusement park. Using the table below, let's construct the graph of the function such that x is the number of rides and y is the total cost:
| r | J(r)=2r |
|---|---|
| 0 | 2(0)=0 |
| 1 | 2(1)=2 |
| 2 | 2(2)=4 |
| 3 | 2(3)=6 |
| 4 | 2(4)=8 |
| 5 | 2(5)=10 |
| 6 | 2(6)=12 |
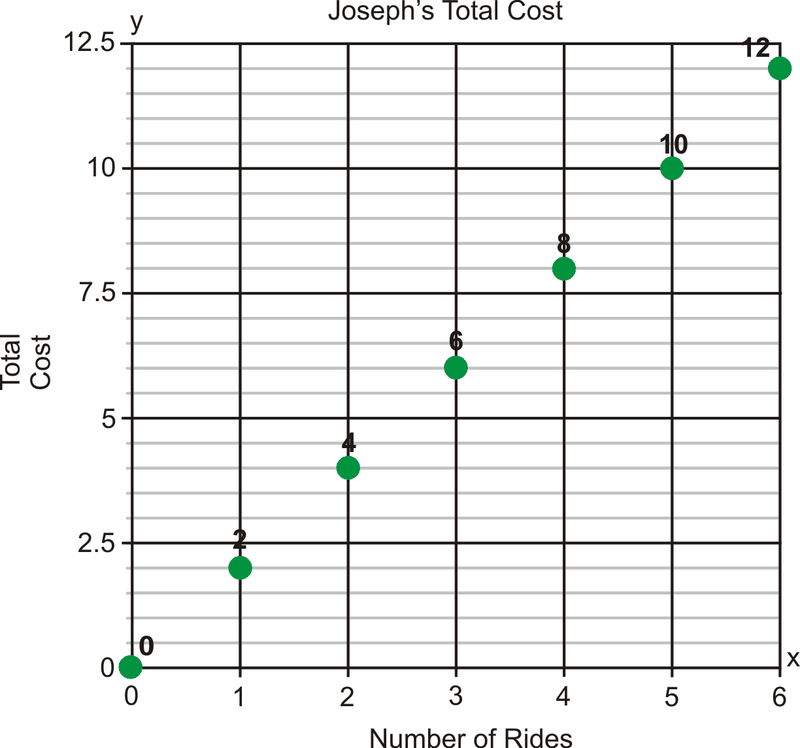
The green dots represent the combination of (r,J(r)). The dots are not connected because the domain of this function is all whole numbers. By connecting the points we are indicating that all values between the ordered pairs are also solutions to this function. Can Joseph ride 212 rides? Of course not! Therefore, we leave this situation as a scatter plot.
Writing a Function Rule Using a Graph
In this course, you will learn to recognize different kinds of functions. There will be specific methods that you can use for each type of function that will help you find the function rule. For now, we will look at some basic examples and find patterns that will help us figure out the relationship between the dependent and independent variables.
The graph below shows the distance that an inchworm covers over time.
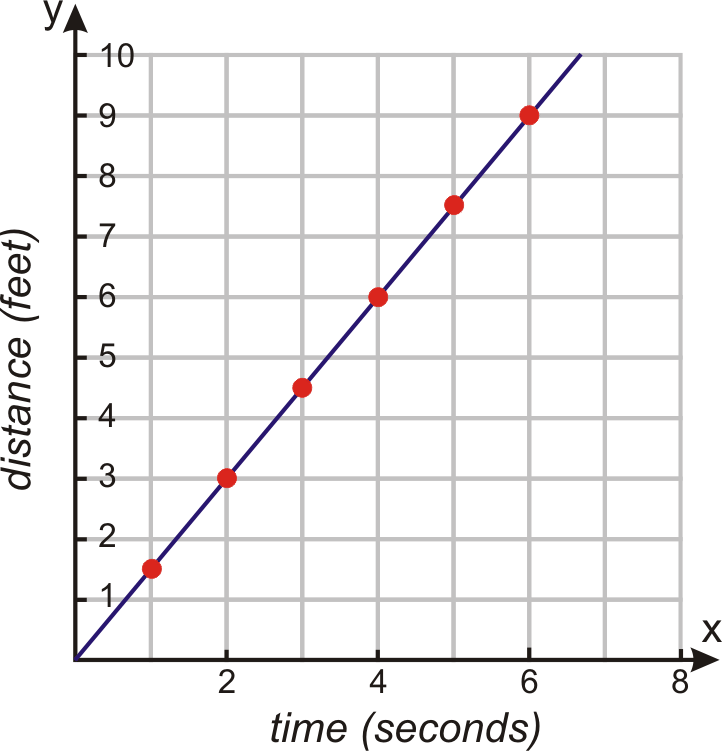
Find the function rule that shows how distance and time are related to each other for the graph above about inchworms:
Make a table of values of several coordinate points to identify a pattern.
Time 0 1 2 3 4 5 6
Distance 0 1.5 3 4.5 6 7.5 9
We can see that for every minute the distance increases by 1.5 feet. We can write the function rule as:
Distance=1.5× time
The equation of the function is f(x)=1.5x.
In many cases, you are given a graph and asked to determine the relationship between the independent and dependent variables. From a graph, you can read pairs of coordinate points that are on the curve of the function. The coordinate points give values of dependent and independent variables. These variables are related to each other by a rule. It is important we make sure this rule works for all the points on the curve. Finding a function rule for real-world data allows you to make predictions about what may happen.
Analyze the Graph of a Real-World Situation
Graphs are used to represent data in all areas of life. You can find graphs in newspapers, political campaigns, science journals, and business presentations.
For example, most mainstream scientists believe that increased emissions of greenhouse gases, particularly carbon dioxide, are contributing to the warming of the planet. The graph below illustrates how carbon dioxide levels have increased as the world has industrialized.
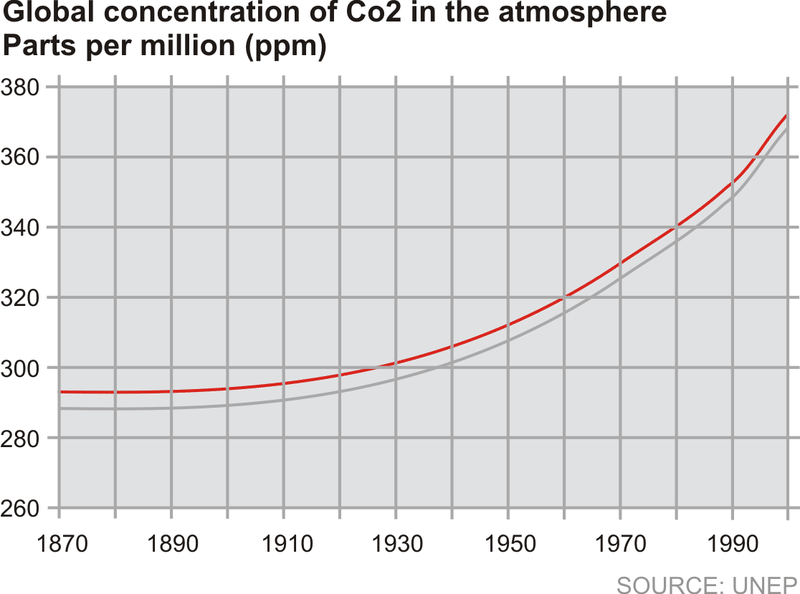
From this graph, we can find the concentration of carbon dioxide found in the atmosphere in different years.
1900 - 285 parts per million
1930 - 300 parts per million
1950 - 310 parts per million
1990 - 350 parts per million
Examples
Example 4.1.5.1
Earlier, you were told that you have a set of points where the x-coordinates represent the number of months since you purchased a computer and the y-coordinates represent how much the computer is worth. How do you plot these points on a cartesian plane? Could you come up with the coordinates of the points and the function rule that would generate these points if you were just given the plotted points?
Solution
To plot the given points on a Cartesian plane, remember that first coordinate represents the horizontal distance from the origin and the second coordinate represents the vertical distance from the origin. If the first coordinate is positive, move right the appropriate amount of units and if it is negative, move left the appropriate amount of units. From that point, if the second coordinate is positive move up the appropriate amount of coordinates or if it is negative, move down the appropriate amount of coordinates.
To create a function rule from a graph of points, the first step is to put the data in a table so that it is easier to see the patterns. Then, find the pattern and describe the relationship in function form as in the inchworm problem above.
Example 4.1.5.2
Graph the function that has the following table of values. Find the function rule.
0 1 2 3 4
0 1 4 9 16
Solution
The table gives us five sets of coordinate points:
(0, 0), (1, 1), (2, 4), (3, 9), (4, 16).
To graph the function, we plot all the coordinate points. We observe that the pattern is that the dependent values are the squares of the independent values.
Because squaring numbers will always result in a positive output, and squaring a fraction results in a fraction, the domain of this function is all positive real numbers, or x≥0. This means the ordered pairs can be connected with a smooth curve. This curve will continue forever in the positive direction, shown by an arrow.
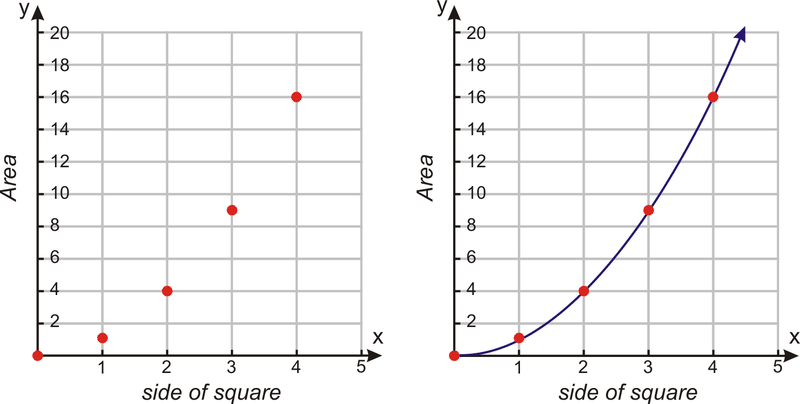
Since the dependent values are the squares of the independent values, the function rule is f(x)=x2.
Review
In 1–5, plot the coordinate points on the Cartesian plane.
- (4, –4)
- (2, 7)
- (–3, –5)
- (6, 3)
- (–4, 3)
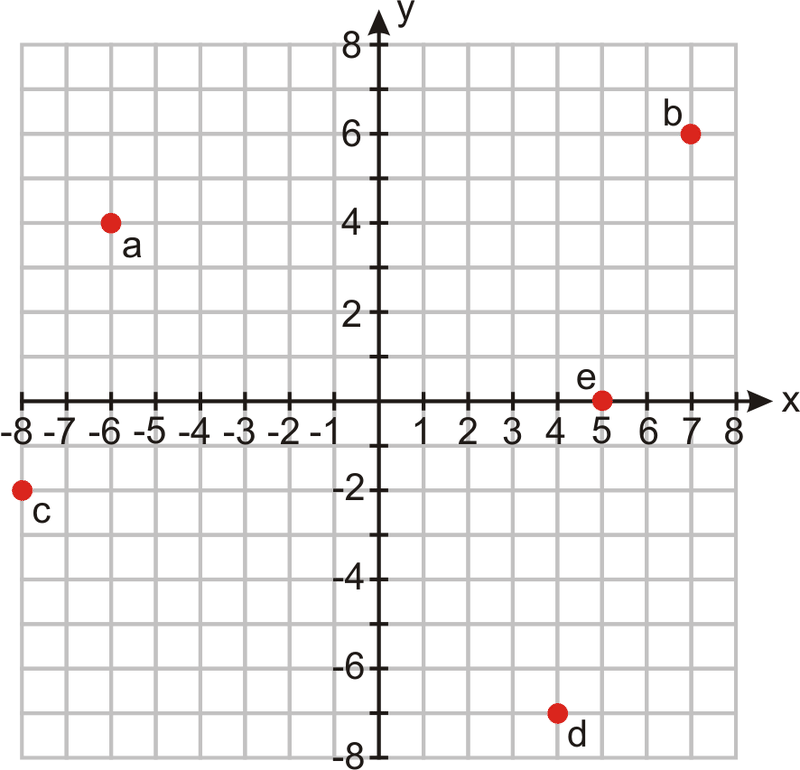
6. Using the coordinate plane below, give the coordinates for a – e.
In 7–9, graph the relation on a coordinate plane. According to the situation, determine whether to connect the ordered pairs with a smooth curve or leave the graph as a scatter plot.
x -10 -5 0 5 10
y -3 -0.5 2 4.5 7
7.
| Side of cube (in inches) | Volume of cube (in inches3) |
|---|---|
| 0 | 0 |
| 1 | 1 |
| 2 | 8 |
| 3 | 27 |
| 4 | 64 |
8.
| Time (in hours) | Distance (in miles) |
|---|---|
| –2 | –50 |
| –1 | 25 |
| 0 | 0 |
| 1 | 5 |
| 2 | 50 |
In 9-11, graph the function.
9.Brandon is a member of a movie club. He pays a $50 annual membership and $8 per movie.
10.f(x)=(x−2)2
11.f(x)=3.2x
- The students at a local high school took the Youth Risk Behavior Survey. The graph below shows the percentage of high school students who reported that they were current smokers. A person qualifies as a current smoker if he/she has smoked one or more cigarettes in the past 30 days. What percentage of high school students were current smokers in the following years?
- 1991
- 1996
- 2004
- 2005

- The graph below shows the average lifespan of people based on the year in which they were born. This information comes from the National Vital Statistics Report from the Center for Disease Control. What is the average lifespan of a person born in the following years?
- 1940
- 1955
- 1980
- 1995

- The graph below shows the median income of an individual based on his/her number of years of education. The top curve shows the median income for males and the bottom curve shows the median income for females (Source: US Census, 2003). What is the median income for the following people:
- Male, 10 years of education
- Male, 17 years of education
- Female, 10 years of education
- Female, 17 years of education

Review (Answers)
To see the Review answers, open this PDF file and look for section 1.13.
Vocabulary
| Term | Definition |
|---|---|
| quadrant | A quadrant is one-fourth of the coordinate plane. The four quadrants are numbered using Roman Numerals I, II, III, and IV, starting in the top-right, and increasing counter-clockwise. |
| Cartesian Plane | The Cartesian plane is a grid formed by a horizontal number line and a vertical number line that cross at the (0, 0) point, called the origin. |
| Coordinate Plane | The coordinate plane is a grid formed by a horizontal number line and a vertical number line that cross at the (0, 0) point, called the origin. The coordinate plane is also called a Cartesian Plane. |
| Function | A function is a relation where there is only one output for every input. In other words, for every value of x, there is only one value for y. |
Additional Resources
PLIX: Play, Learn, Interact, eXplore: Functions on a Cartesian Plane
Video: Plotting Points in the Cartesian Plane - Example 3
Activity: Functions on a Cartesian Plane Discussion Questions
Practice: Graphs on a Coordinate Plane
Real World Application: Nike