
2.2.3: Graphing Calculator to Analyze Polynomial Functions
- Page ID
- 14194
\( \newcommand{\vecs}[1]{\overset { \scriptstyle \rightharpoonup} {\mathbf{#1}} } \)
\( \newcommand{\vecd}[1]{\overset{-\!-\!\rightharpoonup}{\vphantom{a}\smash {#1}}} \)
\( \newcommand{\dsum}{\displaystyle\sum\limits} \)
\( \newcommand{\dint}{\displaystyle\int\limits} \)
\( \newcommand{\dlim}{\displaystyle\lim\limits} \)
\( \newcommand{\id}{\mathrm{id}}\) \( \newcommand{\Span}{\mathrm{span}}\)
( \newcommand{\kernel}{\mathrm{null}\,}\) \( \newcommand{\range}{\mathrm{range}\,}\)
\( \newcommand{\RealPart}{\mathrm{Re}}\) \( \newcommand{\ImaginaryPart}{\mathrm{Im}}\)
\( \newcommand{\Argument}{\mathrm{Arg}}\) \( \newcommand{\norm}[1]{\| #1 \|}\)
\( \newcommand{\inner}[2]{\langle #1, #2 \rangle}\)
\( \newcommand{\Span}{\mathrm{span}}\)
\( \newcommand{\id}{\mathrm{id}}\)
\( \newcommand{\Span}{\mathrm{span}}\)
\( \newcommand{\kernel}{\mathrm{null}\,}\)
\( \newcommand{\range}{\mathrm{range}\,}\)
\( \newcommand{\RealPart}{\mathrm{Re}}\)
\( \newcommand{\ImaginaryPart}{\mathrm{Im}}\)
\( \newcommand{\Argument}{\mathrm{Arg}}\)
\( \newcommand{\norm}[1]{\| #1 \|}\)
\( \newcommand{\inner}[2]{\langle #1, #2 \rangle}\)
\( \newcommand{\Span}{\mathrm{span}}\) \( \newcommand{\AA}{\unicode[.8,0]{x212B}}\)
\( \newcommand{\vectorA}[1]{\vec{#1}} % arrow\)
\( \newcommand{\vectorAt}[1]{\vec{\text{#1}}} % arrow\)
\( \newcommand{\vectorB}[1]{\overset { \scriptstyle \rightharpoonup} {\mathbf{#1}} } \)
\( \newcommand{\vectorC}[1]{\textbf{#1}} \)
\( \newcommand{\vectorD}[1]{\overrightarrow{#1}} \)
\( \newcommand{\vectorDt}[1]{\overrightarrow{\text{#1}}} \)
\( \newcommand{\vectE}[1]{\overset{-\!-\!\rightharpoonup}{\vphantom{a}\smash{\mathbf {#1}}}} \)
\( \newcommand{\vecs}[1]{\overset { \scriptstyle \rightharpoonup} {\mathbf{#1}} } \)
\(\newcommand{\longvect}{\overrightarrow}\)
\( \newcommand{\vecd}[1]{\overset{-\!-\!\rightharpoonup}{\vphantom{a}\smash {#1}}} \)
\(\newcommand{\avec}{\mathbf a}\) \(\newcommand{\bvec}{\mathbf b}\) \(\newcommand{\cvec}{\mathbf c}\) \(\newcommand{\dvec}{\mathbf d}\) \(\newcommand{\dtil}{\widetilde{\mathbf d}}\) \(\newcommand{\evec}{\mathbf e}\) \(\newcommand{\fvec}{\mathbf f}\) \(\newcommand{\nvec}{\mathbf n}\) \(\newcommand{\pvec}{\mathbf p}\) \(\newcommand{\qvec}{\mathbf q}\) \(\newcommand{\svec}{\mathbf s}\) \(\newcommand{\tvec}{\mathbf t}\) \(\newcommand{\uvec}{\mathbf u}\) \(\newcommand{\vvec}{\mathbf v}\) \(\newcommand{\wvec}{\mathbf w}\) \(\newcommand{\xvec}{\mathbf x}\) \(\newcommand{\yvec}{\mathbf y}\) \(\newcommand{\zvec}{\mathbf z}\) \(\newcommand{\rvec}{\mathbf r}\) \(\newcommand{\mvec}{\mathbf m}\) \(\newcommand{\zerovec}{\mathbf 0}\) \(\newcommand{\onevec}{\mathbf 1}\) \(\newcommand{\real}{\mathbb R}\) \(\newcommand{\twovec}[2]{\left[\begin{array}{r}#1 \\ #2 \end{array}\right]}\) \(\newcommand{\ctwovec}[2]{\left[\begin{array}{c}#1 \\ #2 \end{array}\right]}\) \(\newcommand{\threevec}[3]{\left[\begin{array}{r}#1 \\ #2 \\ #3 \end{array}\right]}\) \(\newcommand{\cthreevec}[3]{\left[\begin{array}{c}#1 \\ #2 \\ #3 \end{array}\right]}\) \(\newcommand{\fourvec}[4]{\left[\begin{array}{r}#1 \\ #2 \\ #3 \\ #4 \end{array}\right]}\) \(\newcommand{\cfourvec}[4]{\left[\begin{array}{c}#1 \\ #2 \\ #3 \\ #4 \end{array}\right]}\) \(\newcommand{\fivevec}[5]{\left[\begin{array}{r}#1 \\ #2 \\ #3 \\ #4 \\ #5 \\ \end{array}\right]}\) \(\newcommand{\cfivevec}[5]{\left[\begin{array}{c}#1 \\ #2 \\ #3 \\ #4 \\ #5 \\ \end{array}\right]}\) \(\newcommand{\mattwo}[4]{\left[\begin{array}{rr}#1 \amp #2 \\ #3 \amp #4 \\ \end{array}\right]}\) \(\newcommand{\laspan}[1]{\text{Span}\{#1\}}\) \(\newcommand{\bcal}{\cal B}\) \(\newcommand{\ccal}{\cal C}\) \(\newcommand{\scal}{\cal S}\) \(\newcommand{\wcal}{\cal W}\) \(\newcommand{\ecal}{\cal E}\) \(\newcommand{\coords}[2]{\left\{#1\right\}_{#2}}\) \(\newcommand{\gray}[1]{\color{gray}{#1}}\) \(\newcommand{\lgray}[1]{\color{lightgray}{#1}}\) \(\newcommand{\rank}{\operatorname{rank}}\) \(\newcommand{\row}{\text{Row}}\) \(\newcommand{\col}{\text{Col}}\) \(\renewcommand{\row}{\text{Row}}\) \(\newcommand{\nul}{\text{Nul}}\) \(\newcommand{\var}{\text{Var}}\) \(\newcommand{\corr}{\text{corr}}\) \(\newcommand{\len}[1]{\left|#1\right|}\) \(\newcommand{\bbar}{\overline{\bvec}}\) \(\newcommand{\bhat}{\widehat{\bvec}}\) \(\newcommand{\bperp}{\bvec^\perp}\) \(\newcommand{\xhat}{\widehat{\xvec}}\) \(\newcommand{\vhat}{\widehat{\vvec}}\) \(\newcommand{\uhat}{\widehat{\uvec}}\) \(\newcommand{\what}{\widehat{\wvec}}\) \(\newcommand{\Sighat}{\widehat{\Sigma}}\) \(\newcommand{\lt}{<}\) \(\newcommand{\gt}{>}\) \(\newcommand{\amp}{&}\) \(\definecolor{fillinmathshade}{gray}{0.9}\)Graphing Polynomial Functions with a Graphing Calculator
To make a fair race between a dragster and a funny car, a scientist devised the following polynomial equation:
f(x)=71.682x−60.427x2+84.710x3−27.769x4+4.296x5−0.262x6. What is the maximum point of this function's graph?
Source: Rice University
Graphing Polynomial Functions with a Calculator
You have already used the graphing calculator to graph parabolas. Now, we will expand upon that knowledge and graph higher-degree polynomials. Then, we will use the graphing calculator to find the zeros, maximums and minimums.
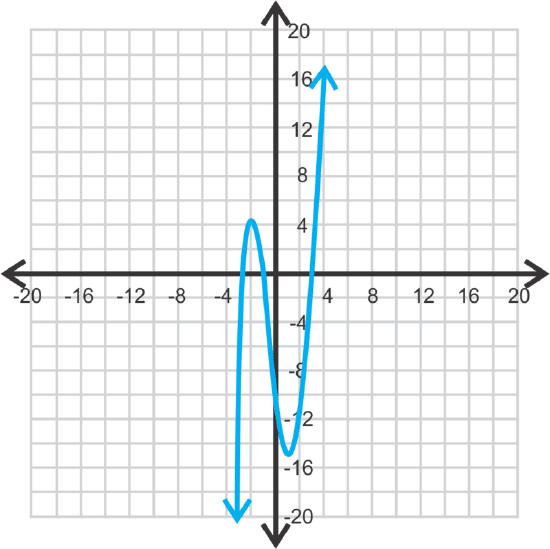
Let's graph f(x)=x3+x2−8x−8 using a graphing calculator.
These instructions are for a TI-83 or 84. First, press Y=. If there are any functions in this window, clear them out by highlighting the = sign and pressing ENTER. Now, in Y1, enter in the polynomial. It should look like: x∧3+x∧2−8x−8. Press GRAPH.
To adjust the window, press ZOOM. To get the typical -10 to 10 screen (for both axes), press 6:ZStandard. To zoom out, press ZOOM, 3:ZoomOut, ENTER, ENTER. For this particular function, the window needs to go from -15 to 15 for both x and y. To manually input the window, press WINDOW and change the Xmin,Xmax,Ymin, and Ymax so that you can see the zeros, minimum and maximum. Your graph should look like the one above.
Now, let's find the zeros, maximum, and minimum of the function from the previous problem above.
To find the zeros, press 2nd TRACE to get the CALC menu. Select 2:Zero and you will be asked “Left Bound?” by the calculator. Move the cursor (by pressing the ↑ or ↓) so that it is just to the left of one zero. Press ENTER. Then, it will ask “Right Bound?” Move the cursor just to the right of that zero. Press ENTER. The calculator will then ask “Guess?” At this point, you can enter in what you think the zero is and press ENTER again. Then the calculator will give you the exact zero. For the graph from the previous problem above, you will need to repeat this three times. The zeros are -2.83, -1, and 2.83.
To find the minimum and maximum, the process is almost identical to finding zeros. Instead of selecting 2:Zero, select 3:min or 4:max. The minimum is (1.33, -14.52) and the maximum is (-2, 4).
Finally, let's find the y−intercept of the graph from the same problem above.
If you decide not to use the calculator, plug in zero for x and solve for y.
f(0)=03+02−8⋅0−8
Using the graphing calculator, press 2nd TRACE to get the CALC menu. Select 1:value. X= shows up at the bottom of the screen. If there is a value there, press CLEAR to remove it. Then press 0 and ENTER. The calculator should then say “Y=−8.”
Examples
Earlier, you were asked to find the maximum point of the function's graph.
Solution
If you plug the equation f(x)=71.682x−60.427x2+84.710x3−27.769x4+4.296x5−0.262x6 into your calculator, you find that the maximum occurs when x=6.15105. At that value of x, f(x) equals 1754.43. Therefore the maximum point of the function's graph is (6.15105, 1754.43).
Graph and find the critical values of the following functions.
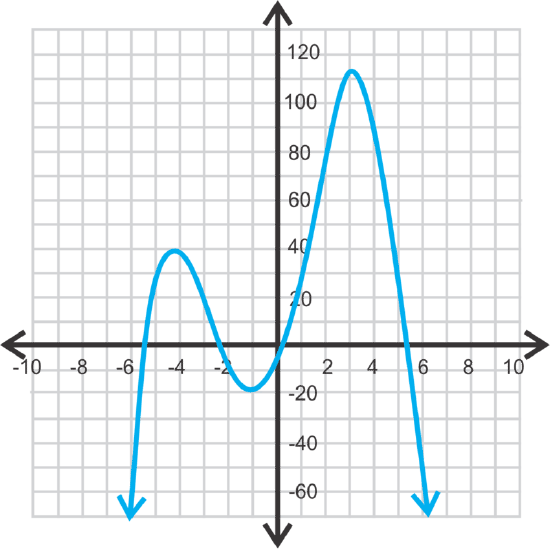
f(x)=-\(\ 1\over 3 \)x4−x3+10x2+25x−4
Solution
zeros: -5.874, -2.56, 0.151, 5.283
y−intercept: (0, -4)
minimum: (-1.15, -18.59)
local maximum: (-4.62, 40.69)
absolute maximum: (3.52, 113.12)
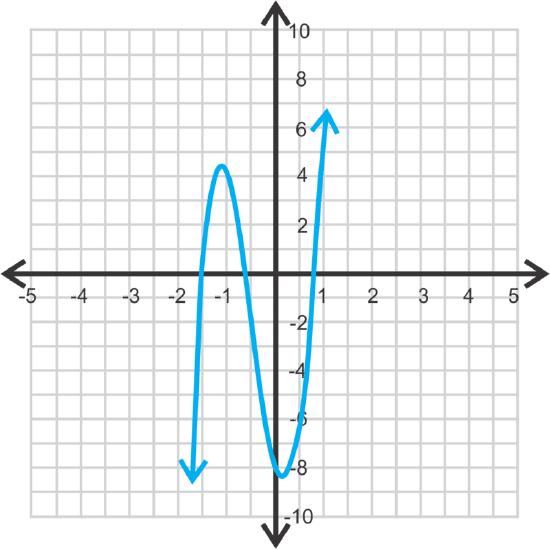
g(x)=2x5−x4+6x3+18x2−3x−8
Solution
zeros: -1.413, -0.682, 0.672
y−intercept: (0, -8)
minimum: (-1.11, 4.41)
maximum: (0.08, -8.12)
Find the domain and range of Examples 2 and 3.
Solution
The domain of Example 2 is all real numbers and the range is all real numbers less than the maximum; (−∞,113.12]. The domain and range of Example 3 are all real numbers.
Review
Graph questions 1-6 on your graphing calculator. Sketch the graph in an appropriate window. Then, find all the critical values, domain, range, and describe the end behavior.
- f(x)=2x3+5x2−4x−12
- h(x)=−\(\ 1\over 4 \)x4−2x3−\(\ 13\over 4 \)x2−8x−9
- y=x3−8
- g(x)=−x3−11x2−14x+10
- f(x)=2x4+3x3−26x2−3x+54
- y=x4+2x3−5x2−12x−6
- What are the types of solutions in #2?
- Find the two imaginary solutions in #3.
- Find the exact values of the irrational roots in #5.
Determine if the following statements are SOMETIMES, ALWAYS, or NEVER true. Explain your reasoning.
- The range of an even function is (−∞,max], where max is the maximum of the function.
- The domain and range of all odd functions are all real numbers.
- A function can have exactly three imaginary solutions.
- An nth degree polynomial has n real solutions.
- The parent graph of any polynomial function has one zero.
- Challenge The exact value for one of the zeros in #2 is −4+\(\ \sqrt{7}\). What is the exact value of the other root? Then, use this information to find the imaginary roots.
Answers for Review Problems
To see the Review answers, open this PDF file and look for section 6.14.
Vocabulary
| Term | Definition |
|---|---|
| Roots | The roots of a function are the values of x that make y equal to zero. |