
1.1: Graphs for Discrete and for Continuous Data
- Page ID
- 5691
\( \newcommand{\vecs}[1]{\overset { \scriptstyle \rightharpoonup} {\mathbf{#1}} } \)
\( \newcommand{\vecd}[1]{\overset{-\!-\!\rightharpoonup}{\vphantom{a}\smash {#1}}} \)
\( \newcommand{\id}{\mathrm{id}}\) \( \newcommand{\Span}{\mathrm{span}}\)
( \newcommand{\kernel}{\mathrm{null}\,}\) \( \newcommand{\range}{\mathrm{range}\,}\)
\( \newcommand{\RealPart}{\mathrm{Re}}\) \( \newcommand{\ImaginaryPart}{\mathrm{Im}}\)
\( \newcommand{\Argument}{\mathrm{Arg}}\) \( \newcommand{\norm}[1]{\| #1 \|}\)
\( \newcommand{\inner}[2]{\langle #1, #2 \rangle}\)
\( \newcommand{\Span}{\mathrm{span}}\)
\( \newcommand{\id}{\mathrm{id}}\)
\( \newcommand{\Span}{\mathrm{span}}\)
\( \newcommand{\kernel}{\mathrm{null}\,}\)
\( \newcommand{\range}{\mathrm{range}\,}\)
\( \newcommand{\RealPart}{\mathrm{Re}}\)
\( \newcommand{\ImaginaryPart}{\mathrm{Im}}\)
\( \newcommand{\Argument}{\mathrm{Arg}}\)
\( \newcommand{\norm}[1]{\| #1 \|}\)
\( \newcommand{\inner}[2]{\langle #1, #2 \rangle}\)
\( \newcommand{\Span}{\mathrm{span}}\) \( \newcommand{\AA}{\unicode[.8,0]{x212B}}\)
\( \newcommand{\vectorA}[1]{\vec{#1}} % arrow\)
\( \newcommand{\vectorAt}[1]{\vec{\text{#1}}} % arrow\)
\( \newcommand{\vectorB}[1]{\overset { \scriptstyle \rightharpoonup} {\mathbf{#1}} } \)
\( \newcommand{\vectorC}[1]{\textbf{#1}} \)
\( \newcommand{\vectorD}[1]{\overrightarrow{#1}} \)
\( \newcommand{\vectorDt}[1]{\overrightarrow{\text{#1}}} \)
\( \newcommand{\vectE}[1]{\overset{-\!-\!\rightharpoonup}{\vphantom{a}\smash{\mathbf {#1}}}} \)
\( \newcommand{\vecs}[1]{\overset { \scriptstyle \rightharpoonup} {\mathbf{#1}} } \)
\( \newcommand{\vecd}[1]{\overset{-\!-\!\rightharpoonup}{\vphantom{a}\smash {#1}}} \)
\(\newcommand{\avec}{\mathbf a}\) \(\newcommand{\bvec}{\mathbf b}\) \(\newcommand{\cvec}{\mathbf c}\) \(\newcommand{\dvec}{\mathbf d}\) \(\newcommand{\dtil}{\widetilde{\mathbf d}}\) \(\newcommand{\evec}{\mathbf e}\) \(\newcommand{\fvec}{\mathbf f}\) \(\newcommand{\nvec}{\mathbf n}\) \(\newcommand{\pvec}{\mathbf p}\) \(\newcommand{\qvec}{\mathbf q}\) \(\newcommand{\svec}{\mathbf s}\) \(\newcommand{\tvec}{\mathbf t}\) \(\newcommand{\uvec}{\mathbf u}\) \(\newcommand{\vvec}{\mathbf v}\) \(\newcommand{\wvec}{\mathbf w}\) \(\newcommand{\xvec}{\mathbf x}\) \(\newcommand{\yvec}{\mathbf y}\) \(\newcommand{\zvec}{\mathbf z}\) \(\newcommand{\rvec}{\mathbf r}\) \(\newcommand{\mvec}{\mathbf m}\) \(\newcommand{\zerovec}{\mathbf 0}\) \(\newcommand{\onevec}{\mathbf 1}\) \(\newcommand{\real}{\mathbb R}\) \(\newcommand{\twovec}[2]{\left[\begin{array}{r}#1 \\ #2 \end{array}\right]}\) \(\newcommand{\ctwovec}[2]{\left[\begin{array}{c}#1 \\ #2 \end{array}\right]}\) \(\newcommand{\threevec}[3]{\left[\begin{array}{r}#1 \\ #2 \\ #3 \end{array}\right]}\) \(\newcommand{\cthreevec}[3]{\left[\begin{array}{c}#1 \\ #2 \\ #3 \end{array}\right]}\) \(\newcommand{\fourvec}[4]{\left[\begin{array}{r}#1 \\ #2 \\ #3 \\ #4 \end{array}\right]}\) \(\newcommand{\cfourvec}[4]{\left[\begin{array}{c}#1 \\ #2 \\ #3 \\ #4 \end{array}\right]}\) \(\newcommand{\fivevec}[5]{\left[\begin{array}{r}#1 \\ #2 \\ #3 \\ #4 \\ #5 \\ \end{array}\right]}\) \(\newcommand{\cfivevec}[5]{\left[\begin{array}{c}#1 \\ #2 \\ #3 \\ #4 \\ #5 \\ \end{array}\right]}\) \(\newcommand{\mattwo}[4]{\left[\begin{array}{rr}#1 \amp #2 \\ #3 \amp #4 \\ \end{array}\right]}\) \(\newcommand{\laspan}[1]{\text{Span}\{#1\}}\) \(\newcommand{\bcal}{\cal B}\) \(\newcommand{\ccal}{\cal C}\) \(\newcommand{\scal}{\cal S}\) \(\newcommand{\wcal}{\cal W}\) \(\newcommand{\ecal}{\cal E}\) \(\newcommand{\coords}[2]{\left\{#1\right\}_{#2}}\) \(\newcommand{\gray}[1]{\color{gray}{#1}}\) \(\newcommand{\lgray}[1]{\color{lightgray}{#1}}\) \(\newcommand{\rank}{\operatorname{rank}}\) \(\newcommand{\row}{\text{Row}}\) \(\newcommand{\col}{\text{Col}}\) \(\renewcommand{\row}{\text{Row}}\) \(\newcommand{\nul}{\text{Nul}}\) \(\newcommand{\var}{\text{Var}}\) \(\newcommand{\corr}{\text{corr}}\) \(\newcommand{\len}[1]{\left|#1\right|}\) \(\newcommand{\bbar}{\overline{\bvec}}\) \(\newcommand{\bhat}{\widehat{\bvec}}\) \(\newcommand{\bperp}{\bvec^\perp}\) \(\newcommand{\xhat}{\widehat{\xvec}}\) \(\newcommand{\vhat}{\widehat{\vvec}}\) \(\newcommand{\uhat}{\widehat{\uvec}}\) \(\newcommand{\what}{\widehat{\wvec}}\) \(\newcommand{\Sighat}{\widehat{\Sigma}}\) \(\newcommand{\lt}{<}\) \(\newcommand{\gt}{>}\) \(\newcommand{\amp}{&}\) \(\definecolor{fillinmathshade}{gray}{0.9}\)Basic Graph Types
In previous sections, you learned about discrete and continuous data and were introduced to categorical and numerical forms of displaying data. In later sections, you will learn how to display discrete and continuous data in both categorical and numerical displays, but in a way that allows you to compare sets of data. However, as a review, let's first go through the following examples.
Identifying Discrete and Continuous Data
Which of the following graphs represents discrete data? Which represents continuous data?
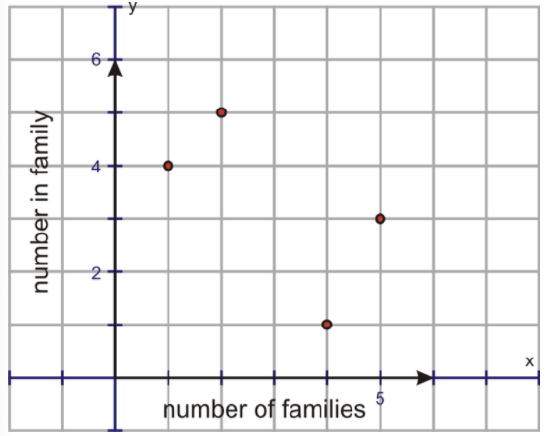

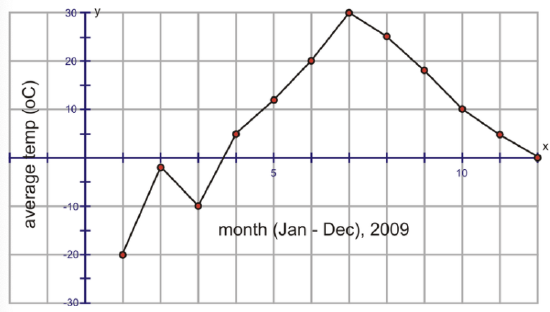
Remember that discrete data is represented by exact values that result from counting, as in the number of people in the households in your neighborhood. Continuous data is represented by a range of data that results from measuring. For example, taking the average temperatures for each month during a year is an example of continuous data. Also remember from an earlier Concept how you distinguished between these types of data when you graphed them.
The first graph shows discrete data. Remember that you know this because the data points are not joined. The second graph represents the average temperatures during the months in 2009. This data is continuous. You can easily tell this by looking at the graph and seeing the data points connected together.
Recognizing the Type of Data Graphs Represent
1. Which of the following graphs represent categorical, or qualitative, data? Which represent numerical, or quantitative, data?

2 newer terms used are the categorical and numerical data forms. Categorical data forms are just what the term suggests. These are data forms that are in categories and describe characteristics, or qualities, of a category. These data forms are more qualitative data and, therefore, are less numerical than they are descriptive. Graphs such as pie charts and bar graphs show descriptive data, or qualitative data. The top 2 graphs are examples of categorical data represented in these types of graphs.
Numerical data is quantitative data. Numerical data involves measuring or counting a numerical value. Therefore, when you talk about discrete and continuous data, you are talking about numerical data. Line graphs, frequency polygons, histograms, and stem-and-leaf plots all involve numerical data, or quantitative data, as is shown in the remaining graphs.
2. Does the following graph represent categorical or numerical data? Is the data discrete or continuous?
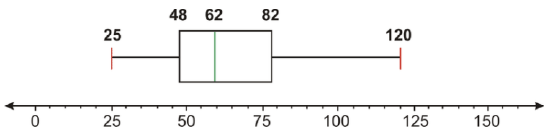
Box-and-whisker plots are considered numerical displays of data, as they are based on quantitative data (the mean and median), as well as the maximum (upper) and minimum (lower) values found in the data. Also, since a box-and-whisker plot analyzes individual data points, we know that the data must be discrete, and not continuous.
You will spend the next several sections learning about how to compare sets of categorical and numerical data, including data that is both discrete and continuous.
Points to Consider
- What is the difference between categorical and numerical data, and how does this relate to qualitative and quantitative data?
-->
Examples
Give a graphical example of each of the following types of data. There are many possible examples, but one example for each type of data is shown below:
Example 1
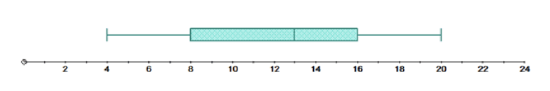
Discrete data
The graph shown above is a box-and-whisker plot. Remember that to create a box-and-whisker plot, you put the data in order and find the minimum, first quartile, median, third quartile, and maximum of the data set. Since a box-and-whisker plot analyzes individual data points to find these values, it represents discrete data.
Example 2
Continuous data
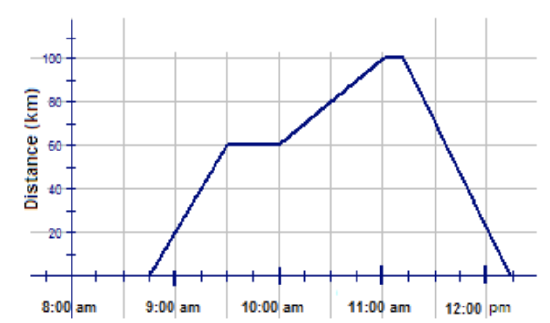
The graph shown above is a broken-line graph. As you can see from the graph, there is no break in the line. In other words, you can choose any time between 8:45 am and 12:15 pm, even one involving a fraction of a second, and there will be a corresponding distance in km. Therefore, this broken line graph represents continuous data.
Example 3
Numerical, or quantitative, data
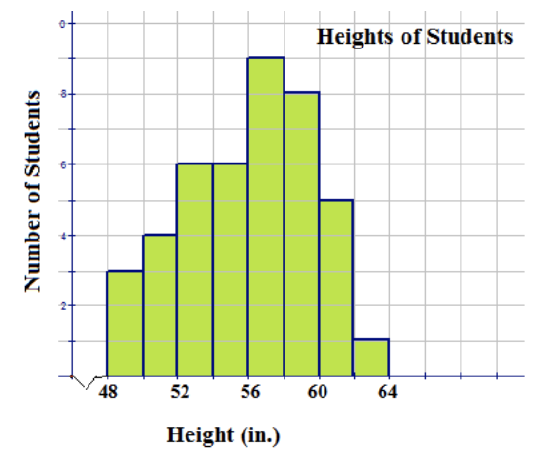
The graph shown above is a histogram. The horizontal axis of the histogram represents the heights of students in inches. This means that the data being counted by the histogram are numbers, so the histogram represents numerical, or quantitative, data.
Example 4
Categorical, or qualitative, data
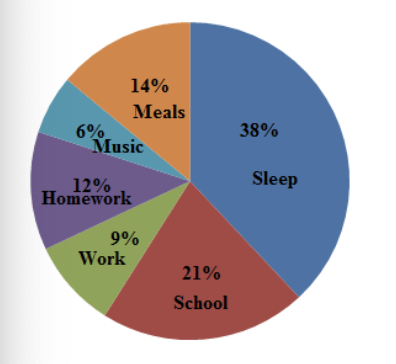
The graph shown above is a pie chart. The slices of the pie represents homework, music, meals, sleep, school, and work, respectively. In other words, the data that the slices of the pie stand for are not numbers. Therefore, the pie chart represents categorical, or quantitative, data.
Vocabulary
| Term | Definition |
|---|---|
| numerical data | Numerical data is data that involves measuring or counting numbers. |
| qualitative data | Qualitative data is descriptive data or data that involves categories. |
| quantitative data | Quantitative data is numerical data or data that is in the form of numbers. |
| categorical data | Categorical data are data forms that are in categories and describe characteristics, or qualities, of a category. |
Review
- In the table below, match the following types of graphs with the types of variables used to create the graphs.
| Type of Graph | Type of Variable |
|---|---|
| a. Histogram | _____ discrete |
| b. Stem-and-leaf plot | _____ discrete |
| c. Broken-line graph | _____ discrete |
| d. Bar graph | _____ continuous |
| e. Pie chart | _____ continuous |
- In the table below, match the following types of graphs with the types of variables used to create the graphs.
| Type of Graph | Type of Variable |
|---|---|
| a. Broken-line graph | _____ qualitative |
| b. Bar graph | _____ numerical |
| c. Pie chart | _____ categorical |
| d. Stem-and-leaf plot | _____ quantitative |
| e. Histogram | _____ numerical |
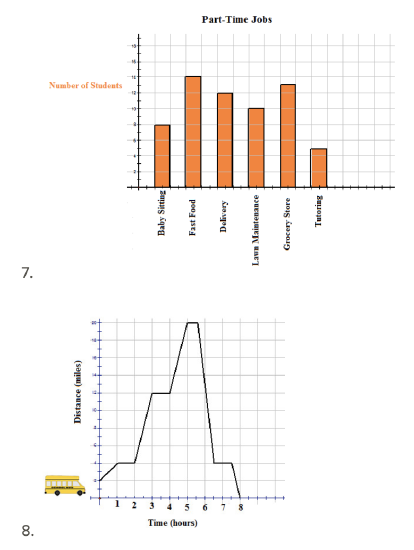
Determine if each of the following graphs represents discrete or continuous data.
USGS, earthquake.usgs.gov/earthquak...troller-40240/
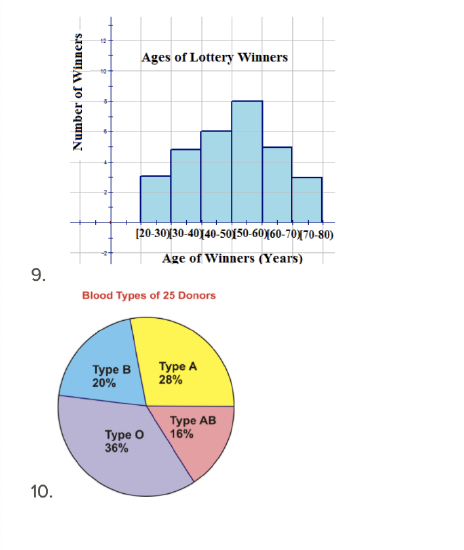
Determine if each of the following graphs represents numerical (quantitative) data or categorical (qualitative) data.
USGS - earthquake.usgs.gov/earthquak...ear/graphs.php
Additional Resources
PLIX: Play, Learn, Interact, Experience for Discrete vs. Continuous Data.
A list of student-submitted discussion questions for Basic Graph Types for Basic Graph Types Discussion Questions.
Lesson plans for Review of Basic Graph Types Lesson Plan.
Practice for Graphs for Discrete and for Continuous Data.
Real World application with Basic Graph Types.