
2.2.4: Circle Graphs to Display Data
- Page ID
- 5754
\( \newcommand{\vecs}[1]{\overset { \scriptstyle \rightharpoonup} {\mathbf{#1}} } \)
\( \newcommand{\vecd}[1]{\overset{-\!-\!\rightharpoonup}{\vphantom{a}\smash {#1}}} \)
\( \newcommand{\id}{\mathrm{id}}\) \( \newcommand{\Span}{\mathrm{span}}\)
( \newcommand{\kernel}{\mathrm{null}\,}\) \( \newcommand{\range}{\mathrm{range}\,}\)
\( \newcommand{\RealPart}{\mathrm{Re}}\) \( \newcommand{\ImaginaryPart}{\mathrm{Im}}\)
\( \newcommand{\Argument}{\mathrm{Arg}}\) \( \newcommand{\norm}[1]{\| #1 \|}\)
\( \newcommand{\inner}[2]{\langle #1, #2 \rangle}\)
\( \newcommand{\Span}{\mathrm{span}}\)
\( \newcommand{\id}{\mathrm{id}}\)
\( \newcommand{\Span}{\mathrm{span}}\)
\( \newcommand{\kernel}{\mathrm{null}\,}\)
\( \newcommand{\range}{\mathrm{range}\,}\)
\( \newcommand{\RealPart}{\mathrm{Re}}\)
\( \newcommand{\ImaginaryPart}{\mathrm{Im}}\)
\( \newcommand{\Argument}{\mathrm{Arg}}\)
\( \newcommand{\norm}[1]{\| #1 \|}\)
\( \newcommand{\inner}[2]{\langle #1, #2 \rangle}\)
\( \newcommand{\Span}{\mathrm{span}}\) \( \newcommand{\AA}{\unicode[.8,0]{x212B}}\)
\( \newcommand{\vectorA}[1]{\vec{#1}} % arrow\)
\( \newcommand{\vectorAt}[1]{\vec{\text{#1}}} % arrow\)
\( \newcommand{\vectorB}[1]{\overset { \scriptstyle \rightharpoonup} {\mathbf{#1}} } \)
\( \newcommand{\vectorC}[1]{\textbf{#1}} \)
\( \newcommand{\vectorD}[1]{\overrightarrow{#1}} \)
\( \newcommand{\vectorDt}[1]{\overrightarrow{\text{#1}}} \)
\( \newcommand{\vectE}[1]{\overset{-\!-\!\rightharpoonup}{\vphantom{a}\smash{\mathbf {#1}}}} \)
\( \newcommand{\vecs}[1]{\overset { \scriptstyle \rightharpoonup} {\mathbf{#1}} } \)
\( \newcommand{\vecd}[1]{\overset{-\!-\!\rightharpoonup}{\vphantom{a}\smash {#1}}} \)
\(\newcommand{\avec}{\mathbf a}\) \(\newcommand{\bvec}{\mathbf b}\) \(\newcommand{\cvec}{\mathbf c}\) \(\newcommand{\dvec}{\mathbf d}\) \(\newcommand{\dtil}{\widetilde{\mathbf d}}\) \(\newcommand{\evec}{\mathbf e}\) \(\newcommand{\fvec}{\mathbf f}\) \(\newcommand{\nvec}{\mathbf n}\) \(\newcommand{\pvec}{\mathbf p}\) \(\newcommand{\qvec}{\mathbf q}\) \(\newcommand{\svec}{\mathbf s}\) \(\newcommand{\tvec}{\mathbf t}\) \(\newcommand{\uvec}{\mathbf u}\) \(\newcommand{\vvec}{\mathbf v}\) \(\newcommand{\wvec}{\mathbf w}\) \(\newcommand{\xvec}{\mathbf x}\) \(\newcommand{\yvec}{\mathbf y}\) \(\newcommand{\zvec}{\mathbf z}\) \(\newcommand{\rvec}{\mathbf r}\) \(\newcommand{\mvec}{\mathbf m}\) \(\newcommand{\zerovec}{\mathbf 0}\) \(\newcommand{\onevec}{\mathbf 1}\) \(\newcommand{\real}{\mathbb R}\) \(\newcommand{\twovec}[2]{\left[\begin{array}{r}#1 \\ #2 \end{array}\right]}\) \(\newcommand{\ctwovec}[2]{\left[\begin{array}{c}#1 \\ #2 \end{array}\right]}\) \(\newcommand{\threevec}[3]{\left[\begin{array}{r}#1 \\ #2 \\ #3 \end{array}\right]}\) \(\newcommand{\cthreevec}[3]{\left[\begin{array}{c}#1 \\ #2 \\ #3 \end{array}\right]}\) \(\newcommand{\fourvec}[4]{\left[\begin{array}{r}#1 \\ #2 \\ #3 \\ #4 \end{array}\right]}\) \(\newcommand{\cfourvec}[4]{\left[\begin{array}{c}#1 \\ #2 \\ #3 \\ #4 \end{array}\right]}\) \(\newcommand{\fivevec}[5]{\left[\begin{array}{r}#1 \\ #2 \\ #3 \\ #4 \\ #5 \\ \end{array}\right]}\) \(\newcommand{\cfivevec}[5]{\left[\begin{array}{c}#1 \\ #2 \\ #3 \\ #4 \\ #5 \\ \end{array}\right]}\) \(\newcommand{\mattwo}[4]{\left[\begin{array}{rr}#1 \amp #2 \\ #3 \amp #4 \\ \end{array}\right]}\) \(\newcommand{\laspan}[1]{\text{Span}\{#1\}}\) \(\newcommand{\bcal}{\cal B}\) \(\newcommand{\ccal}{\cal C}\) \(\newcommand{\scal}{\cal S}\) \(\newcommand{\wcal}{\cal W}\) \(\newcommand{\ecal}{\cal E}\) \(\newcommand{\coords}[2]{\left\{#1\right\}_{#2}}\) \(\newcommand{\gray}[1]{\color{gray}{#1}}\) \(\newcommand{\lgray}[1]{\color{lightgray}{#1}}\) \(\newcommand{\rank}{\operatorname{rank}}\) \(\newcommand{\row}{\text{Row}}\) \(\newcommand{\col}{\text{Col}}\) \(\renewcommand{\row}{\text{Row}}\) \(\newcommand{\nul}{\text{Nul}}\) \(\newcommand{\var}{\text{Var}}\) \(\newcommand{\corr}{\text{corr}}\) \(\newcommand{\len}[1]{\left|#1\right|}\) \(\newcommand{\bbar}{\overline{\bvec}}\) \(\newcommand{\bhat}{\widehat{\bvec}}\) \(\newcommand{\bperp}{\bvec^\perp}\) \(\newcommand{\xhat}{\widehat{\xvec}}\) \(\newcommand{\vhat}{\widehat{\vvec}}\) \(\newcommand{\uhat}{\widehat{\uvec}}\) \(\newcommand{\what}{\widehat{\wvec}}\) \(\newcommand{\Sighat}{\widehat{\Sigma}}\) \(\newcommand{\lt}{<}\) \(\newcommand{\gt}{>}\) \(\newcommand{\amp}{&}\) \(\definecolor{fillinmathshade}{gray}{0.9}\)Circle Graphs to Display Data
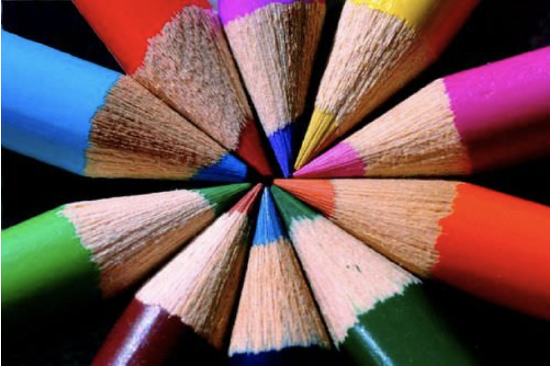
A massive online survey asked almost 100 million people to identify their favorite color from seven options: blue, green, red, black, turquoise, orange, and pink. Once they had the data, the survey company needed to find a visually engaging way to present the data, and decided to use a circle graph.
In this concept, you will learn to create your own circle graphs with data.
Creating Circle Graphs to Display Data
When creating a circle graph, each percentage can be converted to a specific number of degrees. When you know the number of degrees a percentage is equal to, you can use a protractor and a circle to draw it in exactly.
To figure this out, you have to figure out each percentage in terms of degrees.
First, create a proportion. A percent is out of 100, so you can make a ratio out of any percent.
25% becomes 25100
15% becomes 15100
A circle is made up of 360°. Since you are trying to figure out the number of degrees, you use a variable over 360 for the second ratio.
Here is a proportion for converting 25% to degrees.
25100=x360
Next, cross multiply and solve for the variable x. That will be the number of degrees.
100x100xx25%====25(360)9,0009090∘
Now if you were going to draw this on a circle graph, you could take a circle and your protractor and measure in a 90° angle. That would equal 25% of the graph.
Let’s look at another example.
Convert 30% into degrees.
First, write a proportion.
30100=x360
Next, cross multiply and solve for the variable.
10x100xx30%====30(360)10,800108108∘
The answer is 30% is equal to 108°.
Examples
Example 1
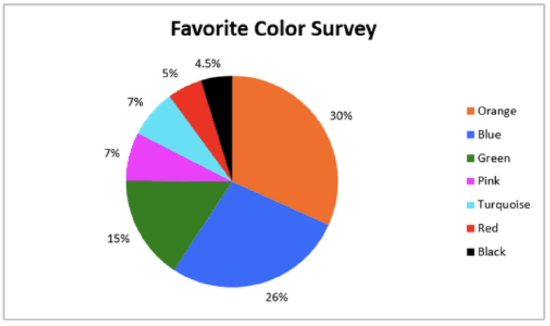
Earlier, you were given a problem about the color survey.
The responses from the almost 100 million respondents are shown in the table below.
| Favorite Color | # of Responses |
| Orange | 30 Million |
| Blue | 26 million |
| Green | 15 million |
| Pink | 7 million |
| Turquoise | 7 million |
| Red | 5 million |
| Black | 4.5 million |
First, convert each color to a decimal and find the total number of responses by adding.
30+26+15+7+7+5+4.5=94.5 million
Next, divide each response color by the total.
| Favorite color | % of Responses |
| Orange | 30÷94.5=0.3175=31.75% |
| Blue | 26÷94.5=0.2751=27.51% |
| Green | 15÷94.5=0.1587=15.87% |
| Pink | 7÷94.5=0.0741=7.41% |
| Turquoise | 7÷94.5=0.0741=7.41% |
| Red | 5÷94.5=0.0529=5.29% |
| Black | 4.5÷94.5=0.0476=4.76% |
Next, convert each percent to a number of degrees. You can do this by changing each percent to a decimal and then multiplying each decimal by 360.
| Favorite Color | Degrees in Central Angle |
| Orange | 0.3175×360∘=114.3∘ |
| Blue | 0.2751×360∘=99.1∘ |
| Green | 0.1587×360∘=57.1∘ |
| Pink | 0.0741×360∘=26.7∘ |
| Turquoise | 0.0741×360∘=26.7∘ |
| Red | 0.0529×360∘=19∘ |
| Black | 0.0476×360∘=17.1∘ |
Finally, create the circle graph.
Umberto Salvagnin; Capture Queen - https://www.flickr.com/photos/kaibara/4950289155/in/photolist-8xrwv2-oHPMU3-edYFnV-dKK1oM-c4Aqj-38n1EA-47DPma-6RHwHn-QBCDd-6SFCeP-2hztQQ-DtQSs-4Wm3Xx-6PijHK-7jKLUK-o7xxzf-sjRVt-6VC6PL-4BpfkL-4nbDC7-bz7P6t-JXs4Z-4ocTxd-5nBMFN-2qBxub-4VNHT7-pYB29B-jbNnE3-E7Bwm-rb6un-opJte2-a15LTb-mxKgRT-6Ld4kq-7iXYLy-pibBd6-nDusfB-e1FnCE-5BJ1rx-7AXCvH-2Jw7QW-9LfgXx-hCMnta-dRrZhp-8wAPXn-9mD6Hr-6Ucrrm-vooGvf-bVCLZ-mCznX;https://www.flickr.com/photos/uaeincredible/231011361/in/photolist-mpZCv-54kbk6-uKek2t-oeipFZ-C5DcP-sejdDJ-qvs4R9-npMCE-5x8hhh-4it75W-bDeKCS-68B7wS-efj8ND-rYL9nn-sM9r5-vqaGMb-9tjxcy-3agcN1-5YGWy2-6bdM4J-6aESrV-vtHyyn-9dQiY7-7Ls5GD-6Hm12q-de8gVT-2M6Tf-p8Fk2r-5WkDRw-5jLpAC-8wAQDB-7XUm8L-aBP1F6-4wJnUd-pXConv-8ymrXZ-5qJx6i-bGVtdg-aaB23d-5zFYt1-5RRt3r-qEHUuU-iGAJ6-fge1rL-eR4zu-7khEyF-ok9RAq-6t8WcV-7X3FuK-o8qGjU
Example 2
The table below shows the number of students in the seventh grade who are studying each foreign language. Make a circle graph that shows the data.
| Foreign Language | Number of Students Studying Language |
| Spanish | 88 |
| French | 48 |
| Italian | 16 |
| German | 8 |
First, find the total number of seventh grade students studying a foreign language. Then find the percent of students studying each language.
88+48+16+8=160
| Language | Number of Students Studying Language | Percent of Students Studying Language |
| Spanish | 88 | 88160=0.55=55% |
| French | 48 | 48160=0.30=30% |
| Italian | 16 | 16160=0.10=10% |
| German | 8 | 8160=0.05=5% |
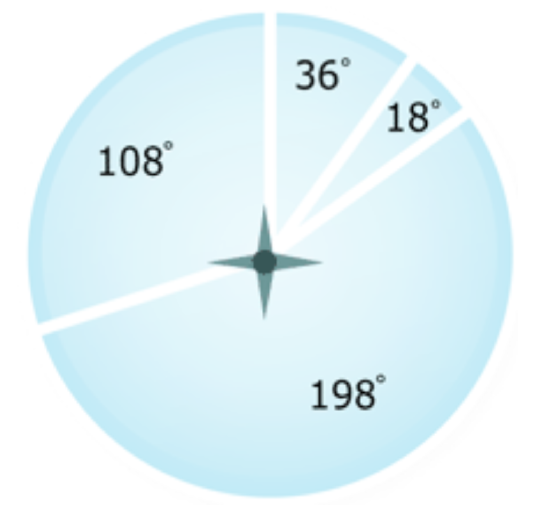
Next, find the measure of the central angle by multiplying 360∘ by the percent.
| Foreign Language | Number of Students Studying Language | Percent of Students Studying Language | Degrees in Central Angle |
| Spanish | 88 | 55% | 0.55×360∘=198∘ |
| French | 48 | 30% | 0.30×360∘=108∘ |
| Italian | 16 | 10% | 0.10×360∘=36∘ |
| German | 8 | 5% | 0.05×360∘=18∘ |
Now, draw a circle with a compass. Draw one radius. Use that radius as a side of one central angle. Measure and draw the other central angles using a protractor.
Umberto Salvagnin; Capture Queen - https://www.flickr.com/photos/kaibara/4950289155/in/photolist-8xrwv2-oHPMU3-edYFnV-dKK1oM-c4Aqj-38n1EA-47DPma-6RHwHn-QBCDd-6SFCeP-2hztQQ-DtQSs-4Wm3Xx-6PijHK-7jKLUK-o7xxzf-sjRVt-6VC6PL-4BpfkL-4nbDC7-bz7P6t-JXs4Z-4ocTxd-5nBMFN-2qBxub-4VNHT7-pYB29B-jbNnE3-E7Bwm-rb6un-opJte2-a15LTb-mxKgRT-6Ld4kq-7iXYLy-pibBd6-nDusfB-e1FnCE-5BJ1rx-7AXCvH-2Jw7QW-9LfgXx-hCMnta-dRrZhp-8wAPXn-9mD6Hr-6Ucrrm-vooGvf-bVCLZ-mCznX;https://www.flickr.com/photos/uaeincredible/231011361/in/photolist-mpZCv-54kbk6-uKek2t-oeipFZ-C5DcP-sejdDJ-qvs4R9-npMCE-5x8hhh-4it75W-bDeKCS-68B7wS-efj8ND-rYL9nn-sM9r5-vqaGMb-9tjxcy-3agcN1-5YGWy2-6bdM4J-6aESrV-vtHyyn-9dQiY7-7Ls5GD-6Hm12q-de8gVT-2M6Tf-p8Fk2r-5WkDRw-5jLpAC-8wAQDB-7XUm8L-aBP1F6-4wJnUd-pXConv-8ymrXZ-5qJx6i-bGVtdg-aaB23d-5zFYt1-5RRt3r-qEHUuU-iGAJ6-fge1rL-eR4zu-7khEyF-ok9RAq-6t8WcV-7X3FuK-o8qGjU
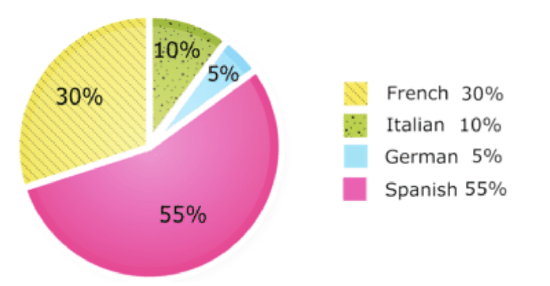
Then, label each sector with a title and percent and give a title to the entire circle graph.
Here is the final graph.
Umberto Salvagnin; Capture Queen - https://www.flickr.com/photos/kaibara/4950289155/in/photolist-8xrwv2-oHPMU3-edYFnV-dKK1oM-c4Aqj-38n1EA-47DPma-6RHwHn-QBCDd-6SFCeP-2hztQQ-DtQSs-4Wm3Xx-6PijHK-7jKLUK-o7xxzf-sjRVt-6VC6PL-4BpfkL-4nbDC7-bz7P6t-JXs4Z-4ocTxd-5nBMFN-2qBxub-4VNHT7-pYB29B-jbNnE3-E7Bwm-rb6un-opJte2-a15LTb-mxKgRT-6Ld4kq-7iXYLy-pibBd6-nDusfB-e1FnCE-5BJ1rx-7AXCvH-2Jw7QW-9LfgXx-hCMnta-dRrZhp-8wAPXn-9mD6Hr-6Ucrrm-vooGvf-bVCLZ-mCznX;https://www.flickr.com/photos/uaeincredible/231011361/in/photolist-mpZCv-54kbk6-uKek2t-oeipFZ-C5DcP-sejdDJ-qvs4R9-npMCE-5x8hhh-4it75W-bDeKCS-68B7wS-efj8ND-rYL9nn-sM9r5-vqaGMb-9tjxcy-3agcN1-5YGWy2-6bdM4J-6aESrV-vtHyyn-9dQiY7-7Ls5GD-6Hm12q-de8gVT-2M6Tf-p8Fk2r-5WkDRw-5jLpAC-8wAQDB-7XUm8L-aBP1F6-4wJnUd-pXConv-8ymrXZ-5qJx6i-bGVtdg-aaB23d-5zFYt1-5RRt3r-qEHUuU-iGAJ6-fge1rL-eR4zu-7khEyF-ok9RAq-6t8WcV-7X3FuK-o8qGjU
Example 3
Convert 20% into degrees.
First, set up the proportion.
20100=x360
Next, cross multiply and solve for the variable x. That will be the number of degrees.
100x100xx20%====20(360)7,2007272∘
The answer is 20% equals 72°.
Example 4
Convert 40% into degrees.
First, set up the proportion.
40100=x360
Next, cross multiply and solve for the variable x. That will be the number of degrees.
100x100xx40%====40(360)14,400144144∘
The answer is 40% equals 144°.
Example 5
Convert 75% into degrees.
First, set up the proportion.
75100=x360
Next, cross multiply and solve for the variable x. That will be the number of degrees.
100x100xx75%====75(360)27,000270270∘
The answer is 75% equals 270°.
Review
Answer the following questions.
- The table shows how much money the students in the seventh grade have raised so far for a class trip. Make a circle graph that shows the data.
| Fundraiser | Amount |
| Car wash | $150 |
| Book sale | $175 |
| Bake sale | $100 |
| Plant sale | $75 |
- Make a list of 5 popular ice cream flavors. Then survey your classmates asking them which of the 5 flavors is their favorite ice cream flavor. Use the data to make a circle graph.
- Use a newspaper to locate a circle graph of some data. Then write five questions about the data.
Look at each percentage and then use a proportion to find the equivalent number of degrees. You may round your answer when necessary.
- 12%
- 25%
- 28%
- 42%
- 19%
- 80%
- 90%
- 34%
- 15%
- 5%
- 10%
- 78%
Resources
Vocabulary
| Term | Definition |
|---|---|
| Sector | A sector of a circle is a portion of a circle contained between two radii of the circle. Sectors can be measured in degrees. |
Additional Resources
PLIX: Play, Learn, Interact, eXplore - Interpretations of Circle Graphs: Northwest Region in millions
Video: Reading Pie Graphs
Practice: Circle Graphs to Display Data
Real World: Favorite Films