
4.1: Introduction to Mean, Median, and Mode
- Page ID
- 5715
\( \newcommand{\vecs}[1]{\overset { \scriptstyle \rightharpoonup} {\mathbf{#1}} } \)
\( \newcommand{\vecd}[1]{\overset{-\!-\!\rightharpoonup}{\vphantom{a}\smash {#1}}} \)
\( \newcommand{\id}{\mathrm{id}}\) \( \newcommand{\Span}{\mathrm{span}}\)
( \newcommand{\kernel}{\mathrm{null}\,}\) \( \newcommand{\range}{\mathrm{range}\,}\)
\( \newcommand{\RealPart}{\mathrm{Re}}\) \( \newcommand{\ImaginaryPart}{\mathrm{Im}}\)
\( \newcommand{\Argument}{\mathrm{Arg}}\) \( \newcommand{\norm}[1]{\| #1 \|}\)
\( \newcommand{\inner}[2]{\langle #1, #2 \rangle}\)
\( \newcommand{\Span}{\mathrm{span}}\)
\( \newcommand{\id}{\mathrm{id}}\)
\( \newcommand{\Span}{\mathrm{span}}\)
\( \newcommand{\kernel}{\mathrm{null}\,}\)
\( \newcommand{\range}{\mathrm{range}\,}\)
\( \newcommand{\RealPart}{\mathrm{Re}}\)
\( \newcommand{\ImaginaryPart}{\mathrm{Im}}\)
\( \newcommand{\Argument}{\mathrm{Arg}}\)
\( \newcommand{\norm}[1]{\| #1 \|}\)
\( \newcommand{\inner}[2]{\langle #1, #2 \rangle}\)
\( \newcommand{\Span}{\mathrm{span}}\) \( \newcommand{\AA}{\unicode[.8,0]{x212B}}\)
\( \newcommand{\vectorA}[1]{\vec{#1}} % arrow\)
\( \newcommand{\vectorAt}[1]{\vec{\text{#1}}} % arrow\)
\( \newcommand{\vectorB}[1]{\overset { \scriptstyle \rightharpoonup} {\mathbf{#1}} } \)
\( \newcommand{\vectorC}[1]{\textbf{#1}} \)
\( \newcommand{\vectorD}[1]{\overrightarrow{#1}} \)
\( \newcommand{\vectorDt}[1]{\overrightarrow{\text{#1}}} \)
\( \newcommand{\vectE}[1]{\overset{-\!-\!\rightharpoonup}{\vphantom{a}\smash{\mathbf {#1}}}} \)
\( \newcommand{\vecs}[1]{\overset { \scriptstyle \rightharpoonup} {\mathbf{#1}} } \)
\( \newcommand{\vecd}[1]{\overset{-\!-\!\rightharpoonup}{\vphantom{a}\smash {#1}}} \)
\(\newcommand{\avec}{\mathbf a}\) \(\newcommand{\bvec}{\mathbf b}\) \(\newcommand{\cvec}{\mathbf c}\) \(\newcommand{\dvec}{\mathbf d}\) \(\newcommand{\dtil}{\widetilde{\mathbf d}}\) \(\newcommand{\evec}{\mathbf e}\) \(\newcommand{\fvec}{\mathbf f}\) \(\newcommand{\nvec}{\mathbf n}\) \(\newcommand{\pvec}{\mathbf p}\) \(\newcommand{\qvec}{\mathbf q}\) \(\newcommand{\svec}{\mathbf s}\) \(\newcommand{\tvec}{\mathbf t}\) \(\newcommand{\uvec}{\mathbf u}\) \(\newcommand{\vvec}{\mathbf v}\) \(\newcommand{\wvec}{\mathbf w}\) \(\newcommand{\xvec}{\mathbf x}\) \(\newcommand{\yvec}{\mathbf y}\) \(\newcommand{\zvec}{\mathbf z}\) \(\newcommand{\rvec}{\mathbf r}\) \(\newcommand{\mvec}{\mathbf m}\) \(\newcommand{\zerovec}{\mathbf 0}\) \(\newcommand{\onevec}{\mathbf 1}\) \(\newcommand{\real}{\mathbb R}\) \(\newcommand{\twovec}[2]{\left[\begin{array}{r}#1 \\ #2 \end{array}\right]}\) \(\newcommand{\ctwovec}[2]{\left[\begin{array}{c}#1 \\ #2 \end{array}\right]}\) \(\newcommand{\threevec}[3]{\left[\begin{array}{r}#1 \\ #2 \\ #3 \end{array}\right]}\) \(\newcommand{\cthreevec}[3]{\left[\begin{array}{c}#1 \\ #2 \\ #3 \end{array}\right]}\) \(\newcommand{\fourvec}[4]{\left[\begin{array}{r}#1 \\ #2 \\ #3 \\ #4 \end{array}\right]}\) \(\newcommand{\cfourvec}[4]{\left[\begin{array}{c}#1 \\ #2 \\ #3 \\ #4 \end{array}\right]}\) \(\newcommand{\fivevec}[5]{\left[\begin{array}{r}#1 \\ #2 \\ #3 \\ #4 \\ #5 \\ \end{array}\right]}\) \(\newcommand{\cfivevec}[5]{\left[\begin{array}{c}#1 \\ #2 \\ #3 \\ #4 \\ #5 \\ \end{array}\right]}\) \(\newcommand{\mattwo}[4]{\left[\begin{array}{rr}#1 \amp #2 \\ #3 \amp #4 \\ \end{array}\right]}\) \(\newcommand{\laspan}[1]{\text{Span}\{#1\}}\) \(\newcommand{\bcal}{\cal B}\) \(\newcommand{\ccal}{\cal C}\) \(\newcommand{\scal}{\cal S}\) \(\newcommand{\wcal}{\cal W}\) \(\newcommand{\ecal}{\cal E}\) \(\newcommand{\coords}[2]{\left\{#1\right\}_{#2}}\) \(\newcommand{\gray}[1]{\color{gray}{#1}}\) \(\newcommand{\lgray}[1]{\color{lightgray}{#1}}\) \(\newcommand{\rank}{\operatorname{rank}}\) \(\newcommand{\row}{\text{Row}}\) \(\newcommand{\col}{\text{Col}}\) \(\renewcommand{\row}{\text{Row}}\) \(\newcommand{\nul}{\text{Nul}}\) \(\newcommand{\var}{\text{Var}}\) \(\newcommand{\corr}{\text{corr}}\) \(\newcommand{\len}[1]{\left|#1\right|}\) \(\newcommand{\bbar}{\overline{\bvec}}\) \(\newcommand{\bhat}{\widehat{\bvec}}\) \(\newcommand{\bperp}{\bvec^\perp}\) \(\newcommand{\xhat}{\widehat{\xvec}}\) \(\newcommand{\vhat}{\widehat{\vvec}}\) \(\newcommand{\uhat}{\widehat{\uvec}}\) \(\newcommand{\what}{\widehat{\wvec}}\) \(\newcommand{\Sighat}{\widehat{\Sigma}}\) \(\newcommand{\lt}{<}\) \(\newcommand{\gt}{>}\) \(\newcommand{\amp}{&}\) \(\definecolor{fillinmathshade}{gray}{0.9}\)Measures of Central Tendency and Dispersion
Suppose the heights in inches of the students in your class are as follows: 58, 58, 59, 60, 62, 64, 64, 65, 66, 66, 66, 66, 68, 68, 69, 70, 71, 72, 72, 74, 75, 77. What would be the mean of this data? How about the median and mode? Would you be able to calculate the variance for this data? How about the standard deviation?
Central Tendency and Dispersion
The majority of this textbook centers upon two-variable data, data with an input and an output. This is also known as bivariate data. There are many types of situations in which only one set of data is given. This data is known as univariate data. Unlike data you have seen before, no rule can be written relating univariate data. Instead, other methods are used to analyze the data. Three such methods are the measures of central tendency.
Measures of central tendency are the center values of a data set.
- Mean is the average of all the data. Its symbol is x¯.
- Mode is the data value appearing most often in the data set.
- Median is the middle value of the data set, arranged in ascending order.
Let's find the mean, median, and mode of the following data representing test scores:
90, 76, 53, 78, 88, 80, 81, 91, 99, 68, 62, 78, 67, 82, 88, 89, 78, 72, 77, 96, 93, 88, 88
Find the mean, median, mode, and range of this data.
- To find the mean, add all the values and divide by the number of values you added.
mean=80.96
- To find the mode, look for the value(s) repeating the most.
mode=88
- To find the median, organize the data from least to greatest. Then find the middle value.
53, 62, 62, 67, 68, 72, 76, 77, 78, 78, 78, 78, 80, 81, 82, 88, 88, 88, 88, 89, 90, 91, 93, 96, 99
median=81
- To find the range, subtract the highest value and the lowest value.
range=99−53=46
When a data set has two modes, it is bimodal.
If the data does not have a “middle value,” the median is the average of the two middle values. This occurs when data sets have an even number of entries.
Which Measure Is Best?
While the mean, mode, and median represent centers of data, one is usually more beneficial than another when describing a particular data set.
For example, if the data has a wide range, the median is a better choice to describe the center than the mean.
- The income of a population is described using the median, because there are very low and very high incomes in one given region.
If the data were categorical, meaning it can be separated into different categories, the mode may be a better choice.
- If a sandwich shop sold ten different sandwiches, the mode would be useful to describe the favorite sandwich.
Measures of Dispersion
In statistics, measures of dispersion describe how spread apart the data is from the measure of center. There are three main types of dispersion:
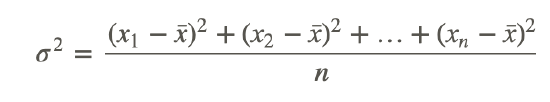
- Variance - the mean of the squares of the distance each data item (xi) is from the mean.
σ2=(x1−x¯)2+(x2−x¯)2+…+(xn−x¯)2n
The symbol for variance is σ2.
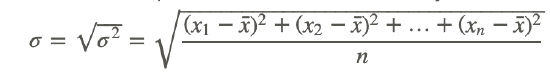
- Standard deviation - the square root of the variance.
- Range - the difference between the highest and lowest values in the data.
Let's find the variance for the following data: 11, 13, 14, 15, 19, 22, 24, 26:
First find the mean (x¯).
x¯=11+13+14+15+19+22+24+268=18
It’s easier to create a table of the differences and their squares.
| xi | xi−x¯ | (x1−x¯)2 |
|---|---|---|
| 11 | –7 | 49 |
| 13 | –5 | 25 |
| 14 | –4 | 16 |
| 15 | –3 | 9 |
| 19 | 1 | 1 |
| 22 | 4 | 16 |
| 24 | 6 | 36 |
| 26 | 8 | 64 |
Compute the variance:
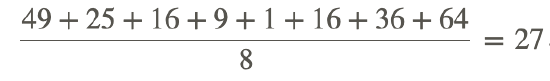
The variance is a measure of the dispersion and its value is lower for tightly grouped data than for widely spread data. In the example above, the variance is 27. What does it mean to say that tightly grouped data will have a low variance? You can probably already imagine that the size of the variance also depends on the size of the data itself. Below we see ways that mathematicians have tried to standardize the variance.
The Standard Deviation
Standard deviation measures how closely the data clusters around the mean. It is the square root of the variance. Its symbol is σ.
Now, let's calculate the standard deviation of the data set that you found the variance of:
The standard deviation is the square root of the variance.
σ2=27 so σ=5.196
Examples
Example 1
Earlier, you were asked what the mean, median, and mode of the heights of the students in your class would be. Additionally, you were asked if you could calculate the variance and standard deviation for this data.
The heights in inches of the students in your class are as follows: 58, 58, 59, 60, 62, 64, 64, 65, 66, 66, 66, 66, 68, 68, 69, 70, 71, 72, 72, 74, 75, 77.
- To find the mean, add all the values and divide by the total number of values (22 in this case).
Mean=66.81
- To find the mode, look for the value(s) that repeat the most.
Mode=66
- To find the median, organize the data from least to greatest. Then find the middle value.
This data set is already organized from least to greatest, so you can go straight to finding the middle value.
Median=66
- To find the variance, calculate the mean of the squares of the distance each value is from the mean.
It's easiest to set this up in a table.
| xi | xi−x¯ | (x1−x¯)2 |
| 58 | -8.81 | 77.6161 |
| 58 | -8.81 | 77.6161 |
| 59 | -8.81 | 77.6161 |
| 60 | -6.81 | 46.3761 |
| 62 | -4.81 | 23.1361 |
| 64 | -2.81 | 7.8961 |
| 64 | -2.81 | 7.8961 |
| 65 | -1.81 | 3.2761 |
| 66 | -0.81 | 0.6561 |
| 66 | -0.81 | 0.6561 |
| 66 | -0.81 | 0.6561 |
| 66 | -0.81 | 0.6561 |
| 68 | 1.19 | 1.4161 |
| 68 | 1.19 | 1.4161 |
| 69 | 2.19 | 4.7961 |
| 70 | 3.19 | 10.1761 |
| 71 | 4.19 | 17.5561 |
| 72 | 5.19 | 26.9361 |
| 72 | 5.19 | 36.9361 |
| 74 | 7.19 | 51.6961 |
| 75 | 8.19 | 67.0761 |
| 77 | 10.19 | 103.8361 |
Now, plug these values into the equation for variance and solve.
Variance=28.15
- To find the standard deviation, take the square root of the variance.
Standard deviation=28.150.5=5.31
Example 2
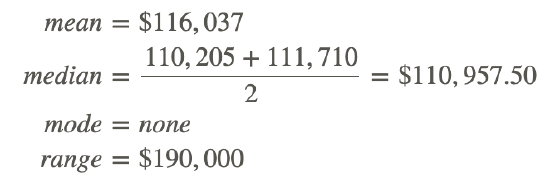
Find the mean, median, mode, range, variance, and standard deviation of the data set below.
| Address | Sale Price |
|---|---|
| 518 CLEVELAND AVE | $117,424 |
| 1808 MARKESE AVE | $128,000 |
| 1770 WHITE AVE | $132,485 |
| 1459 LINCOLN AVE | $77,900 |
| 1462 ANNE AVE | $60,000 |
| 2414 DIX HWY | $250,000 |
| 1523 ANNE AVE | $110,205 |
| 1763 MARKESE AVE | $70,000 |
| 1460 CLEVELAND AVE | $111,710 |
| 1478 MILL ST | $102,646 |
Use a table to find variance.
| xi | xi−x¯ | (x1−x¯)2 |
|---|---|---|
| 117,424 | 1387 | 1,923,769 |
| 128,000 | 11,963 | 143,113,369 |
| 132,485 | 16,448 | 270,536,704 |
| 77,900 | –38,137 | 1,454,430,769 |
| 60,000 | –56,037 | 3,140,145,369 |
| 250,000 | 133,963 | 1.7946×10¹⁰ |
| 110,205 | –5832 | 34,012,224 |
| 70,000 | –46,037 | 2,119,405,369 |
| 111,710 | –4327 | 18,722,929 |
| 102,646 | –13,391 | 179,318,881 |
variance=2,530,769,498
standard deviation=50,306.754
Review
- Define measures of central tendency. What are the three listed in this Concept?
- Define median. Explain its difference from the mean. In which situations is the median more effective to describe the center of the data?
- What is bimodal? Give an example of a set of data that is bimodal.
- What are the three measures of dispersion described in this Concept? Which is the easiest to compute?
- Give the formula for variance and define its variables.
- Why may variance be difficult to use as a measure of spread? Use the housing example to help you explain.
- Describe standard variation.
- Explain why the standard deviation of 2, 2, 2, 2, 2, 2, and 2 is zero.
- Find the mean, median, and range of the salaries given below.
| Professional Realm | Annual income |
|---|---|
| Farming, Fishing, and Forestry | $19,630 |
| Sales and Related | $28,920 |
| Architecture and Engineering | $56,330 |
| Healthcare Practitioners | $49,930 |
| Legal | $69,030 |
| Teaching & Education | $39,130 |
| Construction | $35,460 |
| Professional Baseball Player* | $2,476,590 |
(Source: Bureau of Labor Statistics, except (*) - The Baseball Players' Association (playbpa.com)).
Find the mean, median, mode,and range of the following data sets.
- 11, 16, 9, 15, 5, 18
- 53, 32, 49, 24, 62
- 11, 9, 19, 9, 19, 9, 13, 11
- 3, 2, 6, 9, 0, 1, 6, 6, 3, 2, 3, 5
- 2, 17, 1, –3, 12, 8, 12, 16
- 11, 21, 6, 17, 9.
- 223, 121, 227, 433, 122, 193, 397, 276, 303, 199, 197, 265, 366, 401, 222
Find the mean, median, and standard deviation of the following numbers. Which, of the mean and median, will give the best average?
- 15, 19, 15, 16, 11, 11, 18, 21, 165, 9, 11, 20, 16, 8, 17, 10, 12, 11, 16, 14
- 11, 12, 14, 14, 14, 14, 19
- 11, 12, 14, 16, 17, 17, 18
- 6, 7, 9, 10, 13
- 121, 122, 193, 197, 199, 222, 223, 227, 265, 276, 303, 366, 397, 401, 433
- If each score on an algebra test is increased by seven points, how would this affect the:
- Mean?
- Median?
- Mode?
- Range?
- Standard deviation?
- If each score of a golfer was multiplied by two, how would this affect the:
- Mean?
- Median?
- Mode?
- Range?
- Henry has the following World History scores: 88, 76, 97, 84. What would Henry need to score on his fifth test to have an average of 86?
- Explain why it is not possible for Henry to have an average of 93 after his fifth score.
- The mean of nine numbers is 105. What is the sum of the numbers?
- A bowler has the following scores: 163, 187, 194, 188, 205, 196. Find the bowler’s average.
- Golf scores for a nine-hole course for five different players were: 38, 45, 58, 38, 36.
- Find the mean golf score.
- Find the standard deviation to the nearest hundredth.
- Does the mean represent the most accurate center of tendency? Explain.
- Ten house sales in Encinitas, California are shown in the table below. Find the mean, median, and standard deviation for the sale prices. Explain, using the data, why the median house price is most often used as a measure of the house prices in an area.
| Address | Sale Price | Date Of Sale |
|---|---|---|
| 643 3RD ST | $1,137,000 | 6/5/2007 |
| 911 CORNISH DR | $879,000 | 6/5/2007 |
| 911 ARDEN DR | $950,000 | 6/13/2007 |
| 715 S VULCAN AVE | $875,000 | 4/30/2007 |
| 510 4TH ST | $1,499,000 | 4/26/2007 |
| 415 ARDEN DR | $875,000 | 5/11/2007 |
| 226 5TH ST | $4,000,000 | 5/3/2007 |
| 710 3RD ST | $975,000 | 3/13/2007 |
| 68 LA VETA AVE | $796,793 | 2/8/2007 |
| 207 WEST D ST | $2,100,000 | 3/15/2007 |
- Determine which statistical measure (mean, median, or mode) would be most appropriate for the following.
- The life expectancy of store-bought goldfish.
- The age in years of the audience for a kids' TV program.
- The weight of potato sacks that a store labels as “5-pound bag.”
- James and John both own fields in which they plant cabbages. James plants cabbages by hand, while John uses a machine to carefully control the distance between the cabbages. The diameters of each grower’s cabbages are measured, and the results are shown in the table. John claims his method of machine planting is better. James insists it is better to plant by hand. Use the data to provide a reason to justify both sides of the argument.
| James | John | |
|---|---|---|
| Mean Diameter (inches) | 7.10 | 6.85 |
| Standard Deviation (inches) | 2.75 | 0.60 |
- Two bus companies run services between Los Angeles and San Francisco. The mean journey times and standard deviations in those times are given below. If Samantha needs to travel between the cities, which company should she choose if:
- She needs to catch a plane in San Francisco.
- She travels weekly to visit friends who live in San Francisco and wishes to minimize the time she spends on a bus over the entire year.
| Inter-Cal Express | Fast-dog Travel | |
|---|---|---|
| Mean Time (hours) | 9.5 | 8.75 |
| Standard Deviation (hours) | 0.25 | 2.5 |
Mixed Review
- A square garden has dimensions of 20 yards by 20 yards. How much shorter is it to cut across the diagonal than to walk around two joining sides?
- Rewrite in standard form: y=x/6−5.
- Solve for m: −2=(x+7).25
- A sail has a vertical length of 15 feet and a horizontal length of 8 feet. To the nearest foot, how long is the diagonal?
- Rationalize the denominator: 220.5.
Review (Answers)
To see the Review answers, open this PDF file and look for section 11.9.
Vocabulary
| Term | Definition |
|---|---|
| bivariate data | So far we have seen two-variable data, which is data with an input and an output. This is also known as bivariate data. |
| measures of dispersion | In statistics, measures of dispersion describe how spread apart the data is from the measure of center. There are three main types of dispersion: |
| Median | The median of a data set is the middle value of an organized data set. |
| range | Difference between highest and lowest values in data. |
| standard deviation | The square root of the variance. |
| univariate data | There are many types of situations in which only one set of data is given. This data is known as univariate data. |
| variance | is the mean of the squares of the distance each data item is from the mean, or σ2. |
| arithmetic mean | The arithmetic mean is also called the average. |
| descriptive statistics | In descriptive statistics, the goal is to describe the data that found in a sample or given in a problem. |
| inferential statistics | With inferential statistics, your goal is use the data in a sample to draw conclusions about a larger population. |
| measure of central tendency | In statistics, a measure of central tendency of a data set is a central or typical value of the data set. |
| Mode | The mode of a data set is the value or values with greatest frequency in the data set. |
| multimodal | When a set of data has more than 2 values that occur with the same greatest frequency, the set is called multimodal . |
| Outlier | In statistics, an outlier is a data value that is far from other data values. |
| Population Mean | The population mean is the mean of all of the members of an entire population. |
| resistant | A statistic that is not affected by outliers is called resistant. |
| Sample Mean | A sample mean is the mean only of the members of a sample or subset of a population. |
Additional Resources
PLIX: Play, Learn, Interact, eXplore - The Tree Conundrum
Video: Mean, Median, and Mode
Activities: Measure of Central Tendency and Dispersion Discussion Questions
Study Aid: Describing Data
Practice: Introduction to Mean, Median, and Mode
Real World: Mean or Median?