
5.1: Variance of a Data Set
- Page ID
- 5725
\( \newcommand{\vecs}[1]{\overset { \scriptstyle \rightharpoonup} {\mathbf{#1}} } \)
\( \newcommand{\vecd}[1]{\overset{-\!-\!\rightharpoonup}{\vphantom{a}\smash {#1}}} \)
\( \newcommand{\id}{\mathrm{id}}\) \( \newcommand{\Span}{\mathrm{span}}\)
( \newcommand{\kernel}{\mathrm{null}\,}\) \( \newcommand{\range}{\mathrm{range}\,}\)
\( \newcommand{\RealPart}{\mathrm{Re}}\) \( \newcommand{\ImaginaryPart}{\mathrm{Im}}\)
\( \newcommand{\Argument}{\mathrm{Arg}}\) \( \newcommand{\norm}[1]{\| #1 \|}\)
\( \newcommand{\inner}[2]{\langle #1, #2 \rangle}\)
\( \newcommand{\Span}{\mathrm{span}}\)
\( \newcommand{\id}{\mathrm{id}}\)
\( \newcommand{\Span}{\mathrm{span}}\)
\( \newcommand{\kernel}{\mathrm{null}\,}\)
\( \newcommand{\range}{\mathrm{range}\,}\)
\( \newcommand{\RealPart}{\mathrm{Re}}\)
\( \newcommand{\ImaginaryPart}{\mathrm{Im}}\)
\( \newcommand{\Argument}{\mathrm{Arg}}\)
\( \newcommand{\norm}[1]{\| #1 \|}\)
\( \newcommand{\inner}[2]{\langle #1, #2 \rangle}\)
\( \newcommand{\Span}{\mathrm{span}}\) \( \newcommand{\AA}{\unicode[.8,0]{x212B}}\)
\( \newcommand{\vectorA}[1]{\vec{#1}} % arrow\)
\( \newcommand{\vectorAt}[1]{\vec{\text{#1}}} % arrow\)
\( \newcommand{\vectorB}[1]{\overset { \scriptstyle \rightharpoonup} {\mathbf{#1}} } \)
\( \newcommand{\vectorC}[1]{\textbf{#1}} \)
\( \newcommand{\vectorD}[1]{\overrightarrow{#1}} \)
\( \newcommand{\vectorDt}[1]{\overrightarrow{\text{#1}}} \)
\( \newcommand{\vectE}[1]{\overset{-\!-\!\rightharpoonup}{\vphantom{a}\smash{\mathbf {#1}}}} \)
\( \newcommand{\vecs}[1]{\overset { \scriptstyle \rightharpoonup} {\mathbf{#1}} } \)
\( \newcommand{\vecd}[1]{\overset{-\!-\!\rightharpoonup}{\vphantom{a}\smash {#1}}} \)
\(\newcommand{\avec}{\mathbf a}\) \(\newcommand{\bvec}{\mathbf b}\) \(\newcommand{\cvec}{\mathbf c}\) \(\newcommand{\dvec}{\mathbf d}\) \(\newcommand{\dtil}{\widetilde{\mathbf d}}\) \(\newcommand{\evec}{\mathbf e}\) \(\newcommand{\fvec}{\mathbf f}\) \(\newcommand{\nvec}{\mathbf n}\) \(\newcommand{\pvec}{\mathbf p}\) \(\newcommand{\qvec}{\mathbf q}\) \(\newcommand{\svec}{\mathbf s}\) \(\newcommand{\tvec}{\mathbf t}\) \(\newcommand{\uvec}{\mathbf u}\) \(\newcommand{\vvec}{\mathbf v}\) \(\newcommand{\wvec}{\mathbf w}\) \(\newcommand{\xvec}{\mathbf x}\) \(\newcommand{\yvec}{\mathbf y}\) \(\newcommand{\zvec}{\mathbf z}\) \(\newcommand{\rvec}{\mathbf r}\) \(\newcommand{\mvec}{\mathbf m}\) \(\newcommand{\zerovec}{\mathbf 0}\) \(\newcommand{\onevec}{\mathbf 1}\) \(\newcommand{\real}{\mathbb R}\) \(\newcommand{\twovec}[2]{\left[\begin{array}{r}#1 \\ #2 \end{array}\right]}\) \(\newcommand{\ctwovec}[2]{\left[\begin{array}{c}#1 \\ #2 \end{array}\right]}\) \(\newcommand{\threevec}[3]{\left[\begin{array}{r}#1 \\ #2 \\ #3 \end{array}\right]}\) \(\newcommand{\cthreevec}[3]{\left[\begin{array}{c}#1 \\ #2 \\ #3 \end{array}\right]}\) \(\newcommand{\fourvec}[4]{\left[\begin{array}{r}#1 \\ #2 \\ #3 \\ #4 \end{array}\right]}\) \(\newcommand{\cfourvec}[4]{\left[\begin{array}{c}#1 \\ #2 \\ #3 \\ #4 \end{array}\right]}\) \(\newcommand{\fivevec}[5]{\left[\begin{array}{r}#1 \\ #2 \\ #3 \\ #4 \\ #5 \\ \end{array}\right]}\) \(\newcommand{\cfivevec}[5]{\left[\begin{array}{c}#1 \\ #2 \\ #3 \\ #4 \\ #5 \\ \end{array}\right]}\) \(\newcommand{\mattwo}[4]{\left[\begin{array}{rr}#1 \amp #2 \\ #3 \amp #4 \\ \end{array}\right]}\) \(\newcommand{\laspan}[1]{\text{Span}\{#1\}}\) \(\newcommand{\bcal}{\cal B}\) \(\newcommand{\ccal}{\cal C}\) \(\newcommand{\scal}{\cal S}\) \(\newcommand{\wcal}{\cal W}\) \(\newcommand{\ecal}{\cal E}\) \(\newcommand{\coords}[2]{\left\{#1\right\}_{#2}}\) \(\newcommand{\gray}[1]{\color{gray}{#1}}\) \(\newcommand{\lgray}[1]{\color{lightgray}{#1}}\) \(\newcommand{\rank}{\operatorname{rank}}\) \(\newcommand{\row}{\text{Row}}\) \(\newcommand{\col}{\text{Col}}\) \(\renewcommand{\row}{\text{Row}}\) \(\newcommand{\nul}{\text{Nul}}\) \(\newcommand{\var}{\text{Var}}\) \(\newcommand{\corr}{\text{corr}}\) \(\newcommand{\len}[1]{\left|#1\right|}\) \(\newcommand{\bbar}{\overline{\bvec}}\) \(\newcommand{\bhat}{\widehat{\bvec}}\) \(\newcommand{\bperp}{\bvec^\perp}\) \(\newcommand{\xhat}{\widehat{\xvec}}\) \(\newcommand{\vhat}{\widehat{\vvec}}\) \(\newcommand{\uhat}{\widehat{\uvec}}\) \(\newcommand{\what}{\widehat{\wvec}}\) \(\newcommand{\Sighat}{\widehat{\Sigma}}\) \(\newcommand{\lt}{<}\) \(\newcommand{\gt}{>}\) \(\newcommand{\amp}{&}\) \(\definecolor{fillinmathshade}{gray}{0.9}\)Variance of a Data Set
To calculate the variance (σ2) for a population of normally distributed data:
Step 1: Determine the mean of the data values.
Step 2: Subtract the mean of the data from each value in the data set to determine the difference between the data value and the mean: (x−μ).
Step 3: Square each of these differences and determine the total of these positive, squared results.
Step 4: Divide this sum by the number of values in the data set.
These steps for calculating the variance of a data set for a population can be summarized in the following formula:
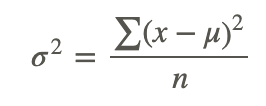
where:
x is a data value.
μ is the population mean.
n is number of data values (population size).
These steps for calculating the variance of a data set for a sample can be summarized in the following formula:
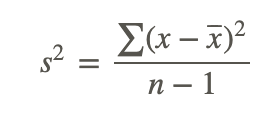
where:
x is a data value.
x̅ is the sample mean.
n is number of data values (sample size).
The only difference in the formulas is the number by which the sum is divided. For a population, it is divided by n, and for a sample, it is divided by n−1.
Calculating the Variance of a Data Set
1. A company wants to test its exterior house paint to determine how long it will retain its original color before fading. The company mixes 2 brands of paint by adding different chemicals to each brand. 6 one-gallon cans are made for each paint brand, and the results are recorded for every gallon of each brand of paint. The following are the results obtained in the laboratory. Calculate the variance of the 2 brands of paint. These are both small populations.
| Brand A (Time in months) | Brand B (Time in months) |
|---|---|
| 15 | 40 |
| 65 | 50 |
| 55 | 35 |
| 35 | 40 |
| 45 | 45 |
| 25 | 30 |
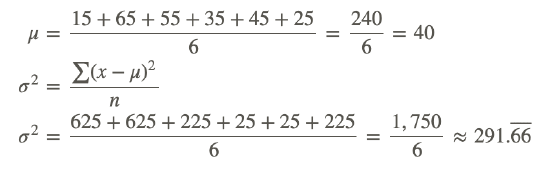
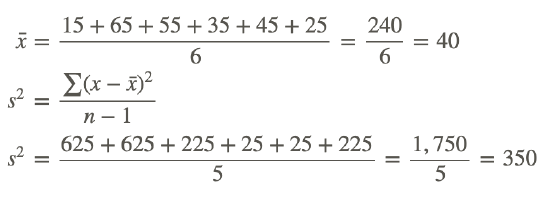
Brand A
| x | (x−μ) | (x−μ)2 |
|---|---|---|
| 15 | −25 | 625 |
| 65 | 25 | 625 |
| 55 | 15 | 225 |
| 35 | −5 | 25 |
| 45 | 5 | 25 |
| 25 | −15 | 225 |
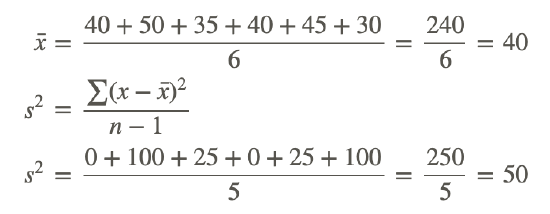
Brand B
| x | (x−μ) | (x−μ)2 |
|---|---|---|
| 40 | 0 | 0 |
| 50 | 10 | 100 |
| 35 | −5 | 25 |
| 40 | 0 | 0 |
| 45 | 5 | 25 |
| 30 | −10 | 100 |
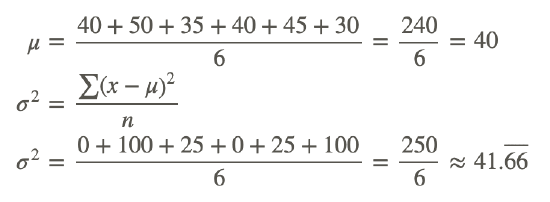
The variance is simply the average of the squares of the distance of each data value from the mean. If these data values are close to the value of the mean, the variance will be small. This was the case for Brand B. If these data values are far from the mean, the variance will be large, as was the case for Brand A.
The variance of a data set is always a positive value.
2. What would the variances of the 2 data sets in the previous example have been had they been samples instead of small populations?
First, let's calculate the variance of the data set for Brand A had it been a sample:
Next, let's calculate the variance of the data set for Brand B had it been a sample:
Notice that, as in the previous example, the variance of the data set for Brand A is much larger than the variance of the data set for Brand B.
3. The following data represents the morning temperatures (∘C) and the monthly rainfall (mm) in July for all the Canadian cities east of Toronto:
Temperature (∘C)
11.7 13.7 10.5 14.2 13.9 14.2 10.4 16.1 16.4 4.8 15.2 13.0 14.4 12.7 8.6 12.9 11.5 14.6
Precipitation (mm)
18.6 37.1 70.9 102 59.9 58.0 73.0 77.6 89.1 86.6 40.3 119.5 36.2 85.5 59.2 97.8 122.2 82.6
Calculate the variance for each data set. Which data set is more variable? Both are small populations.
| x | (x−μ) | (x−μ)2 |
|---|---|---|
| 11.7 | −1 | 1 |
| 13.7 | 1 | 1 |
| 10.5 | −2.2 | 4.84 |
| 14.2 | 1.5 | 2.25 |
| 13.9 | 1.2 | 1.44 |
| 14.2 | 1.5 | 2.25 |
| 10.4 | −2.3 | 5.29 |
| 16.1 | 3.4 | 11.56 |
| 16.4 | 3.7 | 13.69 |
| 4.8 | −7.9 | 62.41 |
| 15.2 | 2.5 | 6.25 |
| 13.0 | 0.3 | 0.09 |
| 14.4 | 1.7 | 2.89 |
| 12.7 | 0 | 0 |
| 8.6 | −4.1 | 16.81 |
| 12.9 | 0.2 | 0.04 |
| 11.5 | −1.2 | 1.44 |
| 14.6 | 1.9 | 3.61 |
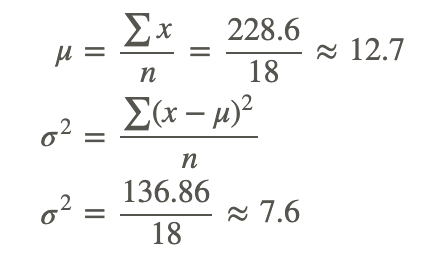
The variance of the data set is approximately 7.6 ∘C.
| x | (x−μ) | (x−μ)2 |
|---|---|---|
| 18.6 | −54.5 | 2970.3 |
| 37.1 | −36.0 | 1296 |
| 70.9 | −2.2 | 4.84 |
| 102.0 | 28.9 | 835.21 |
| 59.9 | −13.2 | 174.24 |
| 58.0 | −15.1 | 228.01 |
| 73.0 | −0.1 | 0.01 |
| 77.6 | 4.5 | 20.25 |
| 89.1 | 16.0 | 256 |
| 86.6 | 13.5 | 182.25 |
| 40.3 | −32.8 | 1075.8 |
| 119.5 | 46.4 | 2153 |
| 36.2 | −36.9 | 1361.6 |
| 85.5 | 12.4 | 153.76 |
| 59.2 | −13.9 | 193.21 |
| 97.8 | 24.7 | 610.09 |
| 122.2 | 49.1 | 2410.8 |
| 82.6 | 9.5 | 90.25 |
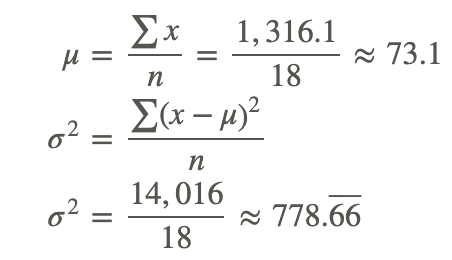
The variance of the data set is approximately 778.66 mm.
Therefore, the data values for the precipitation are more variable. This is indicated by the large variance of the data set.
Example
Example 1
A consumer advocacy magazine wants to compare 2 brands of incandescent lamps. The magazine took samples of each brand, with each sample consisting of 10 lamps. All of the lamps in both of the samples were allowed to burn as long as they could, and the times were recorded in hours. The following are the results obtained from the magazine. Calculate the variance of the samples of the 2 brands of incandescent lamps. Which brand has the more variable burning times?
| Brand A (Time in hours) | Brand B (Time in hours) |
|---|---|
| 760 | 820 |
| 790 | 900 |
| 800 | 810 |
| 780 | 790 |
| 850 | 810 |
| 790 | 800 |
| 750 | 850 |
| 820 | 820 |
| 810 | 920 |
| 800 | 890 |
Brand A
| x | (x−x̅) | (x−x̅)2 |
|---|---|---|
| 760 | −35 | 1,225 |
| 790 | −5 | 25 |
| 800 | 5 | 25 |
| 780 | −15 | 225 |
| 850 | 55 | 3,025 |
| 790 | −5 | 25 |
| 750 | −45 | 2,025 |
| 820 | 25 | 625 |
| 810 | 15 | 225 |
| 800 | 5 | 25 |
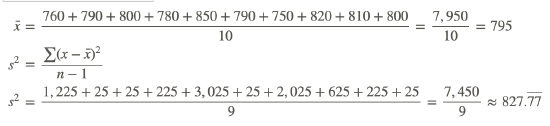
The variance of the burning times for Brand A is approximately 827.78 hours.
Brand B
| x | (x−x̅) | (x−x̅)2 |
|---|---|---|
| 820 | −21 | 441 |
| 900 | 59 | 3,481 |
| 810 | −31 | 961 |
| 790 | −51 | 2,601 |
| 810 | −31 | 961 |
| 800 | −41 | 1,681 |
| 850 | 9 | 81 |
| 820 | −21 | 441 |
| 920 | 79 | 6,241 |
| 890 | 49 | 2,401 |
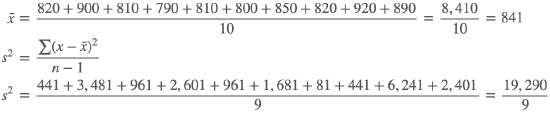
The variance of the burning times for Brand B is approximately 2,143.33 hours. Therefore, Brand B has the more variable burning times.
Review
- The following data was collected: 5 8 9 10 4 3 7 5 Fill in the chart below and calculate the variance. The data represents a small population.
| Data (x) | Mean (μ) | Data − Mean (x−μ) | Square of Data − Mean (x−μ)2 | |
|---|---|---|---|---|
| ∑ |
- What would the variance have been for question 1 had the data set represented a sample instead of a small population?
- The following data was collected. 11 15 16 12 19 17 14 18 15 10 Fill in the chart below and calculate the variance. The data represents a small population.
| Data (x) | Mean (μ) | Data − Mean (x−μ) | Square of Data − Mean (x−μ)2 | |
|---|---|---|---|---|
| ∑ |
- What would the variance have been for question 3 had the data set represented a sample instead of a small population?
- The following data was collected. 55 54 48 52 69 60 47 66 50 61 Fill in the chart below and calculate the variance. The data represents a small population.
| Data (x) | Mean (μ) | Data − Mean (x−μ) | Square of Data − Mean (x−μ)2 | |
|---|---|---|---|---|
| ∑ |
- What would the variance have been for question 5 had the data set represented a sample instead of a small population?
- The following data was collected: 26 30 20 27 23 33 19 26 Fill in the chart below and calculate the variance. The data represents a sample.
| Data (x) | Mean (x¯) | Data − Mean (x−x¯) | Square of Data − Mean (x−x¯)2 | |
|---|---|---|---|---|
| ∑ |
- What would the variance have been for question 7 had the data set represented a small population instead of a sample?
- The following data was collected: 85 99 89 90 10 48 29 51 10 Fill in the chart below and calculate the variance. The data represents a sample.
| Data (x) | Mean (x¯) | Data − Mean (x−x¯) | Square of Data − Mean (x−x¯)2 | |
|---|---|---|---|---|
| ∑ |
- What would the variance have been for question 9 had the data set represented a small population instead of a sample?
Vocabulary
| Term | Definition |
|---|---|
| variance | A measure of the spread of the data set equal to the mean of the squared variations of each data value from the mean of the data set. |
| absolute deviation | The absolute deviation is the sum total of how different each number is from the mean. |
| deviation | Deviation is a measure of the difference between a given value and the mean. |
| Mean | The mean of a data set is the average of the data set. The mean is found by calculating the sum of the values in the data set and then dividing by the number of values in the data set. |
| mean absolute deviation | The mean absolute deviation is an alternate measure of how spread out the data is. It involves finding the mean of the distance between each data value and the mean. While this method might seem more intuitive, in statistics it has been found to be too limited and is not commonly used. |
| Population | In statistics, the population is the entire group of interest from which the sample is drawn. |
| Sample | A sample is a specified part of a population, intended to represent the population as a whole. |
| Skew | To skew a given set means to cause the trend of data to favor one end or the other |
| standard deviation | The square root of the variance is the standard deviation. Standard deviation is one way to measure the spread of a set of data. |
Additional Resources
PLIX: Play, Learn, Interact, eXplore - Variance of a Data Set
Video: Variance of Normally Distributed Data Principles
Activities: Variance of a Data Set Discussion Questions
Study Aids: Describing Data
Practice: Variance of a Data Set
Real World: Driving Forces