
10.8: Kruskal-Wallis Test and Runs Test
- Page ID
- 5804
\( \newcommand{\vecs}[1]{\overset { \scriptstyle \rightharpoonup} {\mathbf{#1}} } \)
\( \newcommand{\vecd}[1]{\overset{-\!-\!\rightharpoonup}{\vphantom{a}\smash {#1}}} \)
\( \newcommand{\id}{\mathrm{id}}\) \( \newcommand{\Span}{\mathrm{span}}\)
( \newcommand{\kernel}{\mathrm{null}\,}\) \( \newcommand{\range}{\mathrm{range}\,}\)
\( \newcommand{\RealPart}{\mathrm{Re}}\) \( \newcommand{\ImaginaryPart}{\mathrm{Im}}\)
\( \newcommand{\Argument}{\mathrm{Arg}}\) \( \newcommand{\norm}[1]{\| #1 \|}\)
\( \newcommand{\inner}[2]{\langle #1, #2 \rangle}\)
\( \newcommand{\Span}{\mathrm{span}}\)
\( \newcommand{\id}{\mathrm{id}}\)
\( \newcommand{\Span}{\mathrm{span}}\)
\( \newcommand{\kernel}{\mathrm{null}\,}\)
\( \newcommand{\range}{\mathrm{range}\,}\)
\( \newcommand{\RealPart}{\mathrm{Re}}\)
\( \newcommand{\ImaginaryPart}{\mathrm{Im}}\)
\( \newcommand{\Argument}{\mathrm{Arg}}\)
\( \newcommand{\norm}[1]{\| #1 \|}\)
\( \newcommand{\inner}[2]{\langle #1, #2 \rangle}\)
\( \newcommand{\Span}{\mathrm{span}}\) \( \newcommand{\AA}{\unicode[.8,0]{x212B}}\)
\( \newcommand{\vectorA}[1]{\vec{#1}} % arrow\)
\( \newcommand{\vectorAt}[1]{\vec{\text{#1}}} % arrow\)
\( \newcommand{\vectorB}[1]{\overset { \scriptstyle \rightharpoonup} {\mathbf{#1}} } \)
\( \newcommand{\vectorC}[1]{\textbf{#1}} \)
\( \newcommand{\vectorD}[1]{\overrightarrow{#1}} \)
\( \newcommand{\vectorDt}[1]{\overrightarrow{\text{#1}}} \)
\( \newcommand{\vectE}[1]{\overset{-\!-\!\rightharpoonup}{\vphantom{a}\smash{\mathbf {#1}}}} \)
\( \newcommand{\vecs}[1]{\overset { \scriptstyle \rightharpoonup} {\mathbf{#1}} } \)
\( \newcommand{\vecd}[1]{\overset{-\!-\!\rightharpoonup}{\vphantom{a}\smash {#1}}} \)
\(\newcommand{\avec}{\mathbf a}\) \(\newcommand{\bvec}{\mathbf b}\) \(\newcommand{\cvec}{\mathbf c}\) \(\newcommand{\dvec}{\mathbf d}\) \(\newcommand{\dtil}{\widetilde{\mathbf d}}\) \(\newcommand{\evec}{\mathbf e}\) \(\newcommand{\fvec}{\mathbf f}\) \(\newcommand{\nvec}{\mathbf n}\) \(\newcommand{\pvec}{\mathbf p}\) \(\newcommand{\qvec}{\mathbf q}\) \(\newcommand{\svec}{\mathbf s}\) \(\newcommand{\tvec}{\mathbf t}\) \(\newcommand{\uvec}{\mathbf u}\) \(\newcommand{\vvec}{\mathbf v}\) \(\newcommand{\wvec}{\mathbf w}\) \(\newcommand{\xvec}{\mathbf x}\) \(\newcommand{\yvec}{\mathbf y}\) \(\newcommand{\zvec}{\mathbf z}\) \(\newcommand{\rvec}{\mathbf r}\) \(\newcommand{\mvec}{\mathbf m}\) \(\newcommand{\zerovec}{\mathbf 0}\) \(\newcommand{\onevec}{\mathbf 1}\) \(\newcommand{\real}{\mathbb R}\) \(\newcommand{\twovec}[2]{\left[\begin{array}{r}#1 \\ #2 \end{array}\right]}\) \(\newcommand{\ctwovec}[2]{\left[\begin{array}{c}#1 \\ #2 \end{array}\right]}\) \(\newcommand{\threevec}[3]{\left[\begin{array}{r}#1 \\ #2 \\ #3 \end{array}\right]}\) \(\newcommand{\cthreevec}[3]{\left[\begin{array}{c}#1 \\ #2 \\ #3 \end{array}\right]}\) \(\newcommand{\fourvec}[4]{\left[\begin{array}{r}#1 \\ #2 \\ #3 \\ #4 \end{array}\right]}\) \(\newcommand{\cfourvec}[4]{\left[\begin{array}{c}#1 \\ #2 \\ #3 \\ #4 \end{array}\right]}\) \(\newcommand{\fivevec}[5]{\left[\begin{array}{r}#1 \\ #2 \\ #3 \\ #4 \\ #5 \\ \end{array}\right]}\) \(\newcommand{\cfivevec}[5]{\left[\begin{array}{c}#1 \\ #2 \\ #3 \\ #4 \\ #5 \\ \end{array}\right]}\) \(\newcommand{\mattwo}[4]{\left[\begin{array}{rr}#1 \amp #2 \\ #3 \amp #4 \\ \end{array}\right]}\) \(\newcommand{\laspan}[1]{\text{Span}\{#1\}}\) \(\newcommand{\bcal}{\cal B}\) \(\newcommand{\ccal}{\cal C}\) \(\newcommand{\scal}{\cal S}\) \(\newcommand{\wcal}{\cal W}\) \(\newcommand{\ecal}{\cal E}\) \(\newcommand{\coords}[2]{\left\{#1\right\}_{#2}}\) \(\newcommand{\gray}[1]{\color{gray}{#1}}\) \(\newcommand{\lgray}[1]{\color{lightgray}{#1}}\) \(\newcommand{\rank}{\operatorname{rank}}\) \(\newcommand{\row}{\text{Row}}\) \(\newcommand{\col}{\text{Col}}\) \(\renewcommand{\row}{\text{Row}}\) \(\newcommand{\nul}{\text{Nul}}\) \(\newcommand{\var}{\text{Var}}\) \(\newcommand{\corr}{\text{corr}}\) \(\newcommand{\len}[1]{\left|#1\right|}\) \(\newcommand{\bbar}{\overline{\bvec}}\) \(\newcommand{\bhat}{\widehat{\bvec}}\) \(\newcommand{\bperp}{\bvec^\perp}\) \(\newcommand{\xhat}{\widehat{\xvec}}\) \(\newcommand{\vhat}{\widehat{\vvec}}\) \(\newcommand{\uhat}{\widehat{\uvec}}\) \(\newcommand{\what}{\widehat{\wvec}}\) \(\newcommand{\Sighat}{\widehat{\Sigma}}\) \(\newcommand{\lt}{<}\) \(\newcommand{\gt}{>}\) \(\newcommand{\amp}{&}\) \(\definecolor{fillinmathshade}{gray}{0.9}\)Kruskal-Wallis Test and Runs Test
In previous Concepts, we learned how to conduct nonparametric tests, including the sign test, the sign rank test, the rank sum test, and the rank correlation test. These tests allowed us to test hypotheses using data that did not meet the assumptions of being normally distributed or having homogeneity with respect to variance. In addition, each of these non-parametric tests had parametric counterparts.
In this Concept, we will examine another nonparametric test-the Kruskal-Wallis one-way analysis of variance (also known simply as the Kruskal-Wallis test). This test is similar to the ANOVA test, and the calculation of the test statistic is similar to that of the rank sum test. In addition, we will also explore something known as the runs test, which can be used to help decide if sequences observed within a data set are random.
Evaluating Hypotheses Using the Kruskal-Wallis Test
The Kruskal-Wallis test is the analog of the one-way ANOVA and is used when our data set does not meet the assumptions of normality or homogeneity of variance. However, this test has its own requirements: it is essential that the data set has identically shaped and scaled distributions for each group.
As we learned in Chapter 11, when performing the one-way ANOVA test, we establish the null hypothesis that there is no difference between the means of the populations from which our samples were selected. However, we express the null hypothesis in more general terms when using the Kruskal-Wallis test. In this test, we state that there is no difference in the distributions of scores of the populations. Another way of stating this null hypothesis is that the average of the ranks of the random samples is expected to be the same.
The test statistic for this test is the non-parametric alternative to the F-statistic. This test statistic is defined by the following formula:
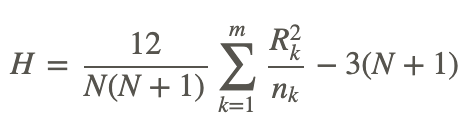
where:
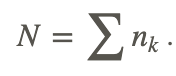
nk is number of observations in the kth sample.
Rk is the sum of the ranks in the kth sample.
m is the number of samples.
Like most nonparametric tests, the Kruskal-Wallis test relies on the use of ranked data to calculate a test statistic. In this test, the measurement observations from all the samples are converted to their ranks in the overall data set. The smallest observation is assigned a rank of 1, the next smallest is assigned a rank of 2, and so on. Similar to this procedure in the rank sum test, if two observations have the same value, we assign both of them the same rank.
Once the observations in all of the samples are converted to ranks, we calculate the test statistic, H, using the ranks and not the observations themselves. Similar to the other parametric and non-parametric tests, we use the test statistic to evaluate our hypothesis. For this test, the sampling distribution for H is the chi-square distribution with m−1 degrees of freedom, where m is the number of samples.
It is easy to use Microsoft Excel or a statistical programming package, such as SAS or SPSS, to calculate this test statistic and evaluate our hypothesis. However, for the purposes of this example, we will perform this test by hand.
Performing the Kruskal-Wallis Test
Suppose that a principal is interested in the differences among final exam scores from Mr. Red, Ms. White, and Mrs. Blue’s algebra classes. The principal takes random samples of students from each of these classes and records their final exam scores as shown:
| Mr. Red | Ms. White | Mrs. Blue |
|---|---|---|
| 52 | 66 | 63 |
| 46 | 49 | 65 |
| 62 | 64 | 58 |
| 48 | 53 | 70 |
| 57 | 68 | 71 |
| 54 | 73 |
Determine if there is a difference between the final exam scores of the three teachers.
Our hypothesis for the Kruskal-Wallis test is that there is no difference in the distributions of the scores of these three populations. Our alternative hypothesis is that at least two of the three populations differ. For this example, we will set our level of significance at α=0.05.
To test this hypothesis, we need to calculate our test statistic. To calculate this statistic, it is necessary to assign and sum the ranks for each of the scores in the table above as follows:
| Mr. Red | Overall Rank | Ms. White | Overall Rank | Mrs. Blue | Overall Rank |
|---|---|---|---|---|---|
| 52 | 4 | 66 | 13 | 63 | 10 |
| 46 | 1 | 49 | 3 | 65 | 12 |
| 62 | 9 | 64 | 11 | 58 | 8 |
| 48 | 2 | 53 | 5 | 70 | 15 |
| 57 | 7 | 68 | 14 | 71 | 16 |
| 54 | 6 | 73 | 17 | ||
| Rank Sum | 29 | 46 | 78 |
Using this information, we can calculate our test statistic as shown:
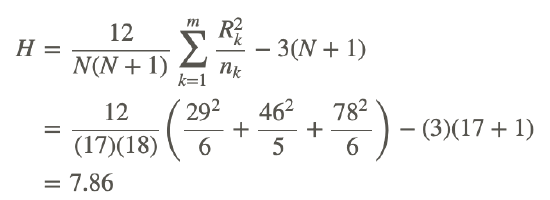
Using the chi-square distribution, we determine that with 3−1=2 degrees of freedom, our critical value at α=0.05 is 5.991. Since our test statistic of 7.86 exceeds the critical value, we can reject the null hypothesis that stated there is no difference in the final exam scores among students from the three different classes.
Determining the Randomness of a Sample Using the Runs Test
The runs test (also known as the Wald-Wolfowitz test) is another nonparametric test that is used to test the hypothesis that the samples taken from a population are independent of one another. We also say that the runs test checks the randomness of data when we are working with two variables. A run is essentially a grouping or a pattern of observations. For example, the sequence ++−−++−−++−− has six runs. Three of these runs are designated by two positive signs, and three of the runs are designated by two negative signs.
We often use the runs test in studies where measurements are made according to a ranking in either time or space. In these types of scenarios, one of the questions we are trying to answer is whether or not the average value of the measurement is different at different points in the sequence. For example, suppose that we are conducting a longitudinal study on the number of referrals that different teachers give throughout the year. After several months, we notice that the number of referrals appears to increase around the time that standardized tests are given. We could formally test this observation using the runs test.
Using the laws of probability, it is possible to estimate the number of runs that one would expect by chance, given the proportion of the population in each of the categories and the sample size. Since we are dealing with proportions and probabilities between discrete variables, we consider the binomial distribution as the foundation of this test. When conducting a runs test, we establish the null hypothesis that the data samples are independent of one another and are random. On the contrary, our alternative hypothesis states that the data samples are not random and/or not independent of one another.
The runs test can be used with either nominal or categorical data. When working with nominal data, the first step in conducting the test is to compute the mean of the data and then designate each observation as being either above the mean (i.e., +) or below the mean (i.e., -). Next, regardless of whether or not we are working with nominal or categorical data, we compute the number of runs within the data set. As mentioned, a run is a grouping of the variables.
Performing the Runs Test
1. In the following sequence, we would have 5 runs. We could also say that the sequence of the data switched five times.
++−−−−+++−+
After determining the number of runs, we also need to record each time a certain variable occurs and the total number of observations. In this example, we have 11 observations in total, with 6 positives (n1=6) and 5 negatives (n2=5).
With this information, we are able to calculate our test statistic using the following formulas:
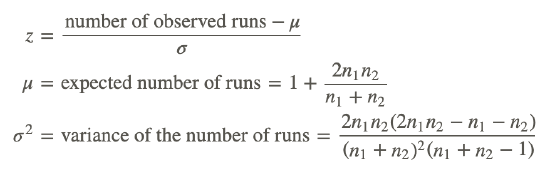
When conducting the runs test, we calculate the standard z-score and evaluate our hypotheses, just like we do with other parametric and non-parametric tests.
2. A teacher is interested in assessing if the seating arrangement of males and females in his classroom is random. He observes the seating pattern of his students and records the following sequence:
MFMMFFFFMMMFMFMMMMFFMFFMFFFF
Is the seating arrangement random? Use α=0.05.
To answer this question, we first generate the null hypothesis that the seating arrangement is random and independent. Our alternative hypothesis states that the seating arrangement is not random or independent. With α=0.05, we set our critical values at 1.96 standard scores above and below the mean.
To calculate the test statistic, we first record the number of runs and the number of each type of observation as shown:
R=14 M:n1=13 F:n2=15
With these data, we can easily compute the test statistic as follows:
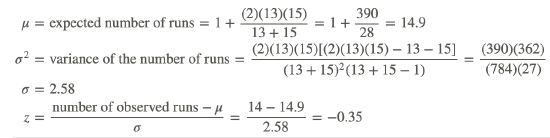
Since the calculated test statistic is not less than z=−1.96, our critical value, we fail to reject the null hypothesis and conclude that the seating arrangement of males and females is random.
Example
Example 1
Determine whether the following sequence of binary numbers is random:
1 0 0 1 1 0 1 1 1 1 1 1 1 1 1 0 1 1 0 0
There are eight runs, with a total of twelve 1's and and 8 0's.
R=8 0:n1=8 1:n2=12
With these data, we can easily compute the test statistic as follows:
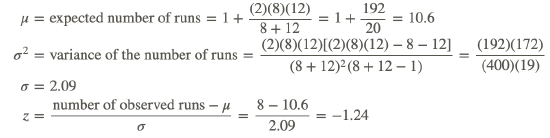
Since the calculated test statistic is not less than z=−1.96, our critical value associated with a significance level of 0.05, we fail to reject the null hypothesis and conclude that the sequence of binary numbers is random.
Review
- Suppose scores for 17 students from 3 schools in intermural competitions are as given below. Use the Kruskal-Wallis Test to test at the 5% level whether average scores for students from the three schools are the same.
School A: 29, 23, 33, 25, 20, 19
School B: 24, 31, 19, 26, 16, 18
School C: 26, 14, 13, 16, 30
- An investigator randomly sorts 21 wine aficionados into three groups, A, B and C. Each subject is interviewed and are asked to rank the overall quality of each of three wines on a 10-point scale, with 1 at the bottom of the scale and ten at the top. The three wines are the same for all subjects. What changes is the way in which the interview is conducted. The interview is designed to encourage a high expectation from group A, a low expectation in members of group C and a neutral expectation for members of group B. At the end of the study, each subject’s ratings are averaged across all three wines. The table below gives these averages for each subject in each group.
| Group A | Group B | Group C |
|---|---|---|
| 6.4 | 2.5 | 1.3 |
| 6.8 | 3.7 | 4.1 |
| 7.2 | 4.9 | 4.9 |
| 8.3 | 5.4 | 5.2 |
| 8.4 | 5.9 | 5.5 |
| 9.1 | 8.1 | 8.2 |
| 9.4 | 8.2 | |
| 9.7 |
The means are, A: 8.2, B: 5.5, C: 4.9.
a) State the null and alternative hypotheses.
b) Conduct a Kruskal-Wallis test.
c) What is your conclusion?
- Students are randomly assigned to groups that are taught French using three different methods. The scores of the final exam for the three groups are:
Method 1: 94 88 93 76 88 99
Method 2: 87 84 81 86 63 74 82
Method 3: 91 69 74 78 71
Use the Kruskal Wallis test statistic to determine if there is a significant difference in the mean score between these groups.
- A drug company is interested in testing three forms of a pain relief medicine. 27 volunteers were selected and 9 were randomly assigned to one of the three drug formulations. The subjects were instructed to take the drug during their next episode and to report pain on a scale of 1 to 10 (10 is the most pain). Following is the data:
Drug A: 4 5 4 3 2 4 3 4 4
Drug B: 8 10 6 7 6 8 7 9 8
Drug C: 8 9 8 8 9 7 9 7 7
Use the Kruskal Wallis test to determine if there is a significant difference among the three formulations of the drug.
- Below is a ranking of course averages for males (m) and females (f), ranked from high to low. Test whether the arrangement is random, at the 10% level.
f f m m m f m f f f m m m m m f f m m m f m m m f
For 6-10, determine whether the given series is random:
- 2 2 1 1 1 1 2 1 2 1 1 1 2 1 2 2 2 1 1 2 1 1 1 1 2 2 1 1 1 1 2 1 1 1 2 1
- 1 0 0 1 0 1 1 0 1 0 0 1 0 0 0 0 0 1 0 0
- 0 1 0 0 0 0 0 0 1 1 1 1 0 1 1 0 0 0 0 0
- 1 1 0 1 0 0 1 1 0 1 1 0 0 1 0 1 0 1 1 0
- 1 0 0 1 0 0 1 0 1 0 0 1 0 0 1 0 1 0 0 1
Vocabulary
| Term | Definition |
|---|---|
| Kruskal-Wallis test | The Kruskal-Wallis test is used when we are assessing the one-way variance of a specific variable in non-normal distributions. |
| Runs test | The runs test is a two-way ANOVA and used to compare groups classified by two different factors |
| Wald-Wolfowitz test | The Wald-Wolfowitz test (or the runs test) is a non-parametric test that is used to test the hypothesis that the samples taken from a population are independent of one another. |
Additional Resources
Video: The Kruskal-Wallis Test
Practice: Kruskal-Wallis Test and Runs Test