
3.3: III. Developing Central Ideas Based on Evidence
- Page ID
- 15127
\( \newcommand{\vecs}[1]{\overset { \scriptstyle \rightharpoonup} {\mathbf{#1}} } \)
\( \newcommand{\vecd}[1]{\overset{-\!-\!\rightharpoonup}{\vphantom{a}\smash {#1}}} \)
\( \newcommand{\id}{\mathrm{id}}\) \( \newcommand{\Span}{\mathrm{span}}\)
( \newcommand{\kernel}{\mathrm{null}\,}\) \( \newcommand{\range}{\mathrm{range}\,}\)
\( \newcommand{\RealPart}{\mathrm{Re}}\) \( \newcommand{\ImaginaryPart}{\mathrm{Im}}\)
\( \newcommand{\Argument}{\mathrm{Arg}}\) \( \newcommand{\norm}[1]{\| #1 \|}\)
\( \newcommand{\inner}[2]{\langle #1, #2 \rangle}\)
\( \newcommand{\Span}{\mathrm{span}}\)
\( \newcommand{\id}{\mathrm{id}}\)
\( \newcommand{\Span}{\mathrm{span}}\)
\( \newcommand{\kernel}{\mathrm{null}\,}\)
\( \newcommand{\range}{\mathrm{range}\,}\)
\( \newcommand{\RealPart}{\mathrm{Re}}\)
\( \newcommand{\ImaginaryPart}{\mathrm{Im}}\)
\( \newcommand{\Argument}{\mathrm{Arg}}\)
\( \newcommand{\norm}[1]{\| #1 \|}\)
\( \newcommand{\inner}[2]{\langle #1, #2 \rangle}\)
\( \newcommand{\Span}{\mathrm{span}}\) \( \newcommand{\AA}{\unicode[.8,0]{x212B}}\)
\( \newcommand{\vectorA}[1]{\vec{#1}} % arrow\)
\( \newcommand{\vectorAt}[1]{\vec{\text{#1}}} % arrow\)
\( \newcommand{\vectorB}[1]{\overset { \scriptstyle \rightharpoonup} {\mathbf{#1}} } \)
\( \newcommand{\vectorC}[1]{\textbf{#1}} \)
\( \newcommand{\vectorD}[1]{\overrightarrow{#1}} \)
\( \newcommand{\vectorDt}[1]{\overrightarrow{\text{#1}}} \)
\( \newcommand{\vectE}[1]{\overset{-\!-\!\rightharpoonup}{\vphantom{a}\smash{\mathbf {#1}}}} \)
\( \newcommand{\vecs}[1]{\overset { \scriptstyle \rightharpoonup} {\mathbf{#1}} } \)
\( \newcommand{\vecd}[1]{\overset{-\!-\!\rightharpoonup}{\vphantom{a}\smash {#1}}} \)
\(\newcommand{\avec}{\mathbf a}\) \(\newcommand{\bvec}{\mathbf b}\) \(\newcommand{\cvec}{\mathbf c}\) \(\newcommand{\dvec}{\mathbf d}\) \(\newcommand{\dtil}{\widetilde{\mathbf d}}\) \(\newcommand{\evec}{\mathbf e}\) \(\newcommand{\fvec}{\mathbf f}\) \(\newcommand{\nvec}{\mathbf n}\) \(\newcommand{\pvec}{\mathbf p}\) \(\newcommand{\qvec}{\mathbf q}\) \(\newcommand{\svec}{\mathbf s}\) \(\newcommand{\tvec}{\mathbf t}\) \(\newcommand{\uvec}{\mathbf u}\) \(\newcommand{\vvec}{\mathbf v}\) \(\newcommand{\wvec}{\mathbf w}\) \(\newcommand{\xvec}{\mathbf x}\) \(\newcommand{\yvec}{\mathbf y}\) \(\newcommand{\zvec}{\mathbf z}\) \(\newcommand{\rvec}{\mathbf r}\) \(\newcommand{\mvec}{\mathbf m}\) \(\newcommand{\zerovec}{\mathbf 0}\) \(\newcommand{\onevec}{\mathbf 1}\) \(\newcommand{\real}{\mathbb R}\) \(\newcommand{\twovec}[2]{\left[\begin{array}{r}#1 \\ #2 \end{array}\right]}\) \(\newcommand{\ctwovec}[2]{\left[\begin{array}{c}#1 \\ #2 \end{array}\right]}\) \(\newcommand{\threevec}[3]{\left[\begin{array}{r}#1 \\ #2 \\ #3 \end{array}\right]}\) \(\newcommand{\cthreevec}[3]{\left[\begin{array}{c}#1 \\ #2 \\ #3 \end{array}\right]}\) \(\newcommand{\fourvec}[4]{\left[\begin{array}{r}#1 \\ #2 \\ #3 \\ #4 \end{array}\right]}\) \(\newcommand{\cfourvec}[4]{\left[\begin{array}{c}#1 \\ #2 \\ #3 \\ #4 \end{array}\right]}\) \(\newcommand{\fivevec}[5]{\left[\begin{array}{r}#1 \\ #2 \\ #3 \\ #4 \\ #5 \\ \end{array}\right]}\) \(\newcommand{\cfivevec}[5]{\left[\begin{array}{c}#1 \\ #2 \\ #3 \\ #4 \\ #5 \\ \end{array}\right]}\) \(\newcommand{\mattwo}[4]{\left[\begin{array}{rr}#1 \amp #2 \\ #3 \amp #4 \\ \end{array}\right]}\) \(\newcommand{\laspan}[1]{\text{Span}\{#1\}}\) \(\newcommand{\bcal}{\cal B}\) \(\newcommand{\ccal}{\cal C}\) \(\newcommand{\scal}{\cal S}\) \(\newcommand{\wcal}{\cal W}\) \(\newcommand{\ecal}{\cal E}\) \(\newcommand{\coords}[2]{\left\{#1\right\}_{#2}}\) \(\newcommand{\gray}[1]{\color{gray}{#1}}\) \(\newcommand{\lgray}[1]{\color{lightgray}{#1}}\) \(\newcommand{\rank}{\operatorname{rank}}\) \(\newcommand{\row}{\text{Row}}\) \(\newcommand{\col}{\text{Col}}\) \(\renewcommand{\row}{\text{Row}}\) \(\newcommand{\nul}{\text{Nul}}\) \(\newcommand{\var}{\text{Var}}\) \(\newcommand{\corr}{\text{corr}}\) \(\newcommand{\len}[1]{\left|#1\right|}\) \(\newcommand{\bbar}{\overline{\bvec}}\) \(\newcommand{\bhat}{\widehat{\bvec}}\) \(\newcommand{\bperp}{\bvec^\perp}\) \(\newcommand{\xhat}{\widehat{\xvec}}\) \(\newcommand{\vhat}{\widehat{\vvec}}\) \(\newcommand{\uhat}{\widehat{\uvec}}\) \(\newcommand{\what}{\widehat{\wvec}}\) \(\newcommand{\Sighat}{\widehat{\Sigma}}\) \(\newcommand{\lt}{<}\) \(\newcommand{\gt}{>}\) \(\newcommand{\amp}{&}\) \(\definecolor{fillinmathshade}{gray}{0.9}\)23
III. Developing Central Ideas Based on Evidence
Emily van Zee and Elizabeth Gire
Unit 2 developed the central idea that heat and temperature are different ideas. The next exploration extends this development to examine what happens when water changes state.
A. Exploring the difference between heat and temperature during changes in states of matter
Question 3.2 What happens when ice melts, liquid water warms, and the liquid water eventually boils?
To explore changes in state, assemble:
- rice cooker, pot and hot plate, or pot and stove
- tray of ice cubes
- thermometer
- large binder clip.
We use a digital temperature probe connected to a computer that displays a continuous record of the temperature (see https://www.vernier.com/product-category/?category=temperature-sensors). We set the duration for 1800 seconds (30 minutes) and the temperature scale from about -5 °C to about 110°C. A regular bulb and tube thermometer will work if the scale ranges at least from a little below the freezing point of water (0°C) to a little above its boiling point (100°C).
- In the Before section of your physics notebook page, predict how the temperature of water changes when a container of ice cubes is placed on a heater and the ice melts, the liquid water warms, and then boils. Sketch a graph of temperature versus time to illustrate your prediction.
- What happens when ice melts, warms, and boils?
- Put some ice and a little water in a container that can be heated such as in a rice cooker or in a pot on a hot plate or on a stove. Place a thermometer or temperature probe connected to a computer in the ice.
- You can use a binder clip to keep the temperature probe or thermometer from touching the bottom of the pan as shown in Fig. 3.2.
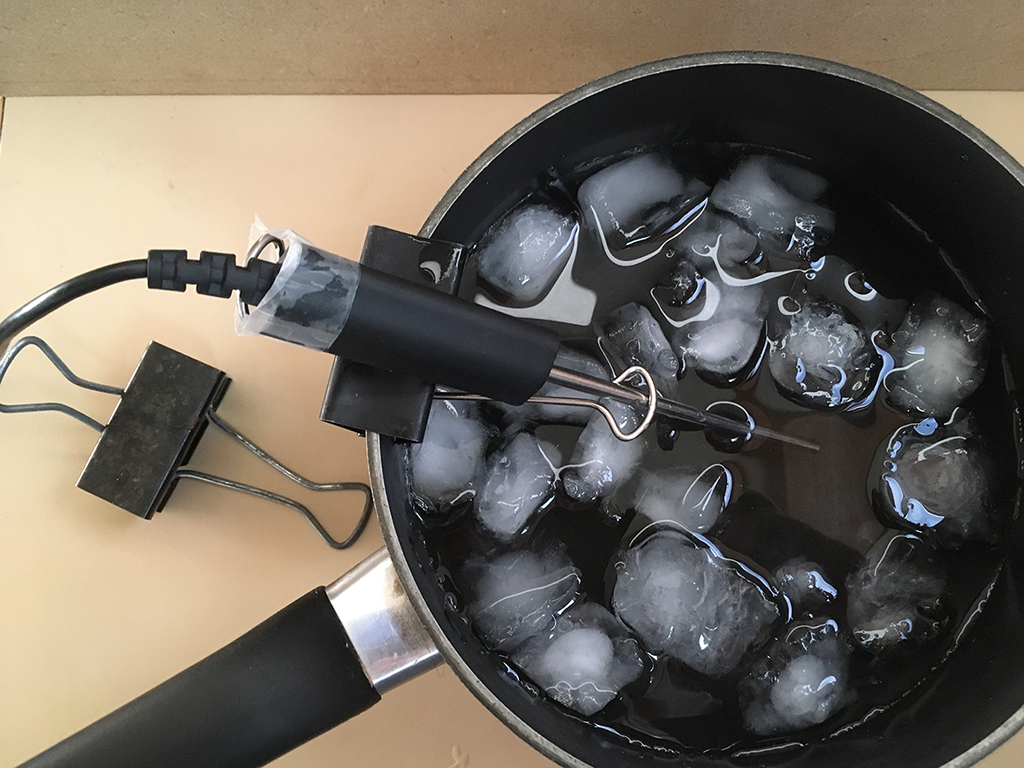
- Turn on the heat source and keep its level constant throughout this exploration so that energy is flowing at a constant rate into the system of the pot and the frozen, liquid, and finally boiling water.
- In the During section of your physics notebook page, record what happens to the temperature when you heat the ice.
- Be sure that the thermometer or temperature probe is not resting on the bottom of the rice cooker or pot but is measuring the temperature of the melting mixture of ice and liquid water. Stir occasionally to be sure the temperature is the same throughout the mixture of melting ice and liquid water.
- Leave the temperature probe in the warming liquid water, stirring as needed, and for a few minutes while the liquid water is boiling.
- If using a regular thermometer, stir and record the temperature repeatedly while the ice melts, the liquid water is warming, and boils.
- Draw and interpret a graph of the recorded temperatures as the ice melts, liquid water warms, and eventually boils.
- Discuss with your group members what the relation is between the energy flowing into the system and the temperature of the water in its various phases and phase changes. Formulate your insights into relevant central ideas.
- In the After section of the physics notebook page, report these ideas and the evidence on which they are based.
- Write a rationale that explains how the evidence supports the ideas and why these are important.
- Also reflect upon this exploration such as connections you can make to other experiences. How might you use what you learned in your own classroom?
- What are you still wondering?
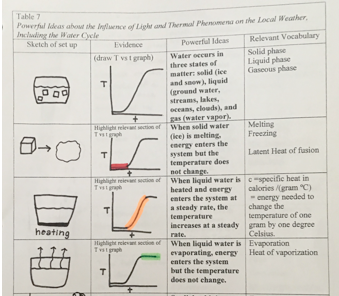
Enter notes in Table III.1 to represent this exploration:
| TABLE III.1 Central ideas about changes in states of matter | |||
|---|---|---|---|
| Sketch of set up | Evidence | Central Ideas | Relevant Vocabulary |
| Draw complete Temperature versus time graph | Water occurs in three states of matter: solid (ice), liquid, and gas (water vapor). | Solid phase Liquid phase Gaseous phase |
|
| Draw complete graph and highlight relevant section | When solid water (ice) is melting, energy enters the system but the temperature does not change. | Melting Freezing Latent heat of fusion for water (about 80 calories/gram) |
|
| Draw complete graph and highlight relevant section | When liquid water is heated and energy enters the system at a steady rate, the temperature increases at a steady rate. | c =specific heat in calories/(gram ºC) specific heat of water = one calorie/(g ºC) = energy needed to change the temperature of one gram of water by one degree Celsius. |
|
| Draw complete graph and highlight relevant section | When liquid water is evaporating, energy enters the system but the temperature does not change. | Evaporation Heat of vaporization for water (about 533 calories/gram) |
|
Complete documenting your exploration and writing a summary before looking at an example of student work and discussion of nuances about changes in states of matter.
1. Example of student work about changes in states of matter
Figure 3.1 shows a student’s entries into a table about changes in states of matter. The student’s summary of ideas about energy transfers during changes in states of matter also appears below.
Water occurs on Earth in three states of matter: solid (ice and snow), liquid (ground water, streams, oceans, clouds), and gas (water vapor).Water occurs on Earth in three states of matter. The first state of matter in which water occurs is as a solid. This is when water is in the form of snow or ice. When the same water is heated, it can be in the state of matter of a liquid. This is when water is in the form of ground water, streams, oceans, and clouds. When the same water is boiled, it can be in the state of matter of a gas. This is when the water is in the form of water vapor.
When solid water (ice) is melting, energy enters the system but the temperature does not change.(Row 1 of Fig. 3.1) shows a graph of Temperature vs. time. In row 2, the relevant part of the graph is highlighted. The highlighted part shows what is happening when solid water (ice) is melting. When the ice is melting, energy is entering the system. In the graph, it is seen that the temperature does not change, even though energy enters the system.
When liquid water is heated and energy enters the system at a steady rate, the temperature increases at a steady rate. (Row 1 of Fig. 3.1) shows a graph of Temperature vs. time. In row 3, the relevant part of the graph is highlighted. The highlighted part shows what is happening when liquid water is heated. When liquid water is heated, energy from the heat of the rice cooker is entering the system at a steady rate. The graph shows that the temperature is also increasing at a steady rate.
When liquid water is evaporating, energy enters the system but the temperature does not change. (Row 1 of Fig. 3.1) shows a graph of Temperature vs. time. In row 4, the relevant part of the graph is highlighted. The highlighted part shows what is happening when liquid water is evaporating. When liquid water is evaporating, energy is entering the system. The graph shows that the temperature does not change, even though energy enters the system.
Physics student, Spring 2016
This student has interpreted the flat areas of the graph as phase changes that occurred in which energy continued to flow into the system but the temperature did not change while the ice was melting and while the liquid water was evaporating.
2. Nuances about changes in states of matter
This exploration provides an example of refining understandings about the difference between heat and temperature by considering the context of application. Many students draw a straight line when predicting the graph of temperature versus time for melting ice, warming liquid water, and boiling. Such a straight line can seem reasonable given prior experiences in warming things up. A straight line is appropriate for the context of warming the liquid water. When liquid water is warming up, adding energy to the system at a steady rate increases the temperature at a steady rate and a straight inclined line on a temperature versus time graph represents that regular increase in temperature with time.
In the context of changes in state, however, the temperature does not change when adding energy to the system if ice is melting or liquid water is evaporating. The heater is supplying a constant flow of energy into the system of the pot of melting ice or boiling water but the temperature does not change. The temperature does not change because the energy is going into the melting process or into the evaporation process.
According to the learning progression for the structure of matter (PS1.A) articulated in the Next Generation Science Standards (Lead States, 2013), in the early elementary grades students are to focus upon observable properties such as whether a substance is a solid, liquid, or gas. Young students are not expected to envision what is happening to particles too small to see. By middle school, however, students are expected to understand that materials are composed of atoms and molecules, that atoms and molecules vibrate while bound together firmly in solids and loosely in liquids, and that atoms and molecules are free to move around in gases.
Changes in temperature involve changes in the kinetic energy of the molecules. Kinetic energy refers to energy associated with motion. Higher temperatures are associated with higher vibration rates among molecules in solids and liquids and with higher speeds for molecules in gases. See https://phet.colorado.edu/en/simulation/states-of-matter-basics for a simulation for the movement of water molecules in solid, liquid, and gaseous states.
During melting and evaporating, the incoming energy goes into breaking bonds between the molecules in solids and liquids rather than into increasing the rates of vibration. During freezing and condensing, energy is released as such bonds form among atoms and molecules.
The energy involved in changing states is known as latent heat. The adjective latent refers to something that is hidden or concealed. Latent heat refers to incoming or outgoing energy that is not detectable by a change in temperature. The energy needed to melt a gram of ice, the latent heat of melting, is about 80 calories. The energy released when a gram of liquid water freezes, the latent heat of fusion, also is about 80 calories. The energy needed to evaporate a gram of liquid water, the latent heat of vaporization, is about 533 calories. The energy released when a gram of water vapor condenses, the latent heat of condensation, is also about 533 calories.
Scientists and engineers design and use phase change materials to cool buildings. Microscopic pellets of phase change materials (PCM) added to insulation absorb energy as they melt during the day, for example, keeping a roof cool, and release energy as they freeze at night. See
https://www.pcm-ral.org/pcm/en/pcm for a discussion of latent heat and its engineering applications such as in designing ways to manage ambient temperatures in buildings. This is an example of Identifying situations that people want to change as a problem that can be solved through engineering, an aspect of engineering designthat children as young as K-2 are expected to understand according to the Next Generation Science Standards(NGSS, Lead States, 2013) (See NGSS Appendix I https://www.nextgenscience.org/resources/ngss-appendices.B. Exploring phase changes in which water absorbs or releases energy
The water cycle, sometimes called the hydrologic cycle, involves water in its many phases and phase changes. The phase changes occur both when water is absorbing energy as well as when it is releasing energy. Such phenomena are the focus of the next explorations.
Question 3.3 What are some everyday examples of water absorbing energy when water changes state?
Light from the Sun can supply energy for changing the phase of water.
You can explore such changes outside on a sunny day or inside with:
- lamp
- tray
- food coloring
- source of water
- large plastic bag
- houseplant
- access to the Internet.
- In the Before section of a physics notebook page, note some examples of phase changes of water that involve absorbing energy. What are some ways to explore these?
For example:
- What happens to puddles during a sunny day?
- Pour a little liquid water onto a tray. Add a drop of food coloring to make the puddle easier to see.
- Place the tray outside in sunlight or inside near a lamp shining on the puddle. What happens after 15 minutes? An hour?
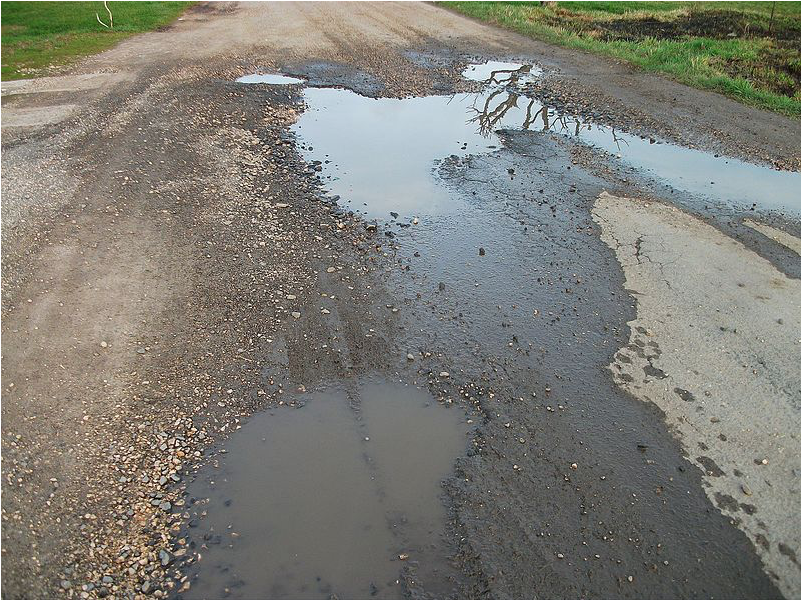
This phase change from liquid to gas is called evaporation. Fig. 3.4 illustrates puddles that are in the process of evaporating. How quickly a puddle evaporates depends upon the temperature and how much water is already in the air. The warmer the temperature, the more moisture the air can hold. For more information, see https://water.usgs.gov/edu/watercycleevaporation.html .
- What happens on a hot dry day when you sweat? How does sweating cool you off?
- What happens on a hot humid day? Why does sweating not cool you then?
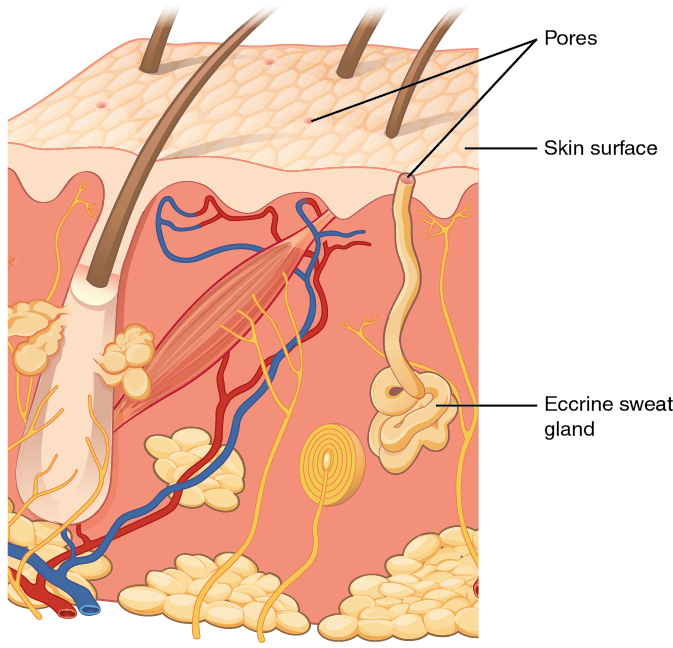
Sweat is a form of moisture calledperspiration. Fig. 3.5 illustrates the sweat glands in your skin. These help your body cool itself by producing perspiration that absorbs energy from your body when the moisture evaporates.
- What happens when sunlight shines on plants?
- Cover a houseplant with a plastic bag and place in sunlight outside or inside near a lamp so the lamp is shining on the plant as shown in Fig. 3.6. What happens after 15 minutes? An hour?
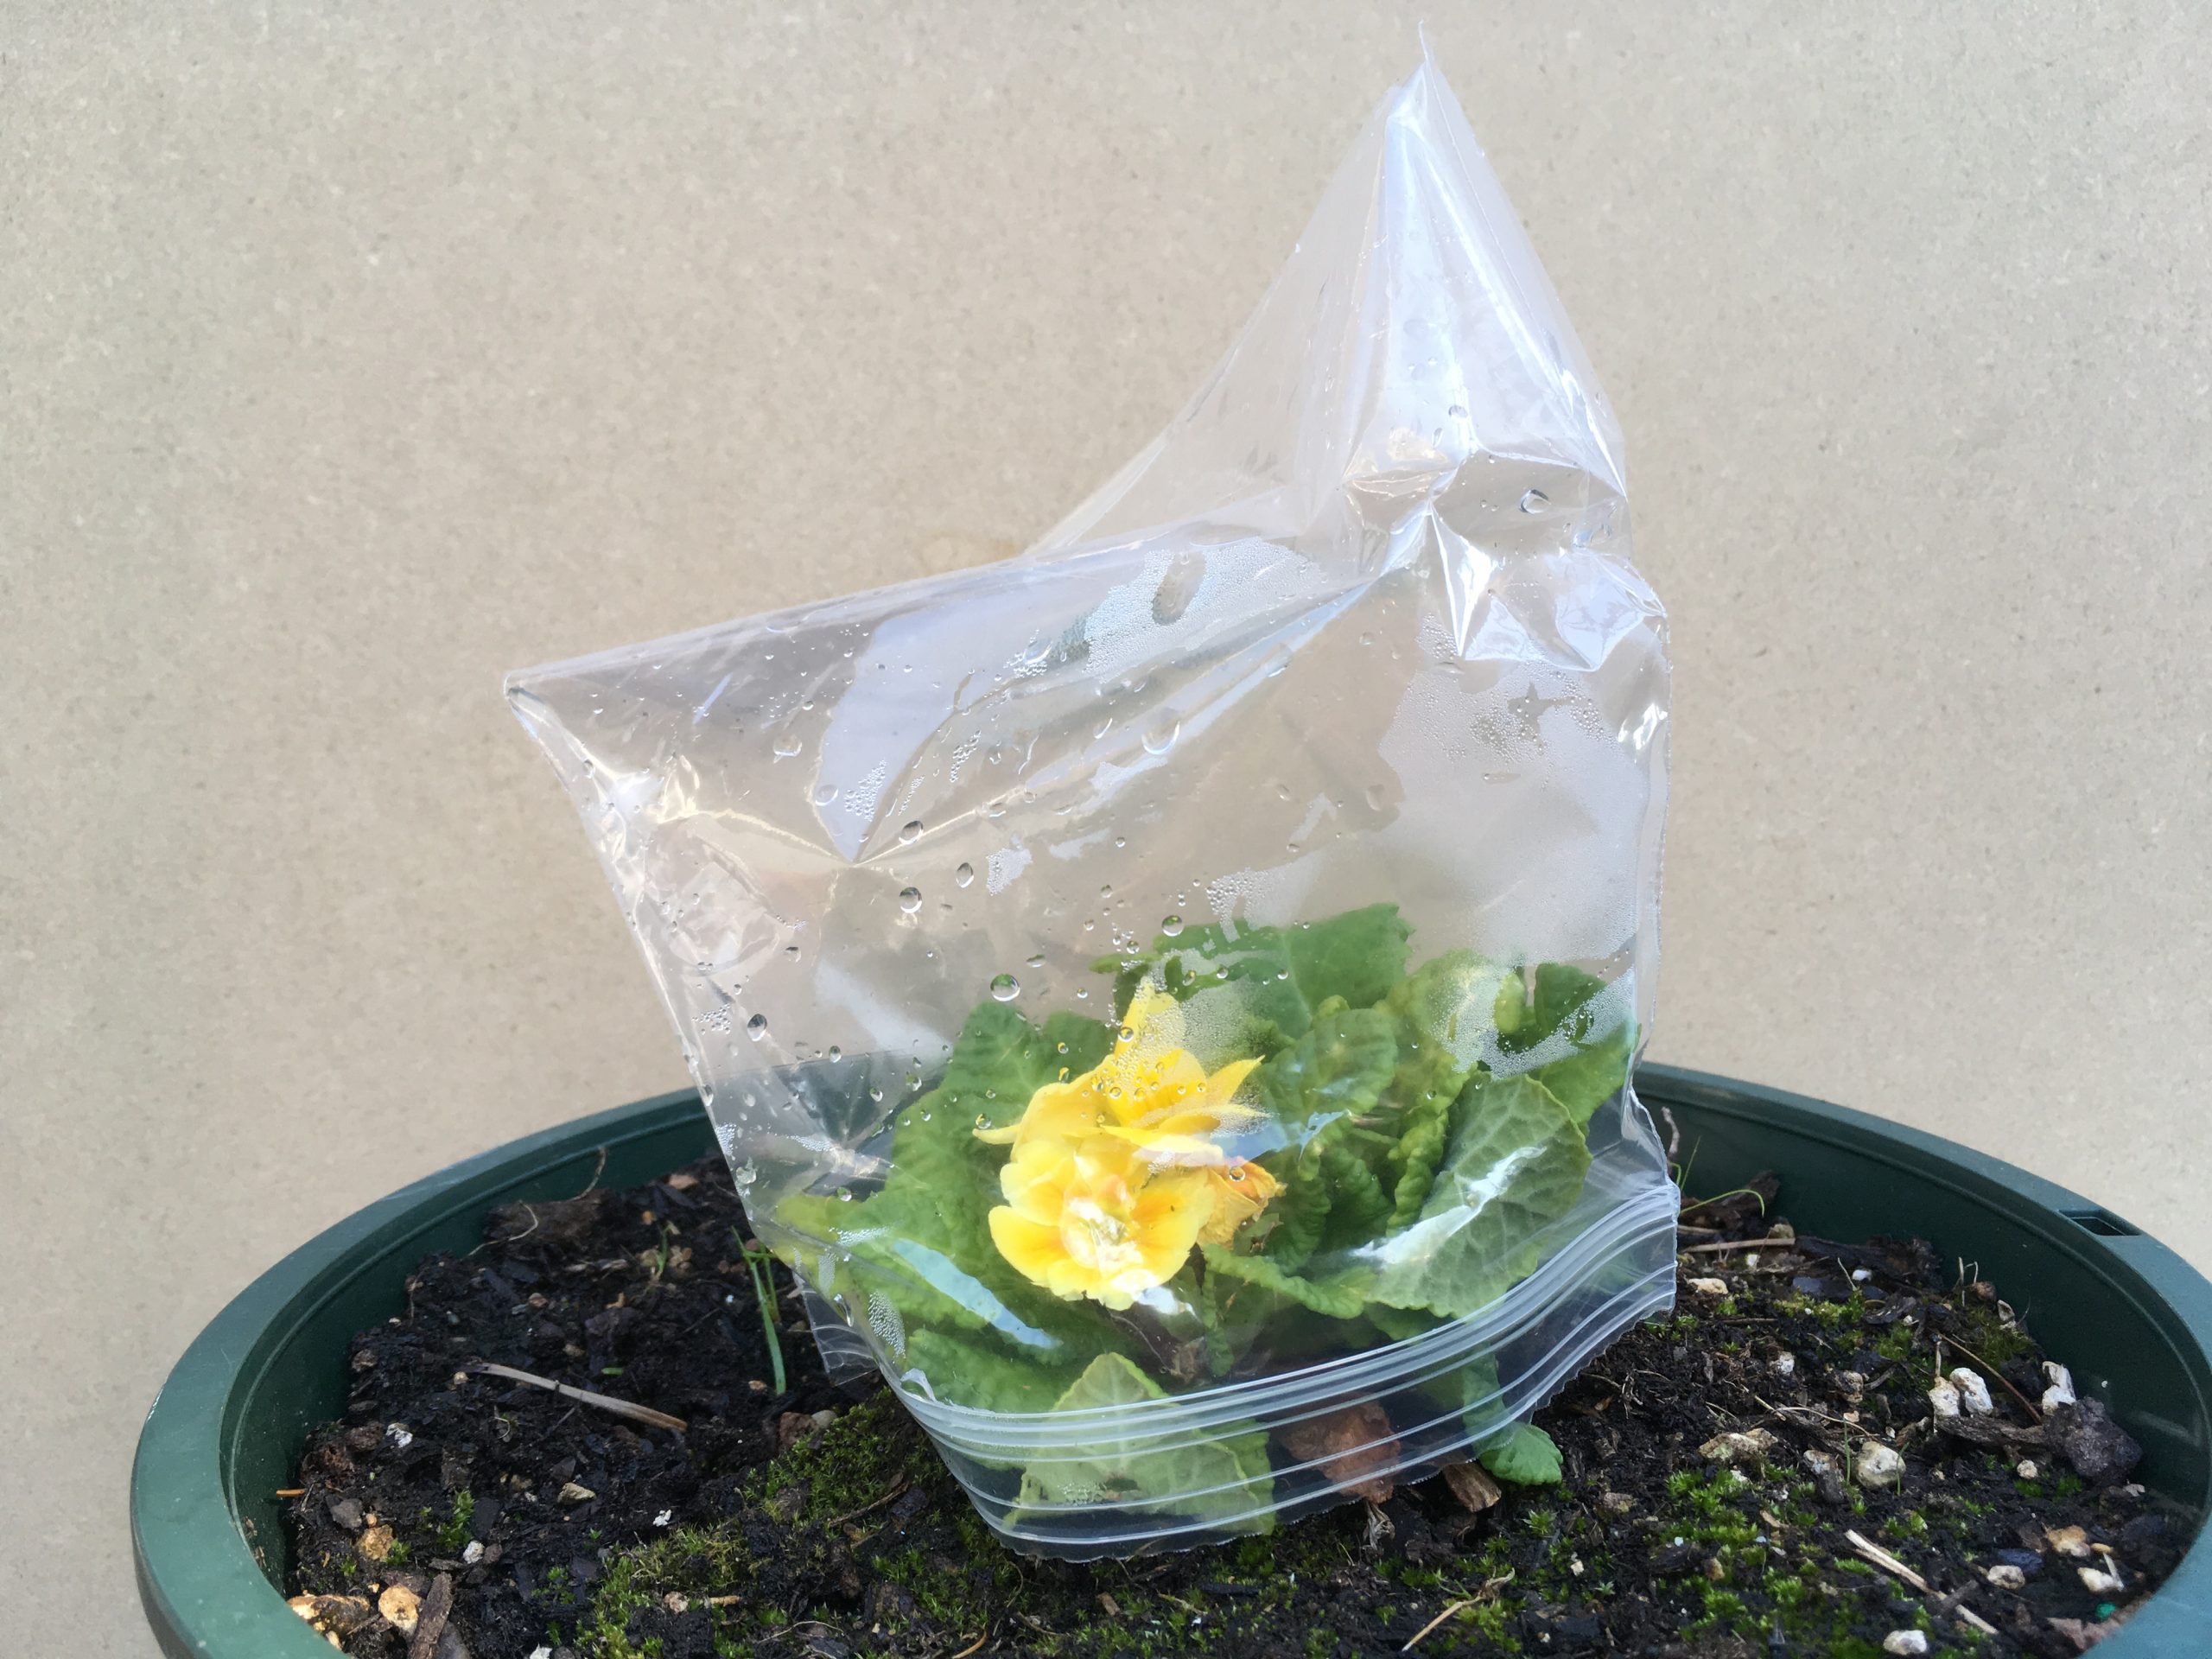
This form of evaporation is called transpiration. The drops of water that form on the plastic bag have evaporated from the leaves and then condensed on the cooler inner surface of the bag. Plants use some energy from the Sun to grow via photosynthesis; some energy from the Sun, however, is absorbed by liquid water evaporating from the leaves. Transpiration from an acre of corn, for example, can total as much as three to four thousand gallons of water each day (see https://water.usgs.gov/edu/watercycletranspiration.html).
- What sometimes happens to ice and snow on high mountains?
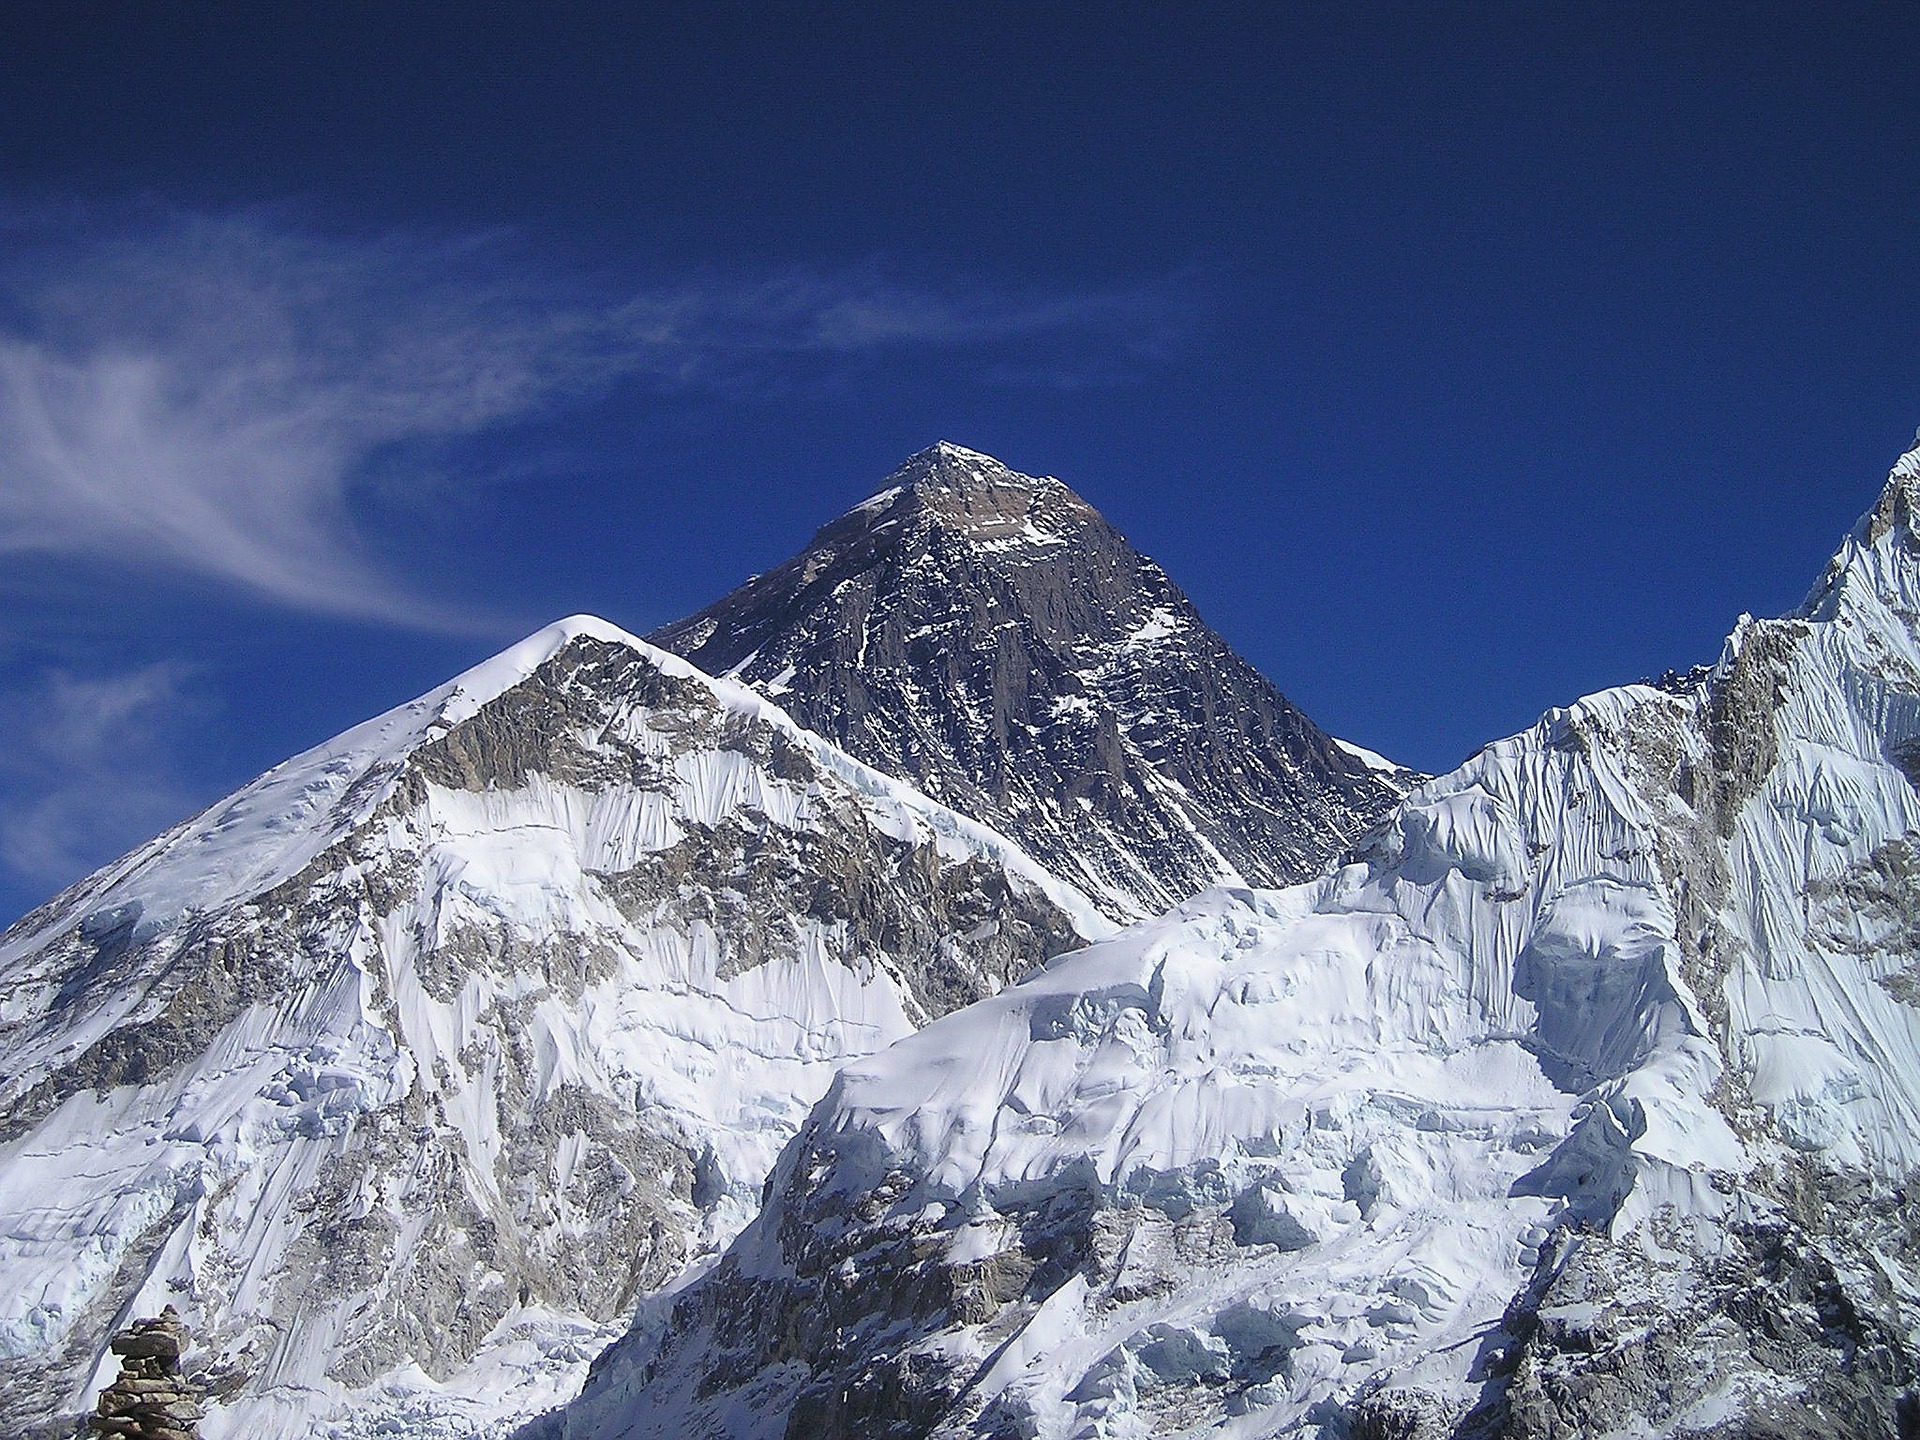
Another form of evaporation occurs when ice or snow changes directly into a gaseous form of water without a liquid phase as shown in Fig. 3.7. This form of evaporation is called sublimation. See https://water.usgs.gov/edu/watercyclesublimation.html for additional information about sublimation directly from a solid to a gas.
Water also absorbs energy when changing from a solid phase to a liquid:- What happens when ice warms?
- Place an ice cube outside in the sunlight or inside near a lamp so the lamp is shining on the ice cube as shown in Fig. 3.8. What happens after 15 minutes? An hour?
This phase change is called melting. During the summer melt season in the Arctic, more sea ice has been melting than sea water has been freezing during winter in recent years. (See the National Snow and Ice Data Center Arctic Sea Ice News and Analysis at https://nsidc.org). For information about melting snow and ice, see: https://water.usgs.gov/edu/watercyclesnowmelt.html.
As shown in Fig. 3.9, melting sea ice forms fresh water melt ponds in depressions in the surface.
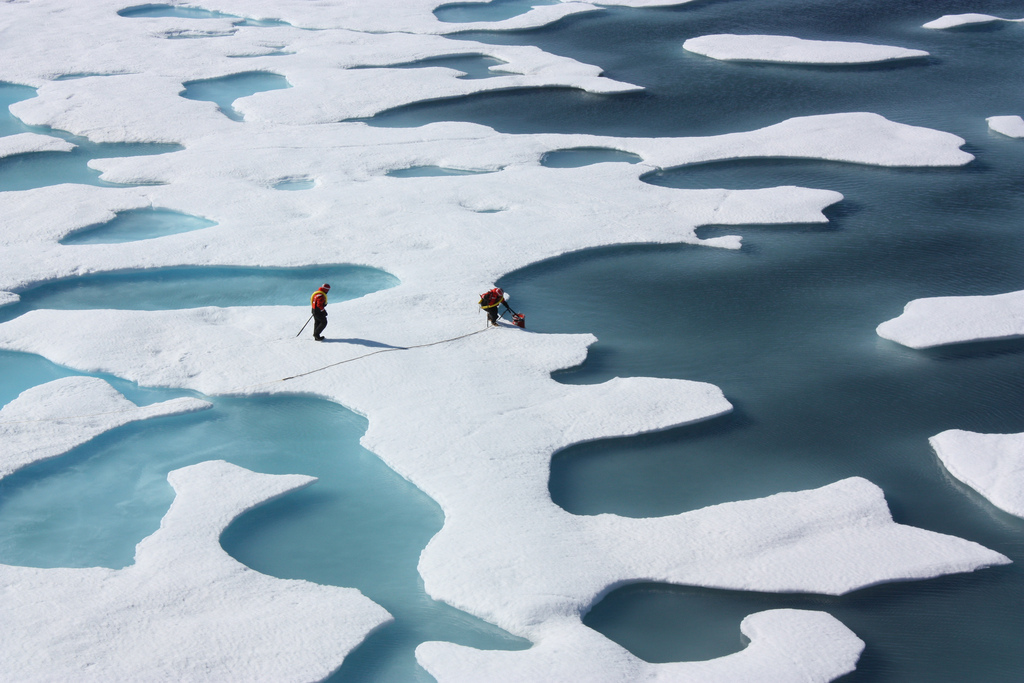
Image by Kathryn Hansen | NASA Goddard Space Flight Center used under CC BY 2.0 https://earthobservatory.nasa.gov/images/51335/ponds-on-the-ocean
- Record your findings, including sketches, in the During section of the physics notebook page
- Discuss these examples of phase changes that absorb energy and formulate some central ideas that summarize your findings. Record these in the After section of the physics notebook page.
- Write a rationale that explains how the evidence supports the ideas and why these are important.
Phase changes also occur in the opposite direction, when phase changes of water release rather than absorb energy.
Question 3.4 What are some everyday examples of water releasing energy when water changes state?
To explore such phase changes, you can use:
- ice cold glass of water
- tray
- wide mouth jar
- hot water to fill jar about half way
- small cup that fits in opening of jar or jar lid
- ice to put in the cup or on lid
- In the Before section of a new physics notebook page, note some examples of phase changes of water that involve releasing energy. What are some ways to explore these?
For example:
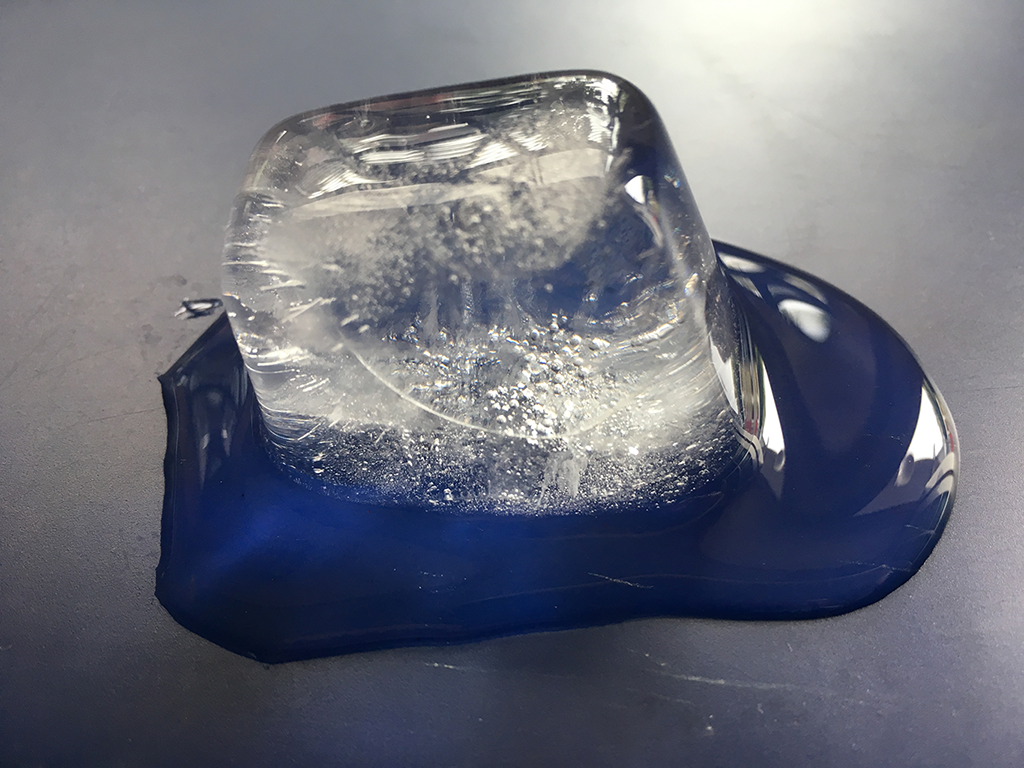
- What happens if you are wearing eyeglasses when you walk inside during winter? Or get out of a hot bath and look at a mirror?
- What happens if you bring an ice-cold container of water into a warm room? For an extra effect, use food coloring to make colored ice cubes and use those to cool the drink. What happens after 15 minutes? An hour? Are the water droplets that form on the outside of the container clear or the color of the melting ice cubes?
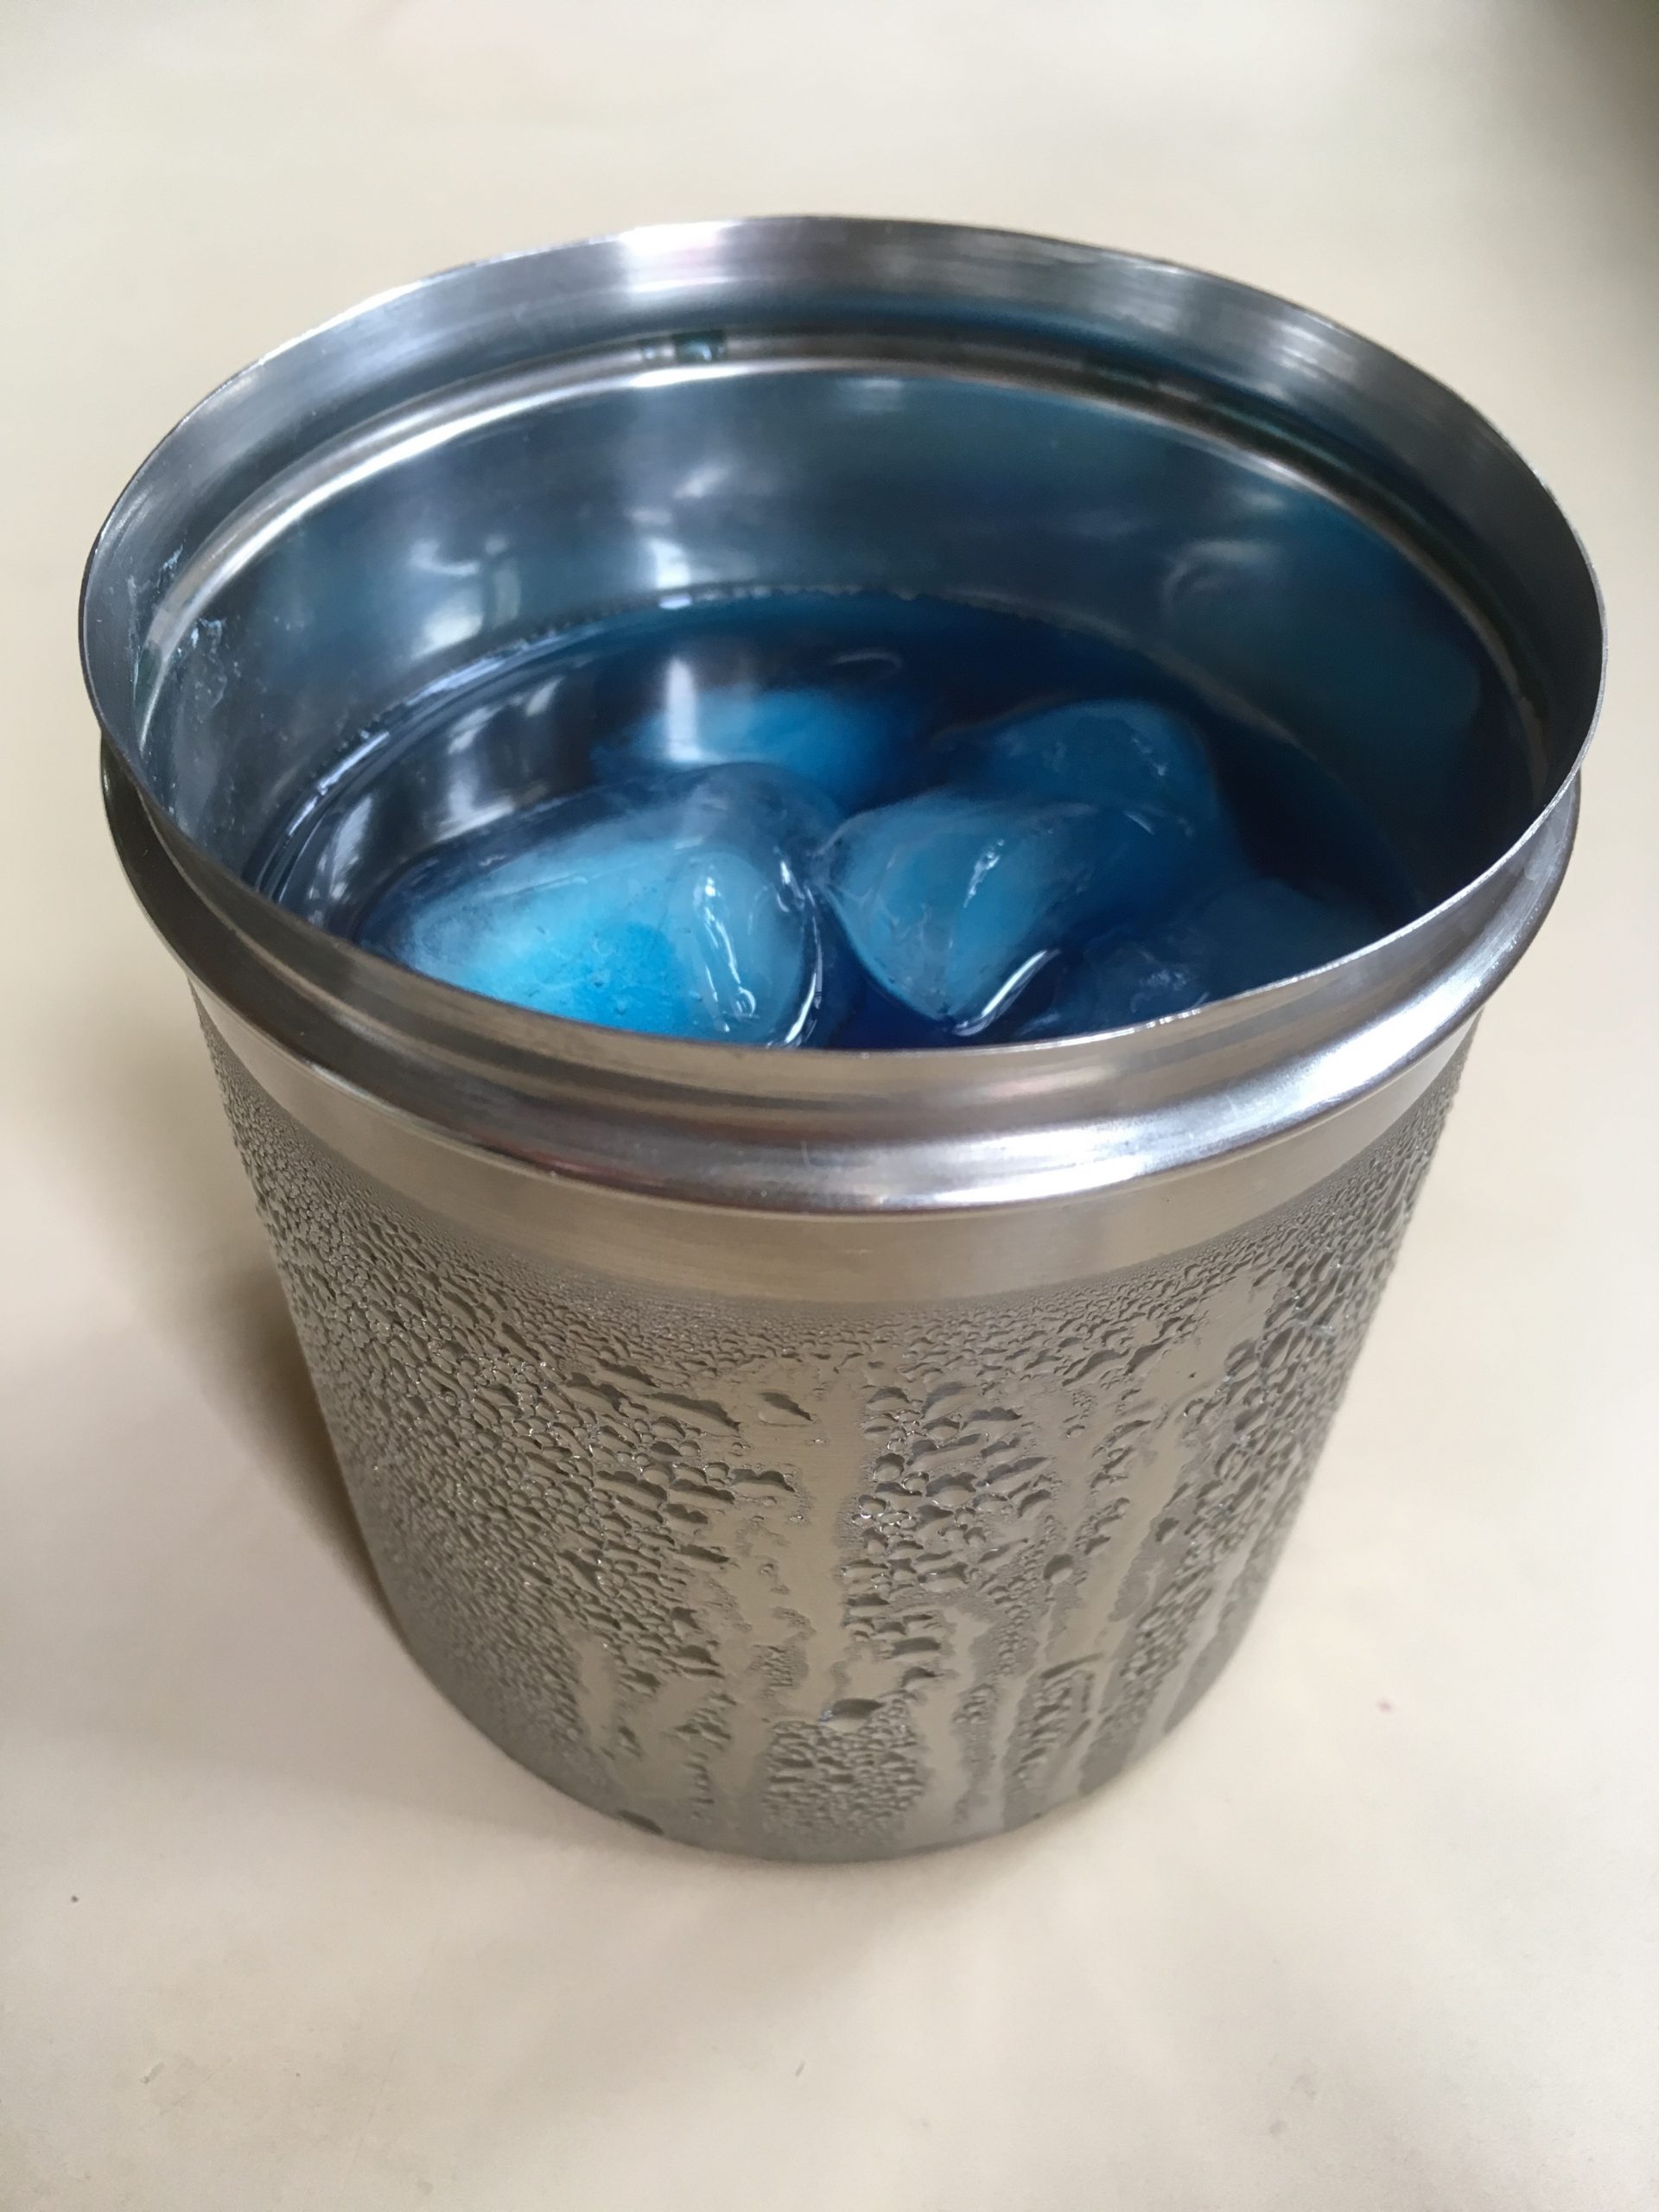
This phase change is called condensation. For more information, see https://water.usgs.gov/edu/watercyclecondensation.html. Read about the role of latent heat released from condensing water droplets in thunderclouds and hurricanes at http://climate.ncsu.edu/edu/Heat . As water vapor condenses into droplets, the heat released warms the surrounding air, causing instability in the cloud as the warm air rises.
What happens sometimes if liquid water in the atmosphere coalesces into very large droplets?
- Place a wide mouth jar on a tray. Pour some hot water into the jar, about half full. Place a cup of ice into the mouth of the jar so it just fits or simply put some ice on the upside-down lid on top of the jar. What happens after 15 minutes? An hour?
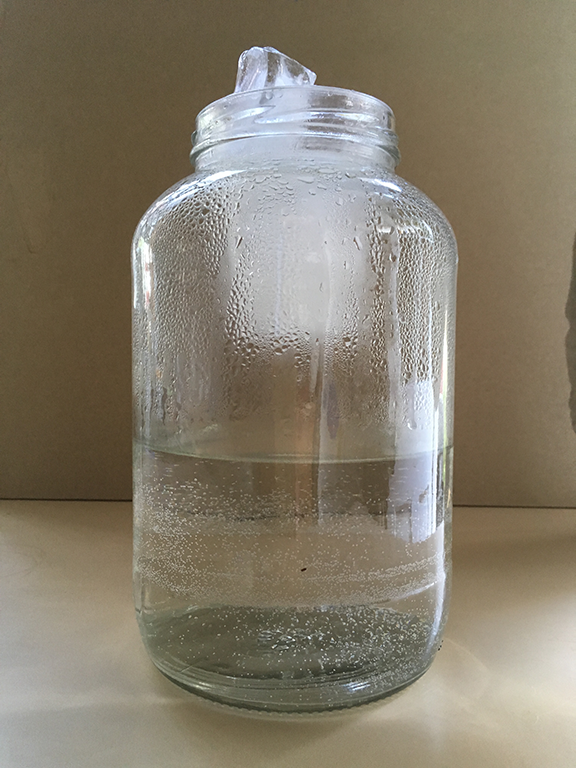
This is called precipitation. For more information, see https://water.usgs.gov/edu/watercycleprecipitation.html . The higher the average temperature of the atmosphere, the more water evaporates; the more water in the atmosphere, the more rainfall can occur. For information about changes in heavy rainfall events in the U.S, see http://climatesmartfarming.org/changing-climate/ .
What happens if liquid water gets cold enough?
If the temperature gets cold enough, a liquid freezes into a solid form. This can occur in a controlled situation in a refrigerator or in nature during a winter storm. As liquid water freezes, energy is released. Some farmers spray crops like oranges with water to protect the crops from freezing. Why would this work? See: http://fruitgrowersnews.com/article/protecting-your-fruit-from-frost-and-freeze/
- Record findings, including sketches, in the During section of this physics notebook page.
- Discuss these examples of phase changes that release energy and formulate relevant central ideas. In the After section of this physics notebook page, report these ideas and the evidence on which they are based.
- Write a rationale that explains how the evidence supports the ideas and why these are important.
- Also reflect upon these explorations of phases changes, both those that absorb and those that release energy. What connections can you make to other experiences? How might you use what you learned in your own classroom?
- What are you still wondering?
C. Exploring convection phenomena
Liquids and gases are called fluids. Fluids can flow from one place to another. When streams of warm and cool liquid water are flowing nearby, convection phenomena occur. Convection also occurs with nearby streams of warm and cool air.
Question 3.5 What happens when convection occurs?
To explore convection phenomena, you can use:
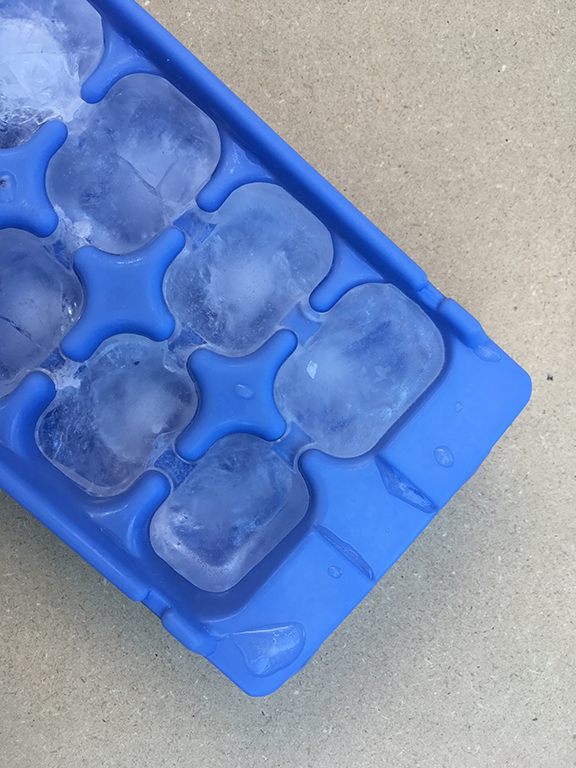
- blue food coloring
- ice cube tray to make blue ice cubes in a freezer
- clear plastic rectangular container such as a shoe storage box or a clear glass loaf dish
- four paper cups and one cup that can hold almost boiling water
- source of water to fill container
- red food coloring in small bottle or eyedropper
- very hot water (close to boiling)
- In the Before section of a physics notebook page, predict what you think will happen when a stream of warm water and a stream of cold water are flowing in a clear plastic or glass container of water. Also describe a way to explore such convection currents.
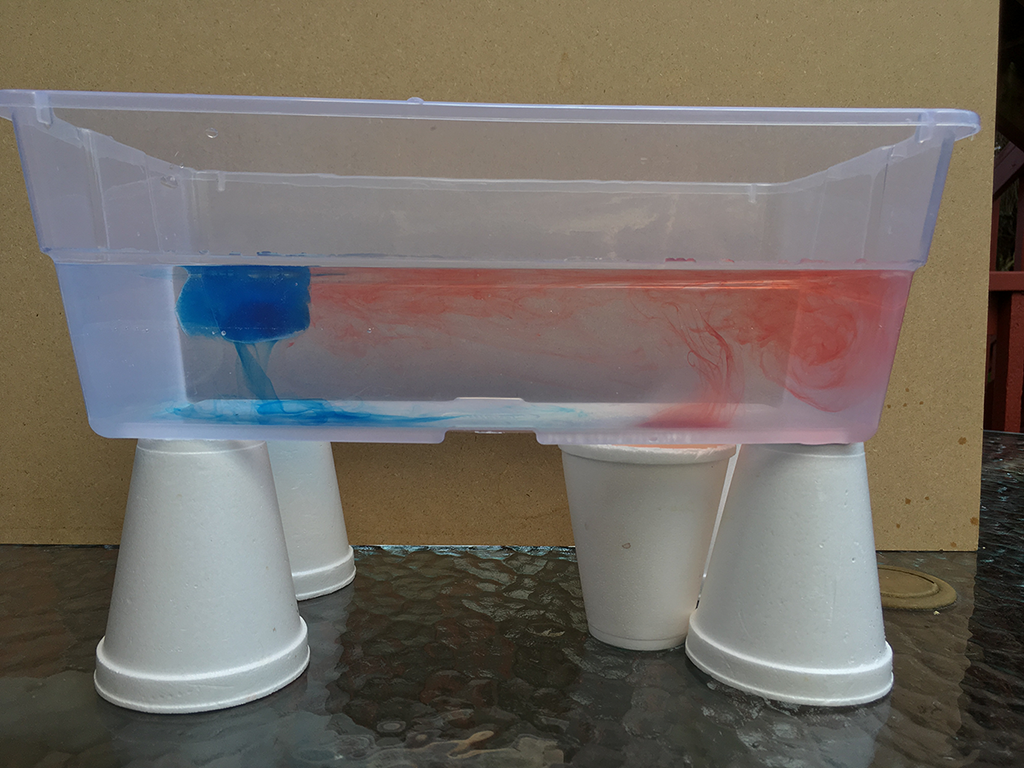
- Set four paper cups upside down at four corners of a rectangle so that they can support a rectangular container such as a clear plastic shoebox or glass loaf dish.
- Fill the clear container with room temperature water and place it on the 4 cups.
- Carefully use an eyedropper or small bottle of food coloring to place a red drop on the bottom of the clear container at one end.
- Choose a cup that can hold very hot water so that you can slide it underneath the clear container.
- Fill this cup with very hot (close to boiling) water. Slide the cup of hot water under the container so that it is positioned underneath the dot of red food coloring on the bottom of the container
- What happens to the water above the red dot?
- Carefully add some blue ice cubes to the water at the other end of the container.
- What happens to the blue water melting from the ice cubes?
- What happens to the blue and red streams of water?
- Record findings, including sketches, in the During section of this physics notebook page
- Discuss your findings and formulate a relevant central idea about convection currents. In the After section of the physics notebook page, report this idea and the evidence on which it is based.
- Write a rationale that explains how the evidence supports the idea and why this is important.
- Also reflect upon this exploration such as what connections can you make to other experiences? How might you use what you learned in your own classroom?
- What are you still wondering?
1. Nuances about convection phenomena
Convection phenomena occur when fluids differ in how dense they are. Density is a measure of how much mass a material has in a given volume. Something will sink in a fluid if it has more mass in a given volume than the fluid; something will rise in a fluid if it has less mass than the fluid in a given volume.
In this course, we measure mass in grams and volume in cubic centimeters. At standard atmospheric pressure, room temperature water (about 21ºC) has a density of about 0.998 grams per cubic centimeter. Hot water close to boiling (about 93ºC) has a density of about 0.963 grams per cubic centimeter, so it rises in the room temperature water. Cold water melting from an ice cube (about 4°) has a density of about 1.000 grams per cubic centimeter so it sinks in the room temperature water (see: https://water.usgs.gov/edu/density.html). These small differences in density of warm and cold water are enough to cause the convection currents observed.
Ocean currents are caused both by differences in temperature and by differences in salinity. Warm water from the tropics moves near the surface of the oceans toward the poles; cold water from the poles, being more dense, flows toward the tropics at a deeper level. Fresh water from melting glaciers reduces salinity; freezing sea ice leaves salt and other minerals behind in the ocean, increasing salinity with saltier water sinking and fresh water rising. Currents of water travel across the globe via the Great Ocean Conveyor Belt, which takes about 1000-1200 years for water to circulate throughout the global system (see: https://www.weather.gov/jetstream/circulation ).
D. Summarizing the water cycle
A variety of physical processes underlie the phases and changes-in-phases of water known as the water cycle.
Question 3.6 What is the water cycle?
The water cycle includes the phases of solid (ice and snow), liquid (ground water, lakes, streams, rivers, ocean), and gas (water vapor), in addition to the changes-in-phases known as freezing, melting, sublimating, evaporating, transpiring, perspiring, and condensing. Briefly describe each exploration in Table III.2.
Complete documenting your explorations and writing a summary before looking at an example of student work about explorations of the water cycle.
| TABLE III.2 Central ideas about the influence of light and thermal phenomena on local weather, including the water cycle | |||
|---|---|---|---|
| Sketch of set up | Evidence | Central Ideas | Relevant Vocabulary |
| The Sun radiates energy in all directions, some of which shines on the Earth. This process is called energy transfer by radiation. | Radiation https://www.windows2universe.org/sun/ spectrum/multispectral_sun_overview.html |
||
| Sunlight shining on Earth sometimes supplies enough energy for some liquid water in the soil or bodies of water to evaporate. | Evaporation http://water.usgs.gov/edu/ watercycleevaporation.html |
||
| Sunlight sometimes supplies enough energy for snow and ice to sublimate directly into the gaseous phase. | Sublimation http://water.usgs.gov/edu/ watercyclesublimation.html |
||
| Water also evaporates from plants. This is called transpiration. | Transpiration http://water.usgs.gov/edu/ watercycletranspiration.html |
||
| Water also evaporates from people. This is called perspiration. | Perspiration http://hyperphysics.phy-astr.gsu.edu/hbase/thermo/ sweat.html |
||
| Condensation occurs when warm moist air cools; gaseous water (water vapor) condenses into liquid water droplets to form clouds, fog, or dew. | Condensation http://water.usgs.gov/edu/ watercyclecondensation.html |
||
| Precipitation occurs when water droplets coalesce and fall to the Earth as rain, snow, or hail. | Precipitation http://water.usgs.gov/edu/ watercycleprecipitation.html Coalesce http://scijinks.jpl.nasa.gov/rain/ |
||
| Rain falls to Earth and water flows downhill due to the force by the Earth known as gravity. | Force of gravity by the Earth https://spaceplace.nasa.gov/what-is-gravity/en/ |
||
| Temperature differences within fluids cause differences in density. Less dense warm regions rise and more dense cool regions sink. This process is called energy transfer by convection. | Fluid Convection current https:// www.youtube.com/watch?v=IpHAj4R-Z8 |
||
| Water cycles among land, bodies of water, and the atmosphere. | Hydrosphere http://water.usgs.gov/ edu/watercycle.html |
||
1. Example of student work about explorations of the water cycle
Figure 3.15 shows a student’s entries into a table about phase changes and convection currents that occur during the water cycle.
| Sketch of set up | Evidence | Central Ideas | Relevant Vocabulary |
 |
|||
 |
|||
|
|||
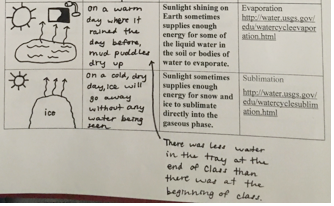
In row 1, which focused upon evaporation, the student drew a picture of a sun shining on a puddle with arrows pointing upward representing evaporating water, the natural phenomenon being modeled by the equipment drawn in the upper right corner, a tray with a puddle of water on which a lamp is shining. The student wrote, On a warm day where it rained the day before, mud puddles dry up and added the statement, There was less water in the tray at the end of class than there was at the beginning of class.
In row 2, which focused upon sublimation, the student drew a picture of the sun shining on ice on a mountain with arrows pointing upward representing water sublimating directly from ice into water vapor. The student wrote, On a cold, dry day, ice will go away without any water being seen.
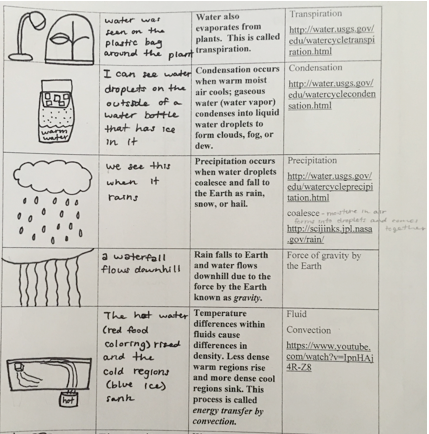
In row 3, which focused upon transpiration, the student drew a picture of a lamp shining on a plant enclosed in a clear plastic bag. The student wrote, Water was seen on the plastic bag around the plant.
In row 4, which focused upon condensation, the student drew a picture of a large jar filled part way with warm water, with a cup with ice cubes sitting in its opening, and droplets of water on the bottle. The student wrote, I can see water droplets on the outside of a water bottle that has ice in it.
In row 5, which focused upon precipitation, the student drew a picture of a rain falling from a cloud. The student wrote, We see this when it rains.
In row 6, which focused upon the force of gravity by the Earth, the student drew a picture of a waterfall and wrote, A water fall flows downhill.
In row 7, which focused upon convection, the student drew a picture of a clear plastic container filled with water, with a blue ice cube floating at the left end with melting blue water streaming down and with a hot cup under red food color at the right end with a stream of red water floating up and over toward the ice cube. The student wrote, The hot water (red food coloring) rised and the cold regions (blue ice) sank.
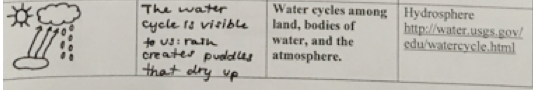
In row 8, which focused on the water cycle, the student drew a picture of the sun, shining on a puddle with arrows, representing evaporating water, pointing up toward a cloud and with raindrops falling down. The student wrote, The water cycle is visible to us: rain creates puddles that dry up.
The student wrote the following rationales for the central ideas claimed in the third column of the table:
Sunlight shining on Earth sometimes supplies enough energy for some of the liquid water in the soil and bodies of water to evaporate.My sketch of the evaporation demonstration is seen in (row 1of the table). For this demonstration, we had a tray of water, which represents some of the liquid water in the soil and bodies of water. There was also a lamp that was shining on the water, which represents the sunlight shining on the Earth. In this demonstration, we observed the water at the beginning of class and at the end of class. Since there was less water in the tray at the end of class than at the beginning of class, this shows that some water was evaporated. This model is a demonstration that shows that sunlight shining on earth sometimes supplies enough energy for some of the liquid water in the soil and bodies of water to evaporate.
Sunlight shining on Earth sometimes supplies enough energy for snow and ice to sublimate directly into the gaseous phase. Sublimation occurs if snow or ice vaporizes directly into the gaseous phases without first melting and going through the liquid phase.
Water also evaporates from plants. This is called transpiration. My sketch of the transpiration demonstration is seen in (row 3 of the table). For this demonstration, a plastic Ziploc bag was placed around a plant. A lamp was shining on the plant. Some water droplets were able to be seen on the bag, which demonstrates this process of water evaporating from plants, which is called transpiration.
Condensation occurs when warm moist air cools; gaseous water (water vapor) condenses into liquid water droplets to form clouds, fog, or dew. My sketch of the condensation experiment is seen in (row 4 of the table). For this experiment, a jar was filled with warm water. Then, a container with ice in it was placed on the top of the jar. The warm moist air that is in the jar, below the container, cools because of the ice in the container on the top of the jar. Water droplets form on the bottom of the container and on the sides of the jar, which is the gaseous water that has condensed into liquid water droplets. This process of the gaseous water condensing into liquid water droplets is how clouds form.
Precipitation occurs when water droplets condense, coalesce, and fall to the Earth as rain, snow, or hail. Rain falls to Earth and water flows downhill due to the force by the Earth known as gravity. My sketch of a precipitation demonstration is seen on (rows 5 and 6 of the table). First, I drew water droplets falling to the Earth as rain, which shows the process of precipitation. Then, I drew the water flowing downhill in the form of a waterfall, due to the force of gravity.
Temperature differences within fluids cause differences in density. Less dense warm regions rise and more dense cool regions sink. This process is called energy transfer by convection.My sketch of the convection experiment can be seen in (row 7 of the table). For this experiment, a container of room temperature water was placed on four cups. Warm water was colored red by food coloring and was warmed by very hot water that was placed directly below the food coloring. The warm water first rose up from the bottom of the container toward the top, and then it started moving horizontally along the top of the water toward the ice cube. Then, the blue ice cube that was placed on the top of the water was observed. The blue melted water first sank down to the bottom of the water and then it moved horizontally along the bottom of the container toward the red food coloring. These movements set up a circular current within the container. The hot water rising and the cold water sinking created convection currents. This idea of warm regions rising and cool regions sinking can also be seen in ocean currents.
Water cycles among land, bodies of water, and the atmosphere.Figure (3.3) shows the water cycle.
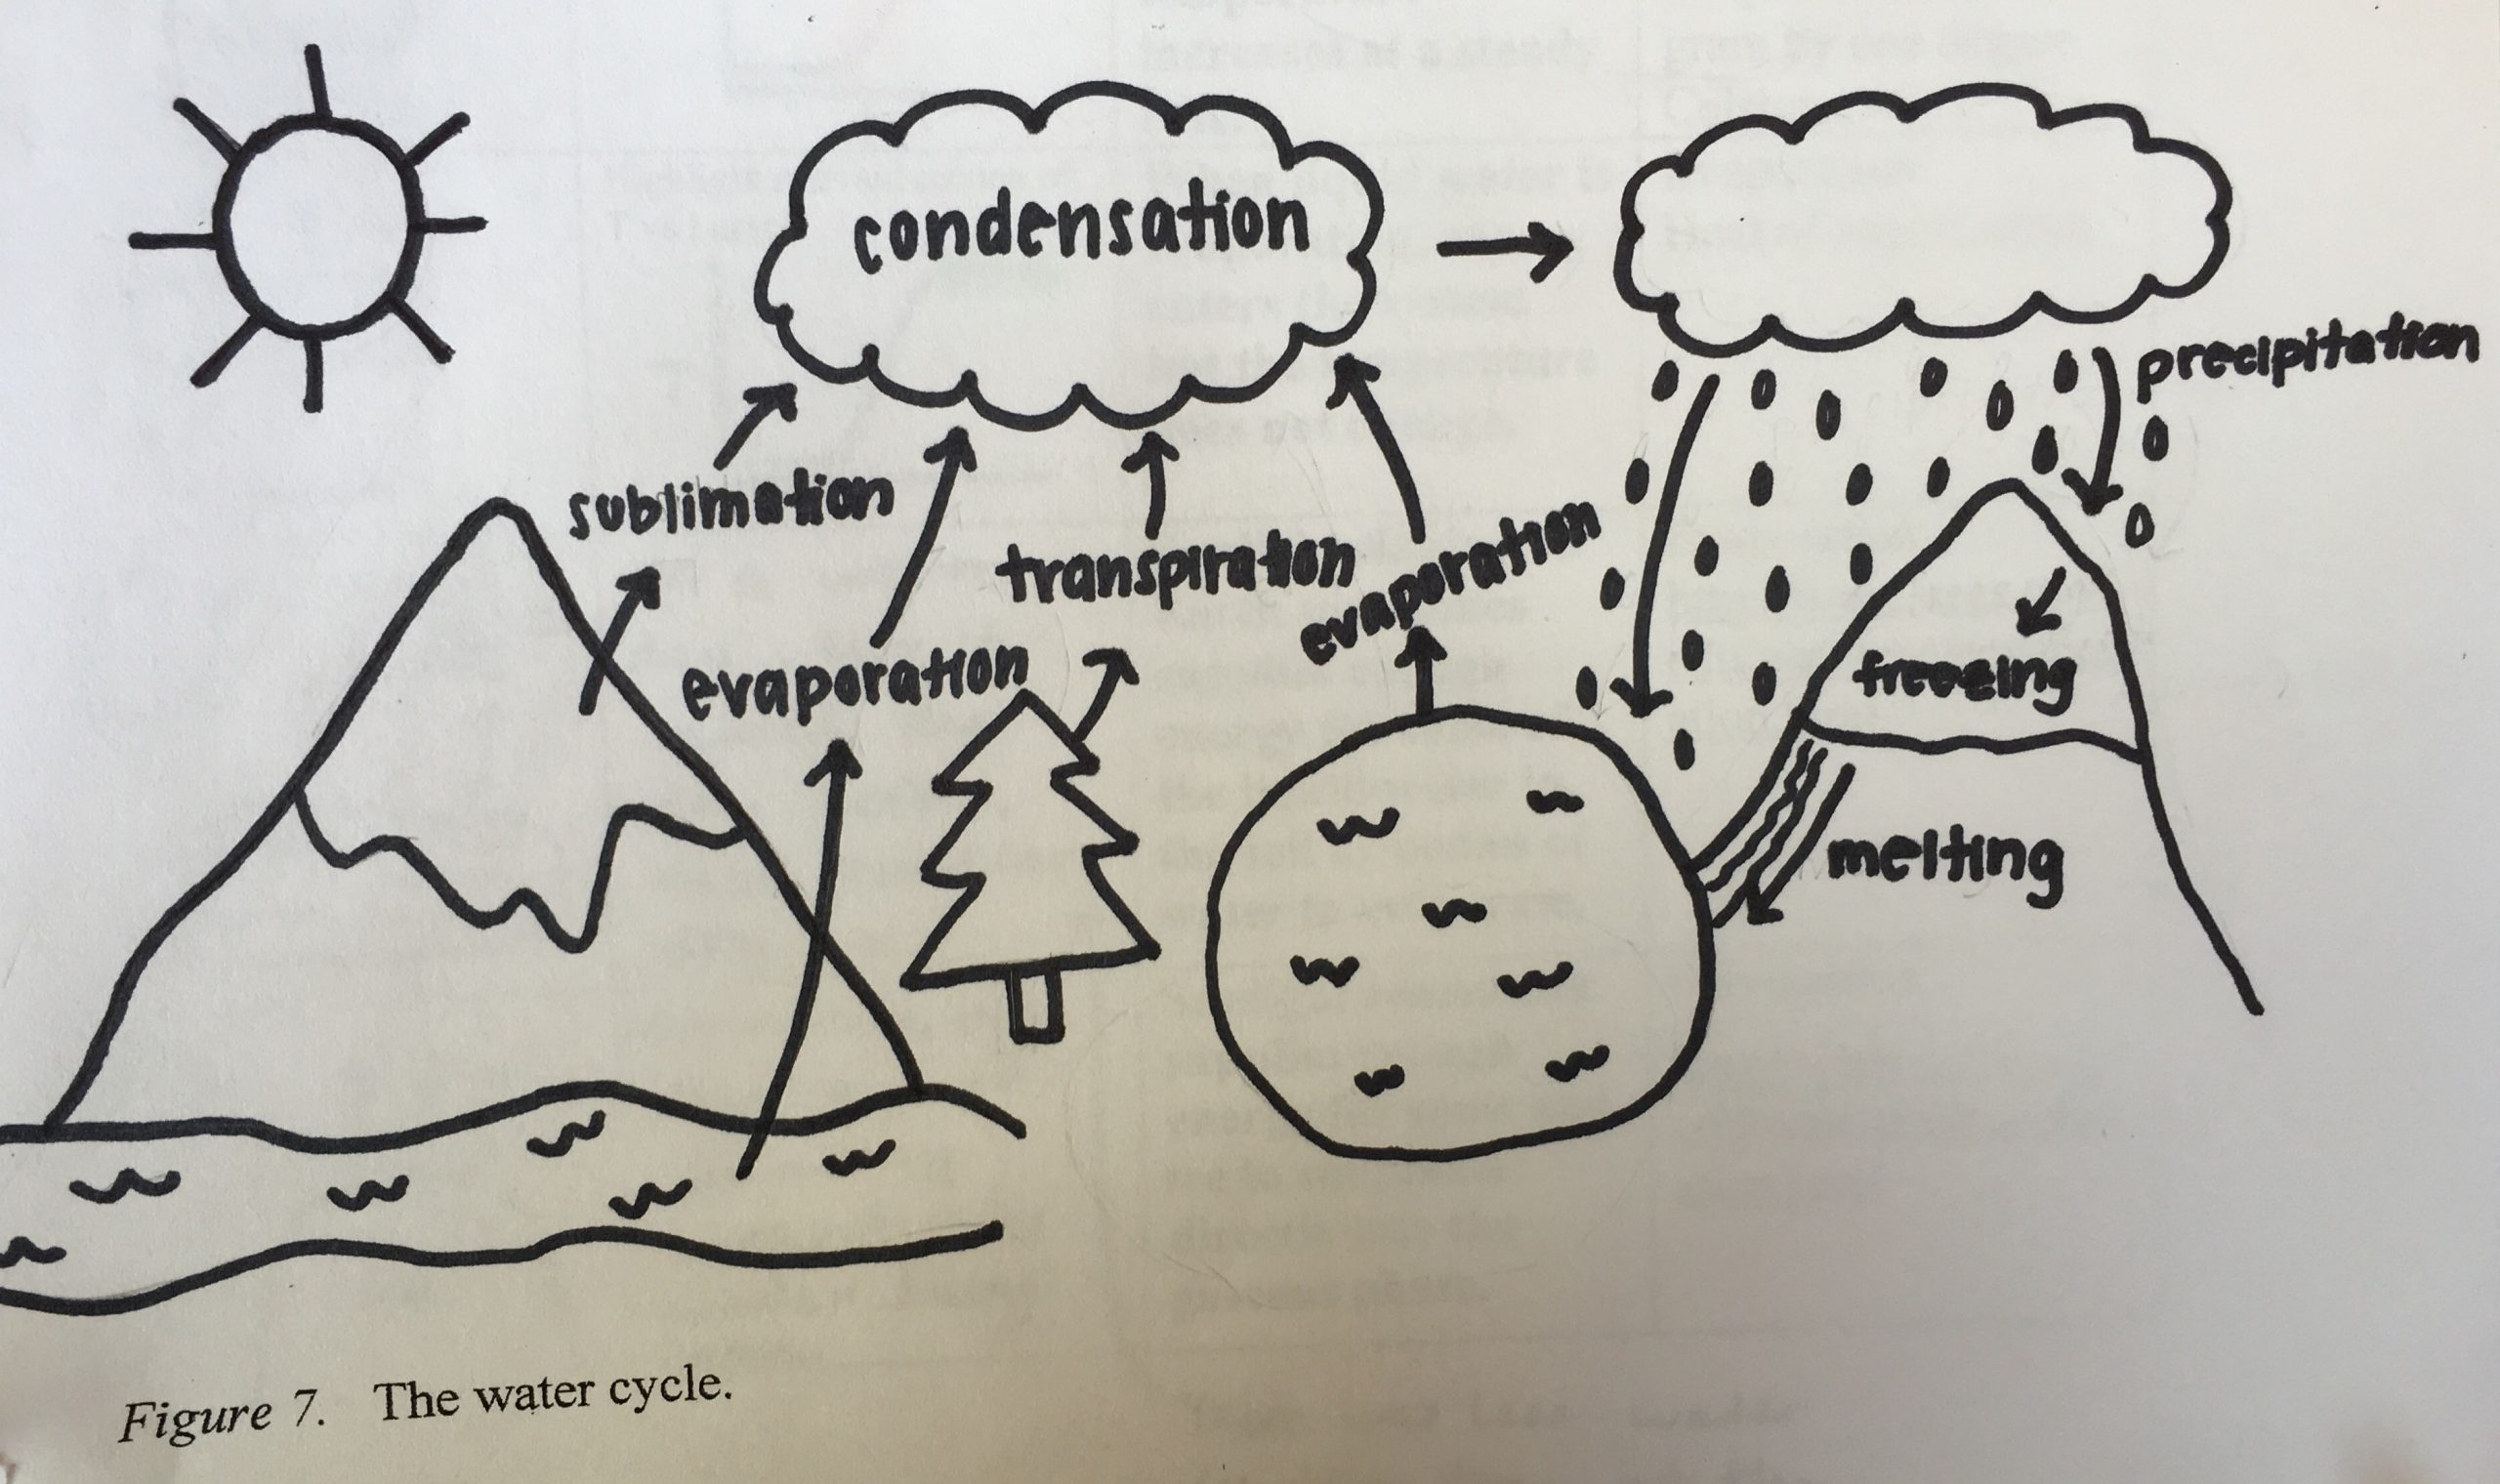
The student has included labels with the phase changes of evaporation, sublimation, transpiration, condensation, precipitation, freezing and melting as well as illustrations of snow on the mountains, rain falling, clouds in the sky, and bodies of liquid water on the Earth. The student described the water cycle as follows:
First of all, the sun heats up the water and turns it into water vapor. The water vapor leaves the source and goes into the air. The water vapor comes from different forms of water on earth such as lakes and rivers through the process of evaporation, it comes from plants through the process of transpiration, and it comes straight from ice or snow without melting first through the process of sublimation. Once the water vapor rises, it goes through the process of condensation. Condensation is when the water vapor in the air becomes cold and turns back into a liquid, forming clouds. Once enough water has condensed and the clouds are full, the water falls to the ground, which is known as precipitation. Some of the water falls back into oceans, lakes, rivers, or other water sources. Other parts of that water can be stored in ice or snow, which is known as freezing. Then, when that frozen snow or ice becomes liquid water again, this is known as melting. This process of the water cycle is continuous and will repeat itself again and again.
Physics student, Spring 2016
The next section develops some additional central ideas useful in explaining intriguing phenomena that students may experience when enjoying a sunny day at the beach.