
2.10: Market Failures
- Page ID
- 6769
\( \newcommand{\vecs}[1]{\overset { \scriptstyle \rightharpoonup} {\mathbf{#1}} } \)
\( \newcommand{\vecd}[1]{\overset{-\!-\!\rightharpoonup}{\vphantom{a}\smash {#1}}} \)
\( \newcommand{\dsum}{\displaystyle\sum\limits} \)
\( \newcommand{\dint}{\displaystyle\int\limits} \)
\( \newcommand{\dlim}{\displaystyle\lim\limits} \)
\( \newcommand{\id}{\mathrm{id}}\) \( \newcommand{\Span}{\mathrm{span}}\)
( \newcommand{\kernel}{\mathrm{null}\,}\) \( \newcommand{\range}{\mathrm{range}\,}\)
\( \newcommand{\RealPart}{\mathrm{Re}}\) \( \newcommand{\ImaginaryPart}{\mathrm{Im}}\)
\( \newcommand{\Argument}{\mathrm{Arg}}\) \( \newcommand{\norm}[1]{\| #1 \|}\)
\( \newcommand{\inner}[2]{\langle #1, #2 \rangle}\)
\( \newcommand{\Span}{\mathrm{span}}\)
\( \newcommand{\id}{\mathrm{id}}\)
\( \newcommand{\Span}{\mathrm{span}}\)
\( \newcommand{\kernel}{\mathrm{null}\,}\)
\( \newcommand{\range}{\mathrm{range}\,}\)
\( \newcommand{\RealPart}{\mathrm{Re}}\)
\( \newcommand{\ImaginaryPart}{\mathrm{Im}}\)
\( \newcommand{\Argument}{\mathrm{Arg}}\)
\( \newcommand{\norm}[1]{\| #1 \|}\)
\( \newcommand{\inner}[2]{\langle #1, #2 \rangle}\)
\( \newcommand{\Span}{\mathrm{span}}\) \( \newcommand{\AA}{\unicode[.8,0]{x212B}}\)
\( \newcommand{\vectorA}[1]{\vec{#1}} % arrow\)
\( \newcommand{\vectorAt}[1]{\vec{\text{#1}}} % arrow\)
\( \newcommand{\vectorB}[1]{\overset { \scriptstyle \rightharpoonup} {\mathbf{#1}} } \)
\( \newcommand{\vectorC}[1]{\textbf{#1}} \)
\( \newcommand{\vectorD}[1]{\overrightarrow{#1}} \)
\( \newcommand{\vectorDt}[1]{\overrightarrow{\text{#1}}} \)
\( \newcommand{\vectE}[1]{\overset{-\!-\!\rightharpoonup}{\vphantom{a}\smash{\mathbf {#1}}}} \)
\( \newcommand{\vecs}[1]{\overset { \scriptstyle \rightharpoonup} {\mathbf{#1}} } \)
\(\newcommand{\longvect}{\overrightarrow}\)
\( \newcommand{\vecd}[1]{\overset{-\!-\!\rightharpoonup}{\vphantom{a}\smash {#1}}} \)
\(\newcommand{\avec}{\mathbf a}\) \(\newcommand{\bvec}{\mathbf b}\) \(\newcommand{\cvec}{\mathbf c}\) \(\newcommand{\dvec}{\mathbf d}\) \(\newcommand{\dtil}{\widetilde{\mathbf d}}\) \(\newcommand{\evec}{\mathbf e}\) \(\newcommand{\fvec}{\mathbf f}\) \(\newcommand{\nvec}{\mathbf n}\) \(\newcommand{\pvec}{\mathbf p}\) \(\newcommand{\qvec}{\mathbf q}\) \(\newcommand{\svec}{\mathbf s}\) \(\newcommand{\tvec}{\mathbf t}\) \(\newcommand{\uvec}{\mathbf u}\) \(\newcommand{\vvec}{\mathbf v}\) \(\newcommand{\wvec}{\mathbf w}\) \(\newcommand{\xvec}{\mathbf x}\) \(\newcommand{\yvec}{\mathbf y}\) \(\newcommand{\zvec}{\mathbf z}\) \(\newcommand{\rvec}{\mathbf r}\) \(\newcommand{\mvec}{\mathbf m}\) \(\newcommand{\zerovec}{\mathbf 0}\) \(\newcommand{\onevec}{\mathbf 1}\) \(\newcommand{\real}{\mathbb R}\) \(\newcommand{\twovec}[2]{\left[\begin{array}{r}#1 \\ #2 \end{array}\right]}\) \(\newcommand{\ctwovec}[2]{\left[\begin{array}{c}#1 \\ #2 \end{array}\right]}\) \(\newcommand{\threevec}[3]{\left[\begin{array}{r}#1 \\ #2 \\ #3 \end{array}\right]}\) \(\newcommand{\cthreevec}[3]{\left[\begin{array}{c}#1 \\ #2 \\ #3 \end{array}\right]}\) \(\newcommand{\fourvec}[4]{\left[\begin{array}{r}#1 \\ #2 \\ #3 \\ #4 \end{array}\right]}\) \(\newcommand{\cfourvec}[4]{\left[\begin{array}{c}#1 \\ #2 \\ #3 \\ #4 \end{array}\right]}\) \(\newcommand{\fivevec}[5]{\left[\begin{array}{r}#1 \\ #2 \\ #3 \\ #4 \\ #5 \\ \end{array}\right]}\) \(\newcommand{\cfivevec}[5]{\left[\begin{array}{c}#1 \\ #2 \\ #3 \\ #4 \\ #5 \\ \end{array}\right]}\) \(\newcommand{\mattwo}[4]{\left[\begin{array}{rr}#1 \amp #2 \\ #3 \amp #4 \\ \end{array}\right]}\) \(\newcommand{\laspan}[1]{\text{Span}\{#1\}}\) \(\newcommand{\bcal}{\cal B}\) \(\newcommand{\ccal}{\cal C}\) \(\newcommand{\scal}{\cal S}\) \(\newcommand{\wcal}{\cal W}\) \(\newcommand{\ecal}{\cal E}\) \(\newcommand{\coords}[2]{\left\{#1\right\}_{#2}}\) \(\newcommand{\gray}[1]{\color{gray}{#1}}\) \(\newcommand{\lgray}[1]{\color{lightgray}{#1}}\) \(\newcommand{\rank}{\operatorname{rank}}\) \(\newcommand{\row}{\text{Row}}\) \(\newcommand{\col}{\text{Col}}\) \(\renewcommand{\row}{\text{Row}}\) \(\newcommand{\nul}{\text{Nul}}\) \(\newcommand{\var}{\text{Var}}\) \(\newcommand{\corr}{\text{corr}}\) \(\newcommand{\len}[1]{\left|#1\right|}\) \(\newcommand{\bbar}{\overline{\bvec}}\) \(\newcommand{\bhat}{\widehat{\bvec}}\) \(\newcommand{\bperp}{\bvec^\perp}\) \(\newcommand{\xhat}{\widehat{\xvec}}\) \(\newcommand{\vhat}{\widehat{\vvec}}\) \(\newcommand{\uhat}{\widehat{\uvec}}\) \(\newcommand{\what}{\widehat{\wvec}}\) \(\newcommand{\Sighat}{\widehat{\Sigma}}\) \(\newcommand{\lt}{<}\) \(\newcommand{\gt}{>}\) \(\newcommand{\amp}{&}\) \(\definecolor{fillinmathshade}{gray}{0.9}\)Market Failures
The market sometimes fails either the producer or the consumer. Economists define market failure as an element missing from the market place.
There are four possible failures that can develop:
- inadequate competition among producers,
- lack of information available to buyers and sellers,
- the inability of resources (labor, capital, entrepreneurs) to move to other markets, or
- externalities (unintended side-effects) that are either positive or negative.
The free market economy works best when adequate competition is available and four conditions are met. First, there must be adequate competition in all markets. Second, both buyers (consumers) and sellers (producers) must be reasonably well informed about the conditions and available opportunities within the marketplace. Third, resources (labor and capital) must be free to move from one industry to another when the need arises. Finally, the prices in the market must reasonably reflect the cost of production. If one or more of these conditions are not met, then economists consider that to be a market failure. Market failures generally occur when there is inadequate competition, inadequate information, resource immobility, and externalities.
Universal Generalizations
- Lack of competition, inadequate information, and immobile resources can result in market failure.
- The market economy does not produce public goods, which are collectively consumed by everyone.
- Externalities are regarded as market failures.
Guiding Questions
- Why is it important for consumers to have adequate information?
- Why are resources sometimes immobile?
- Why is it necessary for there to be adequate competition in a free market economy?
Video: Market Failures, Taxes, and Subsidies
The Problem of Imperfect Information and Asymmetric Information
Consider a purchase that many people make at important times in their lives--buying expensive jewelry. In May 1994, Doree Lynn bought an expensive ring from a jeweler in Washington, D.C., which included an emerald that cost $14,500. Several years later, the emerald fractured. Lynn took it to another jeweler who found that cracks in the emerald had been filled with an epoxy resin. In 1997, Lynn sued the original jeweler for selling her a treated emerald without telling her and won. The case publicized a number of little-known facts about precious stones. Most emeralds have internal flaws, so they are soaked in clear oil or an epoxy resin to hide the flaws and make the color deeper and clearer. Clear oil can leak out over time, and epoxy resin can discolor with age or heat. However, using clear oil or epoxy to “fill” emeralds is completely legal, as long as it is disclosed.
After Doree Lynn’s lawsuit, the NBC news show “Dateline” bought emeralds at four prominent jewelry stores in New York City in 1997. All the sales clerks at these stores, unaware that they were being recorded on a hidden camera, said the stones were untreated. When the emeralds were tested at a laboratory, however, it was discovered they had all been treated with oil or epoxy. Emeralds are not the only gemstones that are treated. Diamonds, topaz, and tourmaline are also often irradiated to enhance colors. The general rule is that all treatments to gemstones should be revealed, but often disclosure is not made. As such, many buyers face a situation of asymmetric information, where both parties involved in an economic transaction have an unequal amount of information (one party knows much more than the other).
Many economic transactions are made in a situation of imperfect information, where either the buyer, the seller, or both, are less than 100% certain about the qualities of what is being bought and sold. Also, the transaction may be characterized by asymmetric information, in which one party has more information than the other regarding the economic transaction. Let’s begin with some examples of how imperfect information complicates transactions in goods, labor, and financial capital markets. The presence of imperfect information can easily cause a decline in prices or quantities of products sold. However, buyers and sellers also have incentives to create mechanisms that will allow them to make mutually beneficial transactions even in the face of imperfect information.
What is the Difference Between Imperfect and Asymmetric Information?
For a market to reach equilibrium sellers and buyers must have full information about the product’s price and quality. If there is limited information, then buyers and sellers may not be able to transact or will possibly make poor decisions.
Imperfect information refers to the situation where buyers and/or sellers do not have all of the necessary information to make an informed decision about the price or quality of a product. The term imperfect information simply means that not all the information necessary to make an informed decision is known to the buyers and/or sellers. Asymmetric information is the condition where one party, either the buyer or the seller, has more information about the quality or price of the product than the other party. In either case (imperfect or asymmetric information) buyers or sellers need remedies to make more informed decisions.
“Lemons” and Other Examples of Imperfect Information
Consider Marvin, who is trying to decide whether to buy a used car. Let’s assume that Marvin is truly clueless about what happens inside a car’s engine. He is willing to do some background research, like reading Consumer Reports or checking websites that offer information about makes and models of used cars and what they should cost. He might pay a mechanic to inspect the car. Even after devoting some money and time collecting information, however, Marvin still cannot be absolutely sure that he is buying a high-quality used car. He knows that he might buy the car, drive it home, and use it for a few weeks before discovering that car is a “lemon,” which is slang for a defective product (especially a car).
Imagine that Marvin shops for a used car and finds two that look very similar in terms of mileage, exterior appearances, and age. One car costs $4,000, while the other car costs $4,600. Which car should Marvin buy?
If Marvin was choosing in a world of perfect information, the answer would be simple: he should buy the cheaper car. But Marvin is operating in a world of imperfect information where the sellers likely know more about the car’s problems than he does, and they have an incentive to hide the information. After all, the more problems that are disclosed, the lower the car’s selling price.
What should Marvin do? First, he needs to understand that even with imperfect information, prices still reflect information. Typically, used cars are more expensive on some dealer lots because the dealers have a trustworthy reputation to uphold. Those dealers try to fix problems that may not be obvious to their customers in order to create good word of mouth about their vehicles’ long-term reliability. The short-term benefits of selling their customers a “lemon” could cause a quick collapse in the dealer’s reputation and a loss of long-term profits. On other lots that are less well-established, one can find cheaper used cars, but the buyer takes on more risk when a dealer’s reputation has little at stake. The cheapest cars of all often appear on Craigslist, where the individual seller has no reputation to defend. In sum, cheaper prices do carry more risk, so Marvin should balance his appetite for risk versus the potential headaches of many more unanticipated trips to the repair shop.
Similar problems with imperfect information arise in labor and financial capital markets. Consider Greta, who is applying for a job. Her potential employer, like the used car buyer, is concerned about ending up with a “lemon”—in this case a poor quality employee. The employer will collect information about Greta’s academic and work history. In the end, however, a degree of uncertainty will inevitably remain regarding Greta’s abilities, which are hard to demonstrate without actually observing her on the job. How can a potential employer screen for certain attributes, such as motivation, timeliness, ability to get along with others, and so on? Employers often look to trade schools and colleges to pre-screen candidates. Employers may not even interview a candidate unless he has a degree and, sometimes, a degree from a particular school. Employers may also view awards, a high grade point average, and other accolades as a signal of hard work, perseverance, and ability. Employers may also seek references for insights into key attributes such as energy level, work ethic, and so on.
How Imperfect Information Can Affect Equilibrium Price and Quantity
The presence of imperfect information can discourage both buyers and sellers from participating in the market. Buyers may become reluctant to participate because they cannot determine the quality of a product. Sellers of high-quality or medium-quality goods may be reluctant to participate because it is difficult to demonstrate the quality of their goods to buyers—and since buyers cannot determine which goods have higher quality, they are likely to be unwilling to pay a higher price for such goods.
A market with few buyers and few sellers is sometimes referred to as a thin market. By contrast, a market with many buyers and sellers is called a thick market. When imperfect information is severe and buyers and sellers are discouraged from participating, markets may become extremely thin as a relatively small number of buyer and sellers attempt to communicate enough information that they can agree on a price.
When Price Mixes with Imperfect Information about Quality
A buyer confronted with imperfect information will often believe that the price being charged reveals something about the quality of the product. For example, a buyer may assume that a gemstone or a used car that costs more must be of higher quality, even though the buyer is not an expert on gemstones. Think of the expensive restaurant where the food must be good because it is so expensive or the shop where the clothes must be stylish because they cost so much, or the gallery where the art must be great because it costs so much. If you are hiring a lawyer, you might assume that a lawyer who charges $400 per hour must be better than a lawyer who charges $150 per hour. In these cases, the price can act as a signal of quality.
When buyers use the market price to draw inferences about the quality of products, then markets may have trouble reaching an equilibrium price and quantity. Imagine a situation where a used car dealer has a lot full of used cars that do not seem to be selling, so the dealer decides to cut the prices of the cars to sell a greater quantity. In a market with imperfect information, many buyers may assume that the lower price implies low-quality cars. As a result, the lower price may not attract more customers. Conversely, a dealer who raises prices may find that customers assume that the higher price means that cars are of higher quality; as a result of raising prices, the dealer might sell more cars.
The idea that higher prices might cause a greater quantity demanded and that lower prices might cause a lower quantity demanded runs exactly counter to the basic model of demand and supply. These contrary effects, however, will reach natural limits. At some point, if the price is high enough, the quantity demanded will decline. Conversely, when the price declines far enough, buyers will increasingly find value even if the quality is lower. In addition, information eventually becomes more widely known. An overpriced restaurant that charges more than the quality of its food is worth to many buyers will not last forever.
Is Consumer Behavior Rational?
There is a lot of human behavior out there that mainstream economists have tended to call “irrational” since it is consistently at odds with economists’ utility maximizing models. The typical response is for economists to brush these behaviors aside and call them “anomalies” or unexplained quirks.
“If only you knew more economics, you would not be so irrational,” is what many mainstream economists seem to be saying. A group known as behavioral economists has challenged this notion, because so much of this so-called “quirky” behavior is extremely common among us. For example, a conventional economist would say that if you lost a $10 bill today, and also got an extra $10 in your paycheck, you should feel perfectly neutral. After all, –$10 + $10 = $0. You are the same financially as you were before. However, behavioral economists have done research that shows many people will feel some negative emotion—anger, frustration, and so forth—after those two things happen. We tend to focus more on the loss than the gain. This is known as “loss aversion,” where a $1 loss pains us 2.25 times more than a $1 gain helps us, according to the economists Daniel Kahneman and Amos Tversky in a famous 1979 Econometrica paper. This has implications for investing, as people tend to “overplay” the stock market by reacting more to losses than to gains.
Behavioral economics also tries to explain why people make seemingly irrational decisions in the presence of different situations, or how the decision is “framed.” A popular example is outlined here: Imagine you have the opportunity to buy an alarm clock for $20 in Store A. Across the street, you learn, is the exact same clock at Store B for $10. You might say it is worth your time—a five minute walk—to save $10. Now, take a different example: You are in Store A buying a $300 phone. Five minutes away, at Store B, the same phone is $290. You again save $10 by taking a five minute walk. Do you do it?
Surprisingly, it is likely that you would not. Mainstream economists would say “$10 is $10” and that it would be irrational to make a five minute walk for $10 in one case and not the other. However, behavioral economists have pointed out that most of us evaluate outcomes relative to a reference point—here the cost of the product—and think of gains and losses as percentages rather than using actual savings.
Which view is right? Both have their advantages, but behavioral economists have at least shed a light on trying to describe and explain systematic behavior which previously has been dismissed as irrational. If most of us are engaged in some “irrational behavior,” perhaps there are deeper underlying reasons for this behavior in the first place.
Mechanisms to Reduce the Risk of Imperfect Information
If you were selling a good like emeralds or used cars where imperfect information is likely to be a problem, how could you reassure possible buyers? If you were buying a good where imperfect information is a problem, what would it take to reassure you? Buyers and sellers in the goods market rely on reputation as well as guarantees, warrantees, and service contracts to assure product quality. In the labor market, occupational licenses and certifications are used to assure competency, while in financial capital market cosigners and collateral are used as insurance against unforeseen, detrimental events.
In the goods market, the seller of a good might offer a money-back guarantee, an agreement that functions as a promise of quality. This strategy may be especially important for a company that sells goods through mail-order catalogs or over the web, whose customers cannot see the actual products, because it encourages people to buy something even if they are not certain they want to keep it.
L.L. Bean started using money-back-guarantees in 1911 when the founder stitched waterproof shoe rubbers together with leather shoe tops and sold them as hunting shoes. He guaranteed satisfaction. However, the stitching came apart and, out of the first batch of 100 pairs that were sold, 90 pairs were returned. L.L. Bean took out a bank loan, repaired all of the shoes, and replaced them. The L.L. Bean reputation for customer satisfaction began to spread. Many firms today offer money-back-guarantees for a few weeks or months, but L.L. Bean offers a complete money-back guarantee. Anything you have bought from L.L. Bean can always be returned, no matter how many years later or what condition the product is in, for a full money-back guarantee.
L.L. Bean has very few stores. Instead, most of its sales are made by mail, telephone, or, now, through their website. For this kind of firm, imperfect information may be an especially difficult problem because customers cannot see and touch what they are buying. A combination of a money-back guarantee and a reputation for quality can help for a mail-order firm to flourish.
Sellers may offer a warranty, which is a promise to fix or replace the good, at least for a certain period of time. The seller may also offer a buyer a chance to buy a service contract where the buyer pays an extra amount and the seller agrees to fix anything that goes wrong for a set time period. Service contracts are often used with large purchases such as cars, appliances and even houses.
Guarantees, warranties, and service contracts are examples of explicit reassurance that sellers provide. In many cases, firms also offer unstated guarantees. For example, some movie theaters might refund the cost of a ticket to a customer who walks out complaining about the show. Likewise, while restaurants do not generally advertise a money-back guarantee or exchange policies, many restaurants allow customers to exchange one dish for another or reduce the price of the bill if the customer is not satisfied.
The rationale for these policies is that firms want repeat customers, who in turn will recommend the business to others; as such, establishing a good reputation is of paramount importance. When buyers know that a firm is concerned about its reputation, they are less likely to worry about receiving a poor-quality product. For example, a well-established grocery store with a good reputation can often charge a higher price than a temporary stand at a local farmer’s market, where the buyer may never see the seller again.
Sellers of labor provide information through resumes, recommendations, school transcripts, and examples of their work. Occupational licenses are also used to establish quality in the labor market. Occupational licenses, which are typically issued by government agencies, show that a worker has completed a certain type of education or passed a certain test. Some of the professionals who must hold a license are doctors, teachers, nurses, engineers, accountants, and lawyers. In addition, most states require a license to work as a barber, an embalmer, a dietitian, a massage therapist, a hearing aid dealer, a counselor, an insurance agent, and a real estate broker. Some other jobs require a license in only one state. Minnesota requires a state license to be a field archeologist. North Dakota has a state license for bait retailers. In Louisiana, a state license is needed to be a “stress analyst” and California requires a state license to be a furniture upholsterer. According to a 2013 study from the University of Chicago, about 29% of U.S. workers have jobs that require occupational licenses.
Occupational licenses have their downside as well, as they represent a barrier to entry to certain industries. This makes it more difficult for new entrants to compete with incumbents, which can lead to higher prices and less consumer choice. In industries that require licenses, the government has decided that the additional information provided by licenses outweighs the negative effect on competition.
Are Advertisers Allowed to Benefit From Imperfect Information?
Many advertisements seem full of imperfect information—at least by what they imply. Driving a certain car, drinking a particular soda, or wearing a certain shoe are all unlikely to bring fashionable friends and fun automatically, if at all. The government rules on advertising, enforced by the Federal Trade Commission (FTC), allow advertising to contain a certain amount of exaggeration about the general delight of using a product. They, however, also demand that if a claim is presented as a fact, it must be true.
Legally, deceptive advertising dates back to the 1950s when Colgate-Palmolive created a television advertisement that seemed to show Rapid Shave shaving cream being spread on sandpaper and then the sand was shaved off the sandpaper. What the television advertisement actually showed was sand sprinkled on Plexiglas—without glue—and then scraped aside by the razor.
In the 1960s, in magazine advertisements for Campbell’s vegetable soup, the company was having problems getting an appetizing picture of the soup, because the vegetables kept sinking. So they filled a bowl with marbles and poured the soup over the top, so that the bowl appeared to be crammed with vegetables.
In the late 1980s, the Volvo Company filmed a television advertisement that showed a monster truck driving over cars, crunching their roofs—all except for the Volvo, which did not crush. However, the FTC found in 1991 that the roof of the Volvo used in the filming had been reinforced with an extra steel framework, while the roof supports on the other car brands had been cut.
The Wonder Bread Company ran television advertisements featuring “Professor Wonder,” who said that because Wonder Bread contained extra calcium, it would help children’s minds work better and improve their memory. The FTC objected, and in 2002 the company agreed to stop running the advertisements.
As can be seen in each of these cases, factual claims about the product’s performance are often checked, at least to some extent, by the Federal Trade Commission. Language and images that are exaggerated or ambiguous, but not actually false, are allowed in advertising. Untrue “facts” are not allowed. In any case, an old Latin saying applies when watching advertisements: Caveat emptor—that is, “let the buyer beware.”
On the buyer’s side of the labor market, a standard precaution against hiring a “lemon” of an employee is to specify that the first few months of employment are officially a trial or probationary period, and that the worker can be let go for any reason or no reason after that time. Sometimes workers also receive lower pay during this trial period.
In the financial capital market, before a bank makes a loan, it requires a prospective borrower fill out forms regarding the sources of income; in addition, the bank conducts a credit check on the individual’s past borrowing. Another approach is to require a cosigner on a loan; that is, another person or firm who legally pledges to repay some or all of the money if the original borrower does not do so. Yet another approach is to require collateral, often property or equipment that the bank would have a right to seize and sell if the loan is not repaid.
Buyers of goods and services cannot possibly become experts in evaluating the quality of gemstones, used cars, lawyers, and everything else they buy. Employers and lenders cannot be perfectly omniscient about whether possible workers will turn out well or potential borrowers will repay loans on time. But the mechanisms mentioned above can reduce the risks associated with imperfect information so that the buyer and seller are willing to proceed.
Markets have many ways to deal with imperfect information. In goods markets, buyers facing imperfect information about products may depend upon money-back guarantees, warranties, service contracts, and reputation. In labor markets, employers facing imperfect information about potential employees may turn to resumes, recommendations, occupational licenses for certain jobs, and employment for trial periods. In capital markets, lenders facing imperfect information about borrowers may require detailed loan applications and credit checks, cosigners, and collateral.

Across the country, countless people have protested, even risking arrest, against the Keystone XL Pipeline. (Credit: modification of image by “NoKXL”/Flickr Creative Commons)
You might have heard about Keystone XL in the news. It is a pipeline system designed to bring oil from Canada to the refineries near the Gulf of Mexico, as well as to boost crude oil production in the United States. While a private company, TransCanada, will own the pipeline, U.S. government approval is required because of its size and location. The pipeline is being built in four phases, with the first two currently in operation, bringing oil from Alberta, Canada, east across Canada, south through the United States into Nebraska and Oklahoma, and northeast again to Illinois. The third and fourth phases of the project, known as Keystone XL, would create a pipeline southeast from Alberta straight to Nebraska, and then from Oklahoma to the Gulf of Mexico.
Sounds like a great idea, right? A pipeline that would move much needed crude oil to the Gulf refineries would increase oil production for manufacturing needs, reduce price pressure at the gas pump, and increase overall economic growth. Supporters argue that the pipeline is one of the safest pipelines built yet, and would reduce America’s dependence on politically vulnerable Middle Eastern oil imports.
Not so fast, say its critics. The Keystone XL would be constructed over an enormous aquifer (one of the largest in the world) in the Midwest, and through an environmentally fragile area in Nebraska, causing great concern among environmentalists about possible destruction to the natural surroundings. They argue that leaks could taint valuable water sources and construction of the pipeline could disrupt and even harm indigenous species. Environmentalist groups have fought government approval of the proposed construction of the pipeline, and as of press time, the pipeline projects remain stalled.
Of course, environmental concerns matter when discussing issues related to economic growth. But how much should they factor in? In the case of the pipeline, how do we know how much damage it would cause when we do not know how to put a value on the environment? Would the benefits of the pipeline outweigh the opportunity cost? The issue of how to balance economic progress with unintended effects on our planet is the subject of this chapter.
In 1969, the Cuyahoga River in Ohio was so polluted that it spontaneously burst into flame. Air pollution was so bad at that time that Chattanooga, Tennessee was a city where, as an article from Sports Illustrated put it: “the death rate from tuberculosis was double that of the rest of Tennessee and triple that of the rest of the United States, a city in which the filth in the air was so bad it melted nylon stockings off women’s legs, in which executives kept supplies of clean white shirts in their offices so they could change when a shirt became too gray to be presentable, in which headlights were turned on at high noon because the sun was eclipsed by the gunk in the sky.”
The problem of pollution arises for every economy in the world, whether high-income or low-income, and whether market-oriented or command-oriented. Every country needs to strike some balance between production and environmental quality. This chapter begins by discussing how firms may fail to take certain social costs, like pollution, into their planning if they do not need to pay these costs. Traditionally, policies for environmental protection have focused on governmental limits on how much of each pollutant could be emitted. While this approach has had some success, economists have suggested a range of more flexible, market-oriented policies that reduce pollution at a lower cost. We will consider both approaches, but first, let’s see how economists frame and analyze these issues.
The Economics of Pollution
From 1970 to 2012, the U.S. population increased by one-third and the size of the U.S. economy more than doubled. Since the 1970s, however, the United States, using a variety of anti-pollution policies, has made genuine progress against a number of pollutants. Table 1 lists users of energy—from residential to industrial—the types of fuels each used, and the emissions from each, according to the U.S. Energy Information Administration (EIA). The table shows that emissions of certain key air pollutants declined substantially from 2007 to 2012; they dropped 730 million metric tons (MMT) a year—a 12% reduction. This seems to indicate that progress has been made in the United States in reducing overall carbon dioxide emissions, which cause greenhouse gases.
Despite the gradual reduction in emissions from fossil fuels, many important environmental issues remain. Along with the still high levels of air and water pollution, other issues include hazardous waste disposal, destruction of wetlands and other wildlife habitats, and the impact on human health from pollution.
| End-use Sector | Coal | Petroleum | Natural Gas | Purchased Electric Power | Total Primary Fossil Fuels |
| Residential | (0) | (14) | (31) | (134) | (179) |
| Commercial | (2) | (2) | (7) | (126) | (136) |
| Industrial | (40) | (62) | 31 | (118) | (191) |
| Transportation | 0 | (228) | 5 | (1) | (224) |
| Power | (464) | (36) | (122) | - | - |
| Change 2007–2012 | (508) | (342) | 121 | (378) | (730) |
U.S. Carbon Dioxide (CO2) Emissions from Fossil Fuels Consumed 2007–2012, Million Metric Tons (MMT) per Year(Source: EIA Monthly Energy Review)
Externalities
Private markets, such as the cell phone industry, offer an efficient way to put buyers and sellers together and determine what goods are produced, how they are produced, and who gets them. The principle that voluntary exchange benefits both buyers and sellers is a fundamental building block of the economic way of thinking. Another important question to consider, however, is this: what happens when a voluntary exchange affects a third party who is neither the buyer nor the seller?
As an example, consider a concert producer who wants to build an outdoor arena that will host country music concerts a half-mile from your neighborhood. You will be able to hear these outdoor concerts while sitting on your back porch—or perhaps even in your dining room. In this case, the sellers and buyers of concert tickets may both be quite satisfied with their voluntary exchange, but you have no voice in their market transaction. The effect of a market exchange on a third party who is outside or “external” to the exchange is called an externality. Because externalities that occur in market transactions affect other parties beyond those involved, they are sometimes called spillovers.
Externalities can be negative or positive. If you hate country music, then having it waft into your house every night would be a negative externality. If you love country music, then what amounts to a series of free concerts would be a positive externality.
Pollution as a Negative Externality
Pollution is a negative externality. Economists illustrate the social costs of production with a demand and supply diagram. The social costs include the private costs of production incurred by the company and the external costs of pollution that are passed on to society. Figure 2 shows the demand and supply for manufacturing refrigerators. The demand curve (D) shows the quantity demanded at each price. The supply curve (Sprivate) shows the quantity of refrigerators supplied by all the firms at each price if they are taking only their private costs into account and they are allowed to emit pollution at zero cost. The market equilibrium (E0), where quantity supplied and quantity demanded are equal, is at a price of $650 and a quantity of 45,000. This information is also reflected in the first three columns of Table 2.
Taking Social Costs into Account: A Supply Shift
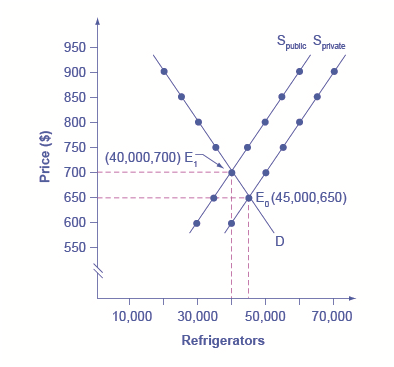
If the firm takes only its own costs of production into account, then its supply curve will be Sprivate, and the market equilibrium will occur at E0. Accounting for additional external costs of $100 for every unit produced, the firm’s supply curve will be Ssocial. The new equilibrium will occur at E1.
| Price | Quantity Demanded | Quantity Supplied before Considering Pollution Cost | Quantity Supplied after Considering Pollution Cost |
| $600 | 50,000 | 40,000 | 30,000 |
| $650 | 45,000 | 45,000 | 35,000 |
| $700 | 40,000 | 50,000 | 40,000 |
| $750 | 35,000 | 55,000 | 45,000 |
| $800 | 30,000 | 60,000 | 50,000 |
| $850 | 25,000 | 65,000 | 55,000 |
| $900 | 20,000 | 70,000 | 60,000 |
A Supply Shift Caused by Pollution Costs
However, as a by-product of the metals, plastics, chemicals and energy that are used in manufacturing refrigerators, some pollution is created. Let’s say that, if these pollutants were emitted into the air and water, they would create costs of $100 per refrigerator produced. These costs might occur because of injuries to human health, property values, wildlife habitat, reduction of recreation possibilities, or because of other negative impacts. In a market with no anti-pollution restrictions, firms can dispose of certain wastes absolutely free. Now imagine that firms which produce refrigerators must factor in these external costs of pollution—that is, the firms have to consider not only the costs of labor and materials needed to make a refrigerator but also the broader costs to society of injuries to health and other values caused by pollution. If the firm is required to pay $100 for the additional external costs of pollution each time it produces a refrigerator, production becomes more costly and the entire supply curve shifts up by $100.
As illustrated in the fourth column of Table 2 and in Figure 2, the firm will need to receive a price of $700 per refrigerator and produce a quantity of 40,000—and the firm’s new supply curve will be Ssocial. The new equilibrium will occur at E1, taking the additional external costs of pollution into account results in a higher price, a lower quantity of production, and a lower quantity of pollution. The following Work It Out feature will walk you through an example, this time with musical accompaniment.
Remember that the supply curve is based on choices about the production that firms make while looking at their marginal costs, while the demand curve is based on the benefits that individuals perceive while maximizing utility. If no externalities existed, private costs would be the same as the costs to society as a whole, and private benefits would be the same as the benefits to society as a whole. Thus, if no externalities existed, the interaction of demand and supply will coordinate social costs and benefits.
However, when the externality of pollution exists, the supply curve no longer represents all social costs. Because externalities represent a case where markets no longer consider all social costs, but only some of them, economists commonly refer to externalities as an example of market failure. When there is a market failure, the private market fails to achieve an efficient output, because either firms do not account for all costs incurred in the production of output and/or consumers do not account for all benefits obtained (a positive externality). In the case of pollution, at the market output, social costs of production exceed social benefits to consumers, and the market produces too much of the product.
We can see a general lesson here. If firms were required to pay the social costs of pollution, they would create less pollution but produce less of the product and charge a higher price. In the next module, we will explore how governments require firms to take the social costs of pollution into account.
Command-and-Control Regulation
When the United States started passing comprehensive environmental laws in the late 1960s and early 1970s, a typical law specified how much pollution could be emitted out of a smokestack or a drainpipe and imposed penalties if that limit was exceeded. Other laws required the installation of certain equipment—for example, on automobile tailpipes or on smokestacks—to reduce pollution. These types of laws, which specify allowable quantities of pollution and which also may detail which pollution-control technologies must be used, fall under the category of command-and-control regulation. In effect, the command-and-control regulation requires that firms increase their costs by installing anti-pollution equipment; firms are thus required to take the social costs of pollution into account.
Command-and-control regulation has been highly successful in protecting and cleaning up the U.S. environment. In 1970, the Environmental Protection Agency (EPA) was created to oversee all environmental laws. In the same year, the Clean Air Act was enacted to address air pollution. Just two years later, in 1972, Congress passed and the president signed the far-reaching Clean Water Act. These command-and-control environmental laws, and their amendments and updates have been largely responsible for America’s cleaner air and water in recent decades. However, economists have pointed out three difficulties with command-and-control environmental regulation.
First, command-and-control regulation offers no incentive to improve the quality of the environment beyond the standard set by a particular law. Once the command-and-control regulation has been satisfied, polluters have zero incentive to do better.
Second, command-and-control regulation is inflexible. It usually requires the same standard for all polluters, and often the same pollution-control technology as well. This means that command-and-control regulation draws no distinctions between firms that would find it easy and inexpensive to meet the pollution standard—or to reduce pollution even further—and firms that might find it difficult and costly to meet the standard. Firms have no reason to rethink their production methods in fundamental ways that might reduce pollution even more and at lower cost.
Third, command-and-control regulations are written by legislators and the EPA, and so they are subject to compromises in the political process. Existing firms often argue (and lobby) that stricter environmental standards should not apply to them, only to new firms that wish to start production. Consequently, real-world environmental laws are full of fine print, loopholes, and exceptions.
Although critics accept the goal of reducing pollution, they question whether command-and-control regulation is the best way to design policy tools for accomplishing that goal. A different approach is the use of market-oriented tools, which are discussed in the next section.
Market-Oriented Environmental Tools
Market-oriented environmental policies create incentives to allow firms some flexibility in reducing pollution. The three main categories of market-oriented approaches to pollution control are pollution charges, marketable permits, and better-defined property rights. All of these policy tools, discussed below, address the shortcomings of command-and-control regulation—albeit in different ways.
Pollution Charges
A pollution charge is a tax imposed on the quantity of pollution that a firm emits. A pollution charge gives a profit-maximizing firm an incentive to figure out ways to reduce its emissions—as long as the marginal cost of reducing the emissions is less than the tax.
For example, consider a small firm that emits 50 pounds per year of small particles, such as soot, into the air. Particulate matter, as it is called, causes respiratory illnesses and also imposes costs on firms and individuals.
Figure 3 illustrates the marginal costs that a firm faces in reducing pollution. The marginal cost of pollution reduction, like most marginal cost curves increases with output, at least in the short run. Reducing the first 10 pounds of particulate emissions costs the firm $300. Reducing the second 10 pounds would cost $500; reducing the third ten pounds would cost $900; reducing the fourth 10 pounds would cost $1,500; and the fifth 10 pounds would cost $2,500. This pattern for the costs of reducing pollution is common, because the firm can use the cheapest and easiest method to make initial reductions in pollution, but additional reductions in pollution become more expensive.
A Pollution Charge
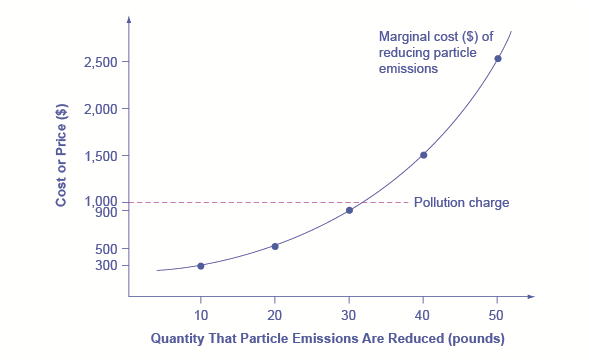
If a pollution charge is set equal to $1,000, then the firm will have an incentive to reduce pollution by 30 pounds because the $900 cost of these reductions would be less than the cost of paying the pollution charge.
Imagine the firm now faces a pollution tax of $1,000 for every 10 pounds of particulates emitted. The firm has the choice of either polluting and paying the tax, or reducing the amount of particulates they emit and paying the cost of abatement as shown in the figure. How much will the firm pollute and how much will the firm abate? The first 10 pounds would cost the firm $300 to abate. This is substantially less than the $1,000 tax, so they will choose to abate. The second 10 pounds would cost $500 to abate, which is still less than the tax, so they will choose to abate. The third 10 pounds would cost $900 to abate, which is slightly less than the $1,000 tax. The fourth 10 pounds would cost $1,500, which is much more costly than paying the tax. As a result, the firm will decide to reduce pollutants by 30 pounds, because the marginal cost of reducing pollution by this amount is less than the pollution tax. With a tax of $1,000, the firm has no incentive to reduce pollution more than 30 pounds.
A firm that has to pay a pollution tax will have an incentive to figure out the least expensive technologies for reducing pollution. Firms that can reduce pollution cheaply and easily will do so to minimize their pollution taxes, whereas firms that will incur high costs for reducing pollution will end up paying the pollution tax instead. If the pollution tax applies to every source of pollution, then no special favoritism or loopholes are created for politically well-connected producers.
For an example of a pollution charge at the household level, consider two ways of charging for garbage collection. One method is to have a flat fee per household, no matter how much garbage a household produces. An alternative approach is to have several levels of fees, depending on how much garbage the household produces—and to offer lower or free charges for recyclable materials. As of 2006 (latest statistics available), the EPA had recorded over 7,000 communities that have implemented “pay as you throw” programs. When people have a financial incentive to put out less garbage and to increase recycling, they find ways of doing so.
A number of environmental policies are really pollution charges, although they often do not travel under that name. For example, the federal government and many state governments impose taxes on gasoline. We can view this tax as a charge on the air pollution that cars generate as well as a source of funding for maintaining roads. Indeed, gasoline taxes are far higher in most other countries than in the United States.
Similarly, the refundable charge of five or 10 cents that only 10 states have for returning recyclable cans and bottles works like a pollution tax that provides an incentive to avoid littering or throwing bottles in the trash. Compared with command-and-control regulation, a pollution tax reduces pollution in a more flexible and cost-effective way.
Marketable Permits
When a city or state government sets up a marketable permit program (e.g. cap-and-trade), it must start by determining the overall quantity of pollution it will allow as it tries to meet national pollution standards. Then, a number of permits allowing only this quantity of pollution are divided among the firms that emit that pollutant. These permits to pollute can be sold or given to firms free.
Now, add two more conditions. Imagine that these permits are designed to reduce total emissions over time. For example, a permit may allow emission of 10 units of pollution one year, but only nine units the next year, then eight units the year after that, and so on down to some lower level. In addition, imagine that these are marketable permits, meaning that firms can buy and sell them.
To see how marketable permits can work to reduce pollution, consider the four firms listed in Table 3. The table shows current emissions of lead from each firm. At the start of the marketable permit program, each firm receives permits to allow this level of pollution. However, these permits are shrinkable, and next year the permits allow the firms to emit only half as much pollution. Let’s say that in a year, Firm Gamma finds it easy and cheap to reduce emissions from 600 tons of lead to 200 tons, which means that it has permits that it is not using that allow emitting 100 tons of lead. Firm Beta reduces its lead pollution from 400 tons to 200 tons, so it does not need to buy any permits, and it does not have any extra permits to sell. However, although Firm Alpha can easily reduce pollution from 200 tons to 150 tons, it finds that it is cheaper to purchase permits from Gamma rather than to reduce its own emissions to 100. Meanwhile, Firm Delta did not even exist in the first period, so the only way it can start production is to purchase permits to emit 50 tons of lead.
The total quantity of pollution will decline. But the buying and selling of the marketable permits will determine exactly which firms reduce pollution and by how much. With a system of marketable permits, the firms that find it least expensive to do so will reduce pollution the most.
| Firm Alpha | Firm Beta | Firm Gamma | Firm Delta | |
| Current emissions—permits distributed free for this amount | 200 tons | 400 tons | 600 tons | 0 tons |
| How much pollution will these permits allow in one year? | 100 tons | 200 tons | 300 tons | 0 tons |
| Actual emissions one year in the future | 150 tons | 200 tons | 200 tons | 50 tons |
| Buyer or seller of marketable permit? | Buys permits for 50 tons | Doesn’t buy or sell permits | Sells permits for 100 tons | Buys permits for 50 tons |
How Marketable Permits Work
Another application of marketable permits occurred when the Clean Air Act was amended in 1990. The revised law sought to reduce sulfur dioxide emissions from electric power plants to half of the 1980 levels out of concern that sulfur dioxide was causing acid rain, which harms forests as well as buildings. In this case, the marketable permits the federal government issued were free of charge (no pun intended) to electricity-generating plants across the country, especially those that were burning coal (which produces sulfur dioxide). These permits were of the “shrinkable” type; that is, the amount of pollution allowed by a given permit declined with time.
Visit this website to learn more about pay-as-you-throw programs, including viewing a map and a table that shows the number of communities using this program in each state. www.bottlebill.org/legislation/usa.htm
Better-Defined Property Rights
A clarified and strengthened idea of property rights can also strike a balance between economic activity and pollution. Ronald Coase (1910–2013), who won the 1991 Nobel Prize in economics, offered a vivid illustration of an externality: a railroad track running beside a farmer’s field where the railroad locomotive sometimes gives off sparks and sets the field ablaze. Coase asked whose responsibility it was to address this spillover. Should the farmer be required to build a tall fence alongside the field to block the sparks? Or should the railroad be required to put some gadget on the locomotive’s smokestack to reduce the number of sparks?
Coase pointed out that this issue cannot be resolved until property rights are clearly defined—that is, the legal rights of ownership on which others are not allowed to infringe without paying compensation. Does the farmer have a property right not to have a field burned? Does the railroad have a property right to run its own trains on its own tracks? If neither party has a property right, then the two sides may squabble endlessly, nothing will be done, and sparks will continue to set the field aflame. However, if either the farmer or the railroad has a well-defined legal responsibility, then that party will seek out and pay for the least costly method of reducing the risk that sparks will hit the field. The property right determines whether the farmer or the railroad pays the bills.
The property rights approach is highly relevant in cases involving endangered species. The U.S. government’s endangered species list includes about 1,000 plants and animals, and about 90% of these species live on privately owned land. The protection of these endangered species requires careful thinking about incentives and property rights. The discovery of an endangered species on private land has often triggered an automatic reaction from the government to prohibit the landowner from using that land for any purpose that might disturb the imperiled creatures. Consider the incentives of that policy: If you admit to the government that you have an endangered species, the government effectively prohibits you from using your land. As a result, rumors abounded of landowners who followed a policy of “shoot, shovel, and shut up” when they found an endangered animal on their land. Other landowners have deliberately cut trees or managed land in a way that they knew would discourage endangered animals from locating there.
A more productive policy would consider how to provide private landowners with an incentive to protect the endangered species that they find and to provide a habitat for additional endangered species. For example, the government might pay landowners who provide and maintain suitable habitats for endangered species or who restrict the use of their land to protect an endangered species. Again, an environmental law built on incentives and flexibility offers greater promise than a command-and-control approach, which tries to oversee millions of acres of privately owned land.
Applying Market-Oriented Environmental Tools
Market-oriented environmental policies are a toolkit. Specific policy tools will work better in some situations than in others. For example, marketable permits work best when a few dozen or a few hundred parties are highly interested in trading, as in the cases of oil refineries that trade lead permits or electrical utilities that trade sulfur dioxide permits. However, for cases in which millions of users emit small amounts of pollution—such as emissions from car engines or unrecycled soda cans—and have no strong interest in trading, pollution charges will typically offer a better choice. Market-oriented environmental tools can also be combined. Marketable permits can be viewed as a form of improved property rights. Or the government could combine marketable permits with a pollution tax on any emissions not covered by a permit.
Visit this website to learn more about pay-as-you-throw programs, including viewing a map and a table that shows the number of communities using this program in each state. www.epa.gov/epawaste/conserve/tools/payt/
The Benefits and Costs of U.S. Environmental Laws
Government economists have estimated that U.S. firms may pay more than $200 billion per year to comply with federal environmental laws. That is big bucks. Is the money well spent?
Clean Air and Clean Water
The benefits of a cleaner environment can be divided into four areas: (1) people may stay healthier and live longer; (2) certain industries that rely on clean air and water, such as farming, fishing, and tourism, may benefit; (3) property values may be higher; and (4) people may simply enjoy a cleaner environment in a way that does not need to involve a market transaction. Some of these benefits, such as gains to tourism or farming, are relatively easy to value in economic terms. It is harder to assign a monetary value to others, such as the value of clean air for someone with asthma. It seems impossible to put a clear-cut monetary value on still others, such as the satisfaction you might feel from knowing that the air is clear over the Grand Canyon, even if you have never visited the Grand Canyon.
Although estimates of environmental benefits are not precise, they can still be revealing. For example, a study by the Environmental Protection Agency looked at the costs and benefits of the Clean Air Act from 1970 to 1990. It found that total costs over that time period were roughly $500 billion—a huge amount. However, it also found that a middle-range estimate of the health and other benefits from cleaner air was $22 trillion—about 44 times higher than the costs. A more recent study by the EPA estimated that the environmental benefits to Americans from the Clean Air Act will exceed their costs by a margin of four to one. The EPA estimated that “in 2010 the benefits of Clean Air Act programs will total about $110 billion. This estimate represents the value of avoiding increases in illness and premature death which would have prevailed.” Saying that overall benefits of environmental regulation have exceeded costs in the past, however, is very different from saying that every environmental regulation makes sense. For example, studies suggest that when breaking down emission reductions by type of contaminants, the benefits of air pollution control outweigh the costs primarily for particulates and lead, but when looking at other air pollutants, the costs of reducing them may be comparable to or greater than the benefits. Just because some environmental regulations have had benefits much higher than costs does not prove that every individual regulation is a sensible idea.
Ecotourism: Making Environmentalism Pay
The definition of ecotourism is a little vague. Does it mean sleeping on the ground, eating roots, and getting close to wild animals? Does it mean flying in a helicopter to shoot anesthetic darts at African wildlife? Or a little of both? The definition may be fuzzy, but tourists who hope to appreciate the ecology of their destination—“eco tourists”—are the impetus to a big and growing business. The International Ecotourism Society estimates that international tourists interested in seeing nature or wildlife will take 1.56 billion trips by 2020.
Realizing the attraction of ecotourism, the residents of low-income countries may come to see that preserving wildlife habitats is more lucrative than, say, cutting down forests or grazing livestock to survive. In South Africa, Namibia, and Zimbabwe, for example, a substantial expansion of both rhinoceros and elephant populations is broadly credited to ecotourism, which has given local communities an economic interest in protecting them. Some of the leading ecotourism destinations include: Costa Rica and Panama in Central America; the Caribbean; Malaysia, and other South Pacific destinations; New Zealand; the Serengeti in Tanzania; the Amazon rain forests; and the Galapagos Islands. In many of these countries and regions, governments have enacted policies whereby revenues from ecotourism are shared with local communities, to give people in those local communities a kind of property right that encourages them to conserve their local environment.
Ecotourism needs careful management, so that the combination of eager tourists and local entrepreneurs does not destroy what the visitors are coming to see. But whatever one’s qualms are about certain kinds of ecotourism—such as the occasional practice of rich tourists shooting elderly lions with high-powered rifles—it is worth remembering that the alternative is often that low-income people in poor countries will damage their local environment in their effort to survive.
Visit The International Ecotourism Society’s website to learn more about The International Ecotourism Society, its programs, and tourism’s role in sustainable community development.http://www.ecotourism.org/
Introduction to Positive Externalities and Public Goods
Can you imagine a world in which you did not own a cellular phone or use Wikipedia? New technology changes how people live and work and what they buy. Technology includes the invention of new products, new ways of producing goods and services, and even new ways of managing a company more efficiently. Research and development of technology is the difference between horses and automobiles, between candles and electric lights, between fetching water in buckets and indoor plumbing, and between infection and good health from antibiotics.
In December 2009, ABC News compiled a list of some of the technological breakthroughs that have revolutionized consumer products in the past 10 years:
- GPS tracking devices, originally developed by the defense department and available to consumers in 2000, give users up-to-date information on location and time through satellite technology.
- In 2000, Toyota introduced the Prius hybrid car, which greatly improved fuel efficiency.
- Also in 2000, AT&T offered its customers the ability to text on a mobile phone.
- In 2001, Wikipedia launched a user-generated encyclopedia on the Web.
- Even though Napster died in 2001, the company launched music downloading and file sharing, which revolutionized how consumers get their music and videos.
- Friendster kicked off the social networking business in 2003, and Twitter and Facebook followed.
- In 2003, the Human Genome project was completed. It helps to fight disease and launch new pharmaceutical innovations.
- Also in 2003, the search engine became a way of life for obtaining information quickly. The search engine companies also became innovators in the digital software that dominates mobile devices.
- In 2006, Nintendo launched Wii and changed the way video games are played. Players can now be drawn into the action and use their bodies to respond rather than a handheld device.
- Apple introduced the iPhone in 2007 and launched an entire smartphone industry
In 1977 the United States launched Voyager I, a spacecraft originally intended to reach Jupiter and Saturn, to send back photographs and other cosmic measurements. Voyager I, however, kept going, and going—past Jupiter and Saturn—right out of our solar system. At the time of its launch, Voyager had some of the most sophisticated computing processing power NASA could engineer (8,000 instructions per second), but by the time it left the solar system (in 2012, actually) we Earthlings were using handheld devices that could process 14 billion instructions per second.
Still, the technology of today is a spillover product of the incredible feats accomplished by NASA thirty years ago. NASA research, for instance, is responsible for the kidney dialysis and mammogram machines that we use today. Research in new technologies not only produces private benefits to the investment firm, or in this case to NASA, but it also creates benefits for the broader society. In this way, new knowledge often becomes what economists refer to as a public good. This leads us to the topic of this chapter—technology, positive externalities, public goods, and the role of government in the encouragement of innovation and the social benefits that it provides.
The rapid growth of technology has increased our ability to access and process data, to navigate through a busy city, and to communicate with friends on the other side of the globe. The research and development efforts of citizens, scientists, firms, universities, and governments have truly revolutionized the modern economy. With all new technologies, however, there are new challenges. This chapter deals with some of these issues: Will private companies be willing to invest in new technology? In what ways does new technology have positive externalities? What motivates inventors? Does government have a role to play in encouraging research and technology? Are there certain types of goods that markets fail to provide efficiently, and that only government can produce? What happens when consumption or production of a product creates positive externalities? Why is it unsurprising when a common resource, like marine fisheries, is overused?
Why the Private Sector Underinvests in Innovation
Market competition can provide an incentive for discovering new technology because a firm can earn higher profits by finding a way to produce products more cheaply or to create products with characteristics consumers want. As Gregory Lee, CEO of Samsung said, “Relentless pursuit of new innovation is the key principle of our business and enables consumers to discover a world of possibilities with technology.” An innovative firm knows that it will usually have a temporary edge over its competitors and thus an ability to earn above-normal profits before competitors can catch up.
In certain cases, however, competition can discourage new technology, especially when other firms can quickly copy a new idea. Consider a pharmaceutical firm deciding to develop a new drug. On average, it can cost $800 million and take more than a decade to discover a new drug, perform the necessary safety tests, and bring the drug to market. If the research and development (R&D) effort fails—and every R&D project has some chance of failure—then the firm will suffer losses and could even be driven out of business. If the project succeeds, then the firm’s competitors may figure out ways of adapting and copying the underlying idea, but without having to pay the costs themselves. As a result, the innovative company will bear the much higher costs of the R&D and will enjoy at best only a small, temporary advantage over the competition.
Many inventors over the years have discovered that their inventions brought them less profit than they might have reasonably expected.
- Eli Whitney (1765–1825) invented the cotton gin, but then southern cotton planters built their own seed-separating devices with a few minor changes in Whitney’s design. When Whitney sued, he found that the courts in southern states would not uphold his patent rights.
- Thomas Edison (1847–1931) still holds the record for most patents granted to an individual. His first invention was an automatic vote counter, and despite the social benefits, he could not find a government that wanted to buy it.
- Gordon Gould came up with the idea behind the laser in 1957. He put off applying for a patent and, by the time he did apply, other scientists had laser inventions of their own. A lengthy legal battle resulted, in which Gould spent $100,000 on lawyers, before he eventually received a patent for the laser in 1977. Compared to the enormous social benefits of the laser, Gould received relatively little financial reward.
A variety of studies by economists have found that the original inventor receives one-third to one-half of the total economic benefits from innovations, while other businesses and new product users receive the rest.
The Positive Externalities of New Technology
Will private firms in a market economy under invest in research and technology? If a firm builds a factory or buys a piece of equipment, the firm receives all the economic benefits that result from the investments. However, when a firm invests in new technology, the private benefits, or profits, that the firm receives are only a portion of the overall social benefits. The social benefits of an innovation take into account the value of all the positive externalities of the new idea or product, whether enjoyed by other companies or society as a whole, as well as the private benefits received by the firm that developed the new technology. Positive externalities are beneficial spillovers to a third party, or parties.
Consider the example of the Big Drug Company, which is planning its R&D budget for the next year. Economists and scientists working for Big Drug have compiled a list of potential research and development projects and estimated rates of return. (The rate of return is the estimated payoff from the project.) Figure 4 shows how the calculations work. The downward-sloping DPrivate curve represents the firm’s demand for financial capital and reflects the company’s willingness to borrow to finance research and development projects at various interest rates. Suppose that this firm’s investment in research and development creates a spillover benefit to other firms and households. After all, new innovations often spark other creative endeavors that society also values. If we add the spillover benefits society enjoys to the firm’s private demand for financial capital, we can draw DSocial that lies above DPrivate.
If there was a way for the firm to fully monopolize those social benefits by somehow making them unavailable to the rest of us, the firm’s private demand curve would be the same as society’s demand curve. According to Figure 4 and Table 4, if the going rate of interest on borrowing is 8%, and the company can receive the private benefits of innovation only, then the company would finance $30 million. Society, at the same rate of 8%, would find it optimal to have $52 million of borrowing. Unless there is a way for the company to fully enjoy the total benefits, then it will borrow less than the socially optimal level of $52 million.
Positive Externalities and Technology
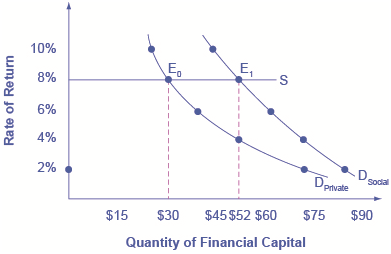
Big Drug faces a cost of borrowing of 8%. If the firm receives only the private benefits of investing in R&D, then its demand curve for financial capital is shown by DPrivate, and the equilibrium will occur at $30 million. Because there are spillover benefits, society would find it optimal to have $52 million of investment. If the firm could keep the social benefits of its investment for itself, its demand curve for financial capital would be DSocial and it would be willing to borrow $52 million.
| Rate of Return | DPrivate (in millions) | DSocial (in millions) |
| 2% | $72 | $84 |
| 4% | $52 | $72 |
| 6% | $38 | $62 |
| 8% | $30 | $52 |
| 10% | $26 | $44 |
Big Drug’s original demand for financial capital (DPrivate) is based on the profits received by the firm. However, other pharmaceutical firms and health care companies may learn new lessons about how to treat certain medical conditions and are then able to create their own competing products. The social benefit of the drug takes into account the value of all the positive externalities of the drug. If Big Drug were able to gain this social return instead of other companies, its demand for financial capital would shift to the demand curve DSocial, and it would be willing to borrow and invest $52 million. However, if Big Drug is receiving only 50 cents of each dollar of social benefits, the firm will not spend as much on creating new products. The amount it would be willing to spend would fall somewhere in between DPrivate and DSocial.
Why Invest in Human Capital?
The investment in anything, whether it is the construction of a new power plant or research in a new cancer treatment, usually requires a certain upfront cost with an uncertain future benefit. The investment in education, or human capital, is no different. Over the span of many years, a student and her family invest significant amounts of time and money into that student’s education. The idea is that higher levels of educational attainment will eventually serve to increase the student’s future productivity and subsequent ability to earn. Once the numbers are crunched, does this investment pay off for the student?
Almost universally, economists have found that the answer to this question is a clear “Yes.” For example, several studies of the return to education in the United States estimate that the rate of return to a college education is approximately 10%. Data in Table 5, from the U.S. Bureau of Labor Statistics’ Usual Weekly Earnings of Wage and Salary Workers, Third Quarter 2013, demonstrate that median weekly earnings are higher for workers who have completed more education. While these rates of return will beat equivalent investments in Treasury bonds or savings accounts, the estimated returns to education go primarily to the individual worker, so these returns are private rates of return to education.
| Less than a High School Degree | High School Degree, No College | Bachelor’s Degree | |
| Median Weekly Earnings (full-time workers over the age of 25) | $479 | $659 | $1,174 |
Usual Weekly Earnings of Wage and Salary Workers, Third Quarter 2013(Source: www.bls.gov/news.release/pdf/wkyeng.pdf)
What does society gain from investing in the education of another student? After all, if the government is spending taxpayer dollars to subsidize public education, society should expect some kind of return on that spending. Again, economists like George Psacharopoulos have found that, across a variety of nations, the social rate of return on schooling is also positive. After all, positive externalities exist from investment in education. While not always easy to measure, according to Walter McMahon, the positive externalities to education typically include better health outcomes for the population, lower levels of crime, a cleaner environment and a more stable, democratic government. For these reasons, many nations have chosen to use taxpayer dollars to subsidize primary, secondary, and higher education. Education clearly benefits the person who receives it, but a society where most people have a good level of education provides positive externalities for all.
Other Examples of Positive Externalities
Although technology may be the most prominent example of a positive externality, it is not the only one. For example, being vaccinated against disease is not only a protection for the individual, but it has the positive spillover of protecting others who may become infected. When a number of homes in a neighborhood are modernized, updated, and restored, not only does it increase the value of those homes, but the value of other properties in the neighborhood may increase as well.
The appropriate public policy response to a positive externality, like a new technology, is to help the party creating the positive externality receive a greater share of the social benefits. In the case of vaccines, like flu shots, an effective policy might be to provide a subsidy to those who choose to get vaccinated.
Figure 5 shows the market for flu shots. The market demand curve DMarket for flu shots reflects only the marginal private benefits (MPB) that the vaccinated individuals receive from the shots. Assuming that there are no spillover costs in the production of flu shots, the market supply curve is given by the marginal private cost (MPC) of producing the vaccinations.
The equilibrium quantity of flu shots produced in the market, where MPB is equal to MPC, is QMarket and the price of flu shots is PMarket. However, spillover benefits exist in this market because others, those who chose not to purchase a flu shot, receive a positive externality in a reduced chance of contracting the flu. When we add the spillover benefits to the marginal private benefit of flu shots, the marginal social benefit (MSB) of flu shots is given by DSocial. Because the MPB is greater than MSB, we see that the socially optimal level of flu shots is greater than the market quantity (QSocial exceeds QMarket) and the corresponding price of flu shots, if the market were to produce QSocial, would be at PSocial. Unfortunately, the marketplace does not recognize the positive externality and flu shots will go under produced and under consumed.
So how can government try to move the market level of output closer to the socially desirable level of output? One policy would be to provide a subsidy, like a voucher, to any citizen who wishes to get vaccinated. This voucher would act as “income” that could be used to purchase only a flu shot and, if the voucher was exactly equal to the per-unit spillover benefits, would increase market equilibrium to a quantity of QSocial and a price of PSocial where MSB equals MSC. Suppliers of the flu shots would receive payment of PSocial per vaccination, while consumers of flu shots would redeem the voucher and only pay a price of PSubsidy. When the government uses a subsidy in this way, the socially optimal quantity of vaccinations is produced.
The Market for Flu Shots with Spillover Benefits (A Positive Externality)
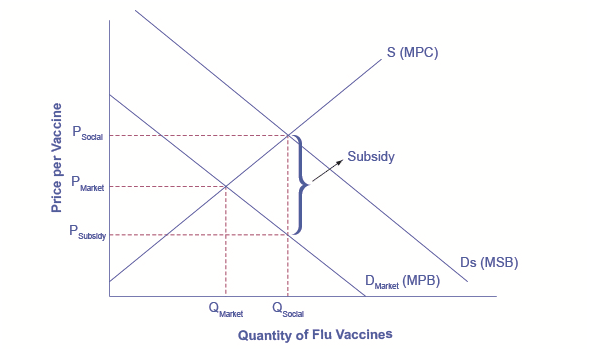
The market demand curve does not reflect the positive externality of flu vaccinations, so only QMarket will be exchanged. This outcome is inefficient because the marginal social benefit exceeds the marginal social cost. If the government provides a subsidy to consumers of flu shots, equal to the marginal social benefit minus the marginal private benefit, the level of vaccinations can increase to the socially optimal quantity of QSocial.
Economic production can cause environmental damage. This tradeoff arises for all countries, whether high-income or low-income, and whether their economies are market-oriented or command-oriented.
An externality occurs when an exchange between a buyer and seller has an impact on a third party who is not part of the exchange. An externality, which is sometimes also called a spillover, can have a negative or a positive impact on the third party. If those parties imposing a negative externality on others had to take the broader social cost of their behavior into account, they would have an incentive to reduce the production of whatever is causing the negative externality. In the case of a positive externality, the third party is obtaining benefits from the exchange between a buyer and a seller, but they are not paying for these benefits. If this is the case, then markets would tend to under-produce output because suppliers are not aware of the additional demand from others. If the parties that are generating benefits to others would be somehow compensated for these external benefits, they would have an incentive to increase production of whatever is causing the positive externality.
Command-and-control regulation sets specific limits for pollution emissions and/or specific pollution-control technologies that must be used. Although such regulations have helped to protect the environment, they have three shortcomings: they provide no incentive for going beyond the limits they set; they offer limited flexibility on where and how to reduce pollution; and they often have politically-motivated loopholes.
Examples of market-oriented environmental policies include pollution charges, marketable permits, and better-defined property rights. Market-oriented environmental policies include taxes, markets, and property rights so that those who impose negative externalities must face the social cost.
Competition creates pressure to innovate. However, if new inventions can be easily copied, then the original inventor loses the incentive to invest further in research and development. New technology often has positive externalities; that is, there are often spillovers from the invention of new technology that benefit firms other than the innovator. The social benefit of an invention, once these spillovers are taken into account, typically exceeds the private benefit to the inventor. If inventors could receive a greater share of the broader social benefits for their work, they would have a greater incentive to seek out new inventions.
 Answer the self check questions below to monitor your understanding of the concepts in this section.
Self Check Questions
- What is market failure?
- Define and explain inadequate competition. Inadequate information is listed as a problem that leads to market failure, however, can we really have too little information? Explain your point of view.
- Land, labor, capital, and entrepreneurs are the four factors of production. What will happen if those factors are immobile? Explain the economic consequences of immobile resources.
- What are externalities? Explain both the positive and negative externalities that may occur if a city were to bring in a "minor league baseball team."
- What is a public good? Give examples of public goods here in El Paso.
| Image | Reference | Attributions |
|
[Figure 2] | Credit: OpenStax College Source: https://cnx.org/contents/aWGdK2jw@11.72:hrYHpMTV@5/The-Economics-of-Pollution#CNX_Econ_C12_001 License: CC BY-NC 3.0 |
|
[Figure 3] | Credit: OpenStax College Source: https://cnx.org/contents/aWGdK2jw@11.72:bmukmAeZ@6/Market-Oriented-Environmental-Tools#CNX_Econ_C12_002 License: CC BY-NC 3.0 |
|
[Figure 4] | Credit: OpenStax College Source: https://cnx.org/contents/aWGdK2jw@11.72:V6yqj0mG@6/Why-the-Private-Sector-Under-Invests-in-Innovation#CNX_Econ_C13_002 License: CC BY-NC 3.0 |
|
[Figure 5] | Credit: OpenStax College Source: https://cnx.org/contents/aWGdK2jw@11.72:V6yqj0mG@6/Why-the-Private-Sector-Under-Invests-in-Innovation#CNX_Econ_C13_004 License: CC BY-NC 3.0 |