
3.2: Economic Development
- Page ID
- 6812
\( \newcommand{\vecs}[1]{\overset { \scriptstyle \rightharpoonup} {\mathbf{#1}} } \)
\( \newcommand{\vecd}[1]{\overset{-\!-\!\rightharpoonup}{\vphantom{a}\smash {#1}}} \)
\( \newcommand{\dsum}{\displaystyle\sum\limits} \)
\( \newcommand{\dint}{\displaystyle\int\limits} \)
\( \newcommand{\dlim}{\displaystyle\lim\limits} \)
\( \newcommand{\id}{\mathrm{id}}\) \( \newcommand{\Span}{\mathrm{span}}\)
( \newcommand{\kernel}{\mathrm{null}\,}\) \( \newcommand{\range}{\mathrm{range}\,}\)
\( \newcommand{\RealPart}{\mathrm{Re}}\) \( \newcommand{\ImaginaryPart}{\mathrm{Im}}\)
\( \newcommand{\Argument}{\mathrm{Arg}}\) \( \newcommand{\norm}[1]{\| #1 \|}\)
\( \newcommand{\inner}[2]{\langle #1, #2 \rangle}\)
\( \newcommand{\Span}{\mathrm{span}}\)
\( \newcommand{\id}{\mathrm{id}}\)
\( \newcommand{\Span}{\mathrm{span}}\)
\( \newcommand{\kernel}{\mathrm{null}\,}\)
\( \newcommand{\range}{\mathrm{range}\,}\)
\( \newcommand{\RealPart}{\mathrm{Re}}\)
\( \newcommand{\ImaginaryPart}{\mathrm{Im}}\)
\( \newcommand{\Argument}{\mathrm{Arg}}\)
\( \newcommand{\norm}[1]{\| #1 \|}\)
\( \newcommand{\inner}[2]{\langle #1, #2 \rangle}\)
\( \newcommand{\Span}{\mathrm{span}}\) \( \newcommand{\AA}{\unicode[.8,0]{x212B}}\)
\( \newcommand{\vectorA}[1]{\vec{#1}} % arrow\)
\( \newcommand{\vectorAt}[1]{\vec{\text{#1}}} % arrow\)
\( \newcommand{\vectorB}[1]{\overset { \scriptstyle \rightharpoonup} {\mathbf{#1}} } \)
\( \newcommand{\vectorC}[1]{\textbf{#1}} \)
\( \newcommand{\vectorD}[1]{\overrightarrow{#1}} \)
\( \newcommand{\vectorDt}[1]{\overrightarrow{\text{#1}}} \)
\( \newcommand{\vectE}[1]{\overset{-\!-\!\rightharpoonup}{\vphantom{a}\smash{\mathbf {#1}}}} \)
\( \newcommand{\vecs}[1]{\overset { \scriptstyle \rightharpoonup} {\mathbf{#1}} } \)
\(\newcommand{\longvect}{\overrightarrow}\)
\( \newcommand{\vecd}[1]{\overset{-\!-\!\rightharpoonup}{\vphantom{a}\smash {#1}}} \)
\(\newcommand{\avec}{\mathbf a}\) \(\newcommand{\bvec}{\mathbf b}\) \(\newcommand{\cvec}{\mathbf c}\) \(\newcommand{\dvec}{\mathbf d}\) \(\newcommand{\dtil}{\widetilde{\mathbf d}}\) \(\newcommand{\evec}{\mathbf e}\) \(\newcommand{\fvec}{\mathbf f}\) \(\newcommand{\nvec}{\mathbf n}\) \(\newcommand{\pvec}{\mathbf p}\) \(\newcommand{\qvec}{\mathbf q}\) \(\newcommand{\svec}{\mathbf s}\) \(\newcommand{\tvec}{\mathbf t}\) \(\newcommand{\uvec}{\mathbf u}\) \(\newcommand{\vvec}{\mathbf v}\) \(\newcommand{\wvec}{\mathbf w}\) \(\newcommand{\xvec}{\mathbf x}\) \(\newcommand{\yvec}{\mathbf y}\) \(\newcommand{\zvec}{\mathbf z}\) \(\newcommand{\rvec}{\mathbf r}\) \(\newcommand{\mvec}{\mathbf m}\) \(\newcommand{\zerovec}{\mathbf 0}\) \(\newcommand{\onevec}{\mathbf 1}\) \(\newcommand{\real}{\mathbb R}\) \(\newcommand{\twovec}[2]{\left[\begin{array}{r}#1 \\ #2 \end{array}\right]}\) \(\newcommand{\ctwovec}[2]{\left[\begin{array}{c}#1 \\ #2 \end{array}\right]}\) \(\newcommand{\threevec}[3]{\left[\begin{array}{r}#1 \\ #2 \\ #3 \end{array}\right]}\) \(\newcommand{\cthreevec}[3]{\left[\begin{array}{c}#1 \\ #2 \\ #3 \end{array}\right]}\) \(\newcommand{\fourvec}[4]{\left[\begin{array}{r}#1 \\ #2 \\ #3 \\ #4 \end{array}\right]}\) \(\newcommand{\cfourvec}[4]{\left[\begin{array}{c}#1 \\ #2 \\ #3 \\ #4 \end{array}\right]}\) \(\newcommand{\fivevec}[5]{\left[\begin{array}{r}#1 \\ #2 \\ #3 \\ #4 \\ #5 \\ \end{array}\right]}\) \(\newcommand{\cfivevec}[5]{\left[\begin{array}{c}#1 \\ #2 \\ #3 \\ #4 \\ #5 \\ \end{array}\right]}\) \(\newcommand{\mattwo}[4]{\left[\begin{array}{rr}#1 \amp #2 \\ #3 \amp #4 \\ \end{array}\right]}\) \(\newcommand{\laspan}[1]{\text{Span}\{#1\}}\) \(\newcommand{\bcal}{\cal B}\) \(\newcommand{\ccal}{\cal C}\) \(\newcommand{\scal}{\cal S}\) \(\newcommand{\wcal}{\cal W}\) \(\newcommand{\ecal}{\cal E}\) \(\newcommand{\coords}[2]{\left\{#1\right\}_{#2}}\) \(\newcommand{\gray}[1]{\color{gray}{#1}}\) \(\newcommand{\lgray}[1]{\color{lightgray}{#1}}\) \(\newcommand{\rank}{\operatorname{rank}}\) \(\newcommand{\row}{\text{Row}}\) \(\newcommand{\col}{\text{Col}}\) \(\renewcommand{\row}{\text{Row}}\) \(\newcommand{\nul}{\text{Nul}}\) \(\newcommand{\var}{\text{Var}}\) \(\newcommand{\corr}{\text{corr}}\) \(\newcommand{\len}[1]{\left|#1\right|}\) \(\newcommand{\bbar}{\overline{\bvec}}\) \(\newcommand{\bhat}{\widehat{\bvec}}\) \(\newcommand{\bperp}{\bvec^\perp}\) \(\newcommand{\xhat}{\widehat{\xvec}}\) \(\newcommand{\vhat}{\widehat{\vvec}}\) \(\newcommand{\uhat}{\widehat{\uvec}}\) \(\newcommand{\what}{\widehat{\wvec}}\) \(\newcommand{\Sighat}{\widehat{\Sigma}}\) \(\newcommand{\lt}{<}\) \(\newcommand{\gt}{>}\) \(\newcommand{\amp}{&}\) \(\definecolor{fillinmathshade}{gray}{0.9}\)Economic Development
Since GDP is measured in a country’s currency, in order to compare different countries’ GDPs, we need to convert them to a common currency. One way to do that is with the exchange rate, which is the price of one country’s currency in terms of another. Once GDPs are expressed in a common currency, we can compare each country’s GDP per capita by dividing GDP by population. Countries with large populations often have large GDPs, but GDP alone can be a misleading indicator of the wealth of a nation. A better measure is GDP per capita.
The rate of productivity growth is the primary determinant of an economy’s rate of long-term economic growth and higher wages. Over decades and generations, seemingly small differences of a few percentage points in the annual rate of economic growth make an enormous difference in GDP per capita. Capital deepening refers to an increase in the amount of capital per worker, either human capital per worker, in the form of higher education or skills, or physical capital per worker. A healthy climate for growth in GDP per capita consists of improvements in human capital, physical capital, and technology in a market-oriented environment with supportive public policies and institutions.
When countries with lower levels of GDP per capita catch up to countries with higher levels of GDP per capita, the process is called convergence. Convergence can occur even when both high-income and low-income countries increase investment in the physical and human capital with the objective of growing GDP. This is because the impact of new investment in physical and human capital on a low-income country may result in huge gains as new skills or equipment are combined with the labor force. In higher-income countries, however, a level of investment equal to that of the low-income country is not likely to have as big an impact, because the more developed country most likely has high levels of capital investment.
Universal Generalizations
- Developing countries face a number of obstacles that make economic growth extremely difficult.
- Developing countries are home to more than half the world's population.
Guiding Questions
- List at least three reasons why developing countries have a difficult time becoming industrialized.
- Why would social issues a country faces inhibit its ability to develop economically?
- What do you think are two of the most important things a country can do to become more industrialized?
Video: Developed vs. Developing
Why is a Country Considered Developing?
Developing countries tend to suffer from similar problems and challenges. The first major issue is population growth. Compared to developed nations, Third World countries tend to have high birth rates, high mortality rates, and a shorter life expectancy. These nations also have less health care, less educational opportunities, and limited technology. Due to poor health and limited education, it is not hard to understand why their population lacks the skills necessary to create technology or develop a sufficient infrastructure. In addition, their nation may not have the natural resources necessary for trade or industrial development. The climate and geography may not be able to sustain sufficient amounts of food or to provide adequate fresh water. Religion may also stand in the way of development. In some nations women are not allowed to be educated, to participate in politics, or to work outside of the home. When a large portion of a country is prevented from participating in the economy, in this case women, additional labor or entrepreneurs that may not be able to contribute to the growth of the nation. Another example of religion at odds with economic development regards those religions that are not interested in the Western concept of economic growth and development.
A developing country may have a difficult time acquiring international loans, paying off current debts, or preventing its own capital from leaving the country (capital flight). Lastly, some Third World nations experience corruption in the government and in the economy. When a nation allows bribery and deceit to do business, it prevents economic development from taking place by those who would benefit most from economic growth. The impact of war can affect any nation, however, when examining developing nations, it tends to have the most immediate and long-lasting consequences. War destroys limited infrastructure and agriculture, creates additional chaos and refugees, and may cause the "intelligentsia" to flee.
Poverty and Economic Development
Throughout most of history, poverty has been the human condition. For most people life was, in the words of 17th-century English philosopher Thomas Hobbes, “solitary, poor, nasty, brutish, and short.” Only within the past 200 years have a handful or so of countries been able to break the chains of economic deprivation and poverty.
Consider these facts:
- Over a third of the world’s people live in countries in which total per capita income in 2005 was less than $610 per year; 85% live in countries in which total per capita income in 2005 was $2,808 or less. Adjusting for purchasing power, the per capita income levels would be $2,531 and $7,416, respectively. The latter numbers compare to per capita income in high-income countries of over $30,000.
- Babies born in poor countries are 16 times more likely to die in their first five years than babies born in rich countries.
- About a quarter of the populations of low-income countries is undernourished.
- About 40% (over 50% for women) of the people 15 years old and older in low-income countries are illiterate.
- Roughly one-fourth of the people in low-income countries do not have access to safe drinking water.
United Nations Development Program, Human Development Report 2007/2008 (New York: Palgrave Macmillan, 2007).
Clearly, the high standards of living enjoyed by people in the world’s developed economies are the global exception, not the rule. This chapter looks at the problem of improving the standard of living in poor countries.
Rich and Poor Nations
The World Bank, an international organization designed to support economic development by providing financial assistance, advice, and other resources to poor countries, classifies over 200 countries according to their levels of per capita gross national income. The categories in its 2008 report, as shown in Table 19.1, were as follows:
- Low-income countries: These countries had per capita incomes of $935 or less in 2007. There were 49 countries in this category. About 20% of the world’s total population of about 6.5 billion people lived in low-income countries in 2007.
- Middle-income countries: There were 95 countries with per capita incomes of more than $936 but less than $11,455. Middle-income countries are further subdivided into lower middle-income and upper middle-income countries. Roughly two-thirds of the world’s population lived in middle-income countries in 2007. We should note that the percentage of the world’s population living in middle-income countries increased dramatically (and the percentage living in low-income countries decreased dramatically) when China and India moved from being low-income to middle-income countries.
- High-income countries: There were 65 nations with per capita incomes of $11,456 or more. Just 16% of the world’s total population lived in high-income countries in 2007.
Countries in the low-income and middle-income categories are often called developing countries. A developing country is thus a country that is not among the high-income nations of the world. The World Development Report 2006 (New York: Oxford University Press, 2006, xiv), comments on this usage: “The term developing countries include low- and middle-income economies and thus may include economies in transition from central planning, as a matter of convenience. The term advanced countries may be used as a matter of convenience to denote high-income economics.” Developing countries are sometimes referred to as third-world countries.
How does the World Bank compare incomes across countries? The World Bank converts gross national income (GNI) figures to dollars in two ways. One is to take GNI in a local currency and convert using the exchange rate, averaged over a three-year period in order to smooth out the effects of currency fluctuations. This type of comparison can, however, be misleading. A country could have a relatively high standard of living but, for a variety of reasons, a low exchange rate. The per capita GNI figure would be quite low; the country would appear to be poorer than it is.
A better approach to comparing incomes converts currencies to dollars on the basis of purchasing power. This measure is reported in what is called international dollars. An international dollar has the same purchasing power as does a U.S. dollar in the United States. This is reported in the column labeled “2007 International $” in Figure 1:.
Figure 1: World Incomes, Selected Countries
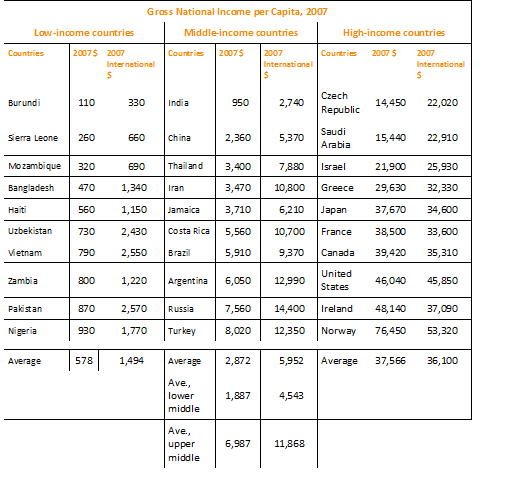
Source: World Development Indicators database, World Bank, revised October 17, 2008.
The international dollar estimates typically show higher incomes than estimates based on an exchange rate conversion. For example, in 2007 Mozambique’s per capita GNI, based on exchange rates, was $320. Its per capita GNI based the international dollars was $690.
Ranking of countries, both rich and poor, by per capita GNI differs depending on the measure used. According to the per capita GNI figures in Table 19.1, which convert data in domestic currencies to dollars using exchange rates, the United States ranked fifteenth of all countries in 2007. Using the international dollars method, its rank is tenth. China is ranked at 132 when per capita GNI is based on the exchange rate conversion method but rises to 122 based on the international dollar method.
Characteristics of Low-Income Countries
Low incomes are often associated with other characteristics: severe inequality, poor health care and education, high unemployment, heavy reliance on agriculture, and rapid population growth. We will examine most of these problems in this section. Population growth in low-income nations is examined later in the chapter.
Inequality
Not only are incomes in low-income countries quite low; income distribution is often highly unequal. Poverty is far more prevalent than per capita numbers suggest, as illustrated by Lorenz curves, introduced in the chapter on inequality, that show the cumulative shares of income received by individuals or groups.
Consider Costa Rica and Panama, two Latin American countries with roughly equivalent levels of per capita GNI (Costa Rica’s was $5,560 and Panama’s $5,510 in 2007). Panama’s income distribution is comparatively less equal, while Costa Rica’s is far more equal. Figure 2: compares the 2003 Lorenz curves for Costa Rica and Panama, the most recent year for which the information was available. The 20% of the households with the lowest incomes in Costa Rica had twice as large a share of their country’s total income as did the bottom 20% of households in Panama. That means Costa Rica’s poor were about twice as well off, in material terms, as Panama’s poor.
Figure 2: Poverty and the Distribution of Income: Costa Rica versus Panama
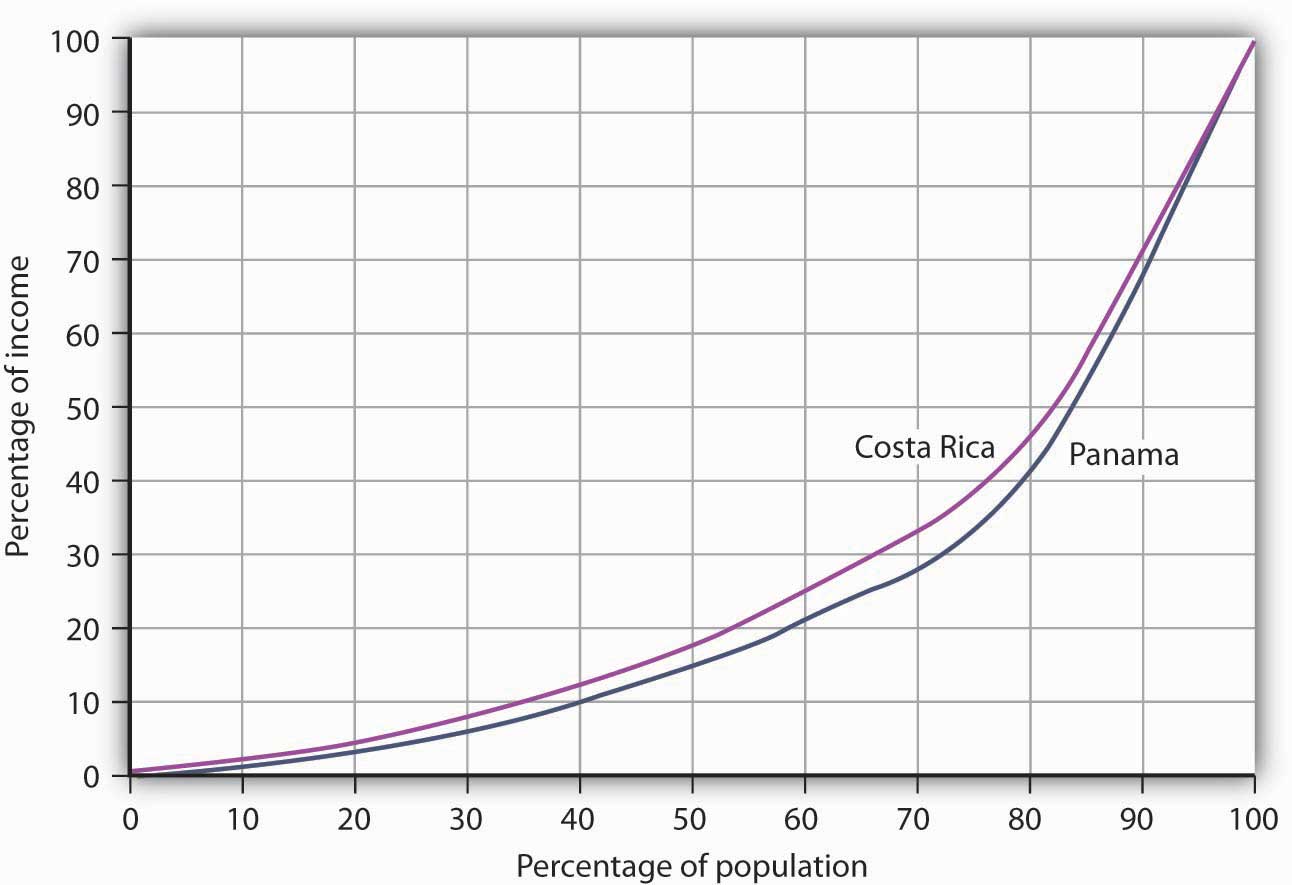
Source: World Development Indicators Online (revised October 17, 2008). Costa Rica had about the same per capita GNI as Panama in 2003, but Panama’s income distribution was far more unequal. Panama’s poor had much lower living standards than Costa Rica’s poor, as suggested by the Lorenz curves for the two nations.
In general, the greater the degree of inequality, the more desperate is the condition of people at the bottom of an income distribution. Given the high degree of inequality in many low-income countries, it is very important to look at income distributions when we compare living standards in different countries.
Video: The Education Crisis in Developing Countries
Health and Education
Poor nations are typically characterized by low levels of human capital. Where health-care facilities are inadequate, that human capital can be reduced further by disease. Where educational resources are poor, there will be little progress in improving human capital. One indicator of poor health care appears on the supply side. Low-income countries have fewer doctors, relative to their populations than high-income countries. For example, the UN estimates that in 2006 about 60% of mothers giving birth in developing countries had access to a skilled health-care provider (doctor, nurse, or midwife). While that is up from 47% in 1990, the lack of access to a healthcare provider may explain much of the difference in maternal death rates between developed and developing countries: about nine maternal deaths per 100,000 live births in developed countries compared to about 450 per 100,000 in developing countries. (Source: United Nations, The Millennium Development Goals Report 2008, 27)
We can also see the results of poor health care in statistics on health. Among the world’s developing countries, the infant mortality rate, which reports deaths in the first year of life, was 57 per 1,000 live births in 2005. There were six infant deaths per 1,000 live births among the high-income countries that year. (Source: United Nations Development Program, Human Development Report 2007/2008 (New York: Palgrave Macmillan, 2007), 264.)
Another health issue facing the world’s low-income countries is malnutrition. Malnutrition rates in all developing countries in the 2002 to 2004 period averaged 17%, while 35% was the standard in the least developed countries.
Still another issue is the spread of HIV/AIDS. Here there is some progress. The number of people newly infected declined from 3 million in 2001 to 2.7 million in 2005. Antiretroviral treatments are also leading to a reduction in deaths from 2.2 million in 2005 to 2 million in 2007. Longer survival means that the number of people living with HIV (from just under 30 million in 2001 to about 33 million in 2007) is rising and most of the people living with HIV are in Sub-Saharan Africa. (Source: United Nations, The Millennium Development Goals Report 2008, 30).
Education in poor- and middle-income nations is improving. In 1991, about 80% of children in developing countries were enrolled in primary schools. In 2005, about 85% were. The comparable numbers in developed countries are about 95%. Enrollment rates taper off for high school (about 53% in 2005 in developing countries compared to 91% in developed countries). (Source: United Nations Development Program, Human Development Report 2007/2008 (New York: Palgrave Macmillan, 2007), 272.)
Unemployment
Unemployment is pervasive in low-income nations. These nations, already faced with low levels of potential output, are producing well below their potential. Unemployment rates in low-income countries vary widely, reaching as high as 15% or more in some countries. If we count discouraged workers, people who have given up looking for work but who would take it if it were available, and people who work less than full time, not by choice but because more work is unavailable, then unemployment in low-income countries soars—often to more than 30%.
Migration within low-income countries often contributes to unemployment in urban areas. Factors such as ethnic violence, poverty, and drought often force people to move from rural areas to cities, where unemployment rates are already high.
Reliance on Agriculture
One of the dominant characteristics of poor nations is the concentration of employment in agriculture. Another is the very low productivity of that employment. Agriculture in low-income countries often employs a majority of the population but produces less than one-third of GDP.
One of the primary forces behind income growth in wealthy countries has been the shift of labor out of agriculture and into more productive sectors such as manufacturing. This shift is also occurring in low-income nations but has lagged far behind.
The solution to these problems lies in economic development, to which we turn next.
Economic Development: A Definition
If the problems of low-income nations are pervasive, the development that helps to solve those problems must transform the very nature of their societies. The late Austrian economist Joseph Schumpeter described economic development as a revolutionary process. Whereas economic growth implies a quantitative change in production processes that are already familiar to the society, economic development requires a qualitative change in virtually every aspect of life.
Viewpoint:
"Economic development is political and social change on a wrenching and tearing scale. … It is a process of institutional birth and institutional death. It is a time when power shifts, often violently and abruptly, a time when old regimes go under and new ones rise in their places. And these are not just the unpleasant side effects of development. They are part and parcel of the process, the very driving force of change itself."
Economic development transforms a nation at its core. But what, precisely, is development? Many definitions follow Heilbroner in noting the massive institutional and cultural changes economic development involves. Whatever the requirements of development, its primary characteristics are rising incomes and improving standards of living. That means output must increase—and it must increase relative to population growth. Because inequality is such a serious a problem in low-income nations, development must deliver widespread improvement in living conditions. Therefore, it seems useful to define economic development as a process that produces sustained and widely shared gains in per capita real GDP.
In recent years, the United Nations has constructed measures incorporating dimensions of economic development that go beyond the level of per capita GDP. The Human Development Index (HDI) includes three dimensions—life expectancy, educational attainment (adult literacy and combined primary, secondary, and post-secondary enrollment), as well as purchasing-power-adjusted per capita real GDP. The Gender Development Index (GDI) uses the same variables as the HDI but adjusts them downward to take into account the extent of gender inequality. A third index, the Human Poverty Index (HPI), measures human deprivation and includes such indicators as the percentage of people expected to die before age 40, the percentage of underweight children under age 5, the percentage of adults who are illiterate, and the percentage of people who live in poverty. The number reported for the HPI shows the percentage of people in the country who suffer these deprivations.
Table 1: shows the HDI, the GDI rank, and the HPI for selected countries, by HDI rank. The HDI is constructed to have an upper limit of 1. Canada’s HDI is 0.96; the United States’ is 0.95. As the table shows, the HDIs for developing countries range from 0.87 in Argentina to 0.34 in Sierra Leone. The greater the difference between the HDI and the GDI of a country, the greater the disparity in achievement between males and females in the country. Countries can have similar HDIs but different GDIs or HPIs. By looking at a variety of measures, we come closer to examining the extent to which the gains in income growth have been shared or not.
| HDI rank | Country | Human Development Index (HDI), 2005 | Gender-Related Development Index (GDI) 2005, Rank | Human Poverty Index (HPI), % 2005The definition of deprivation for developed countries applies a higher standard than it does for developing countries. |
| 1 | Iceland | 0.968 | 1 | NA |
| 2 | Norway | 0.968 | 3 | 6.8 |
| 4 | Canada | 0.961 | 4 | 10.9 |
| 10 | France | 0.952 | 7 | 11.2 |
| 12 | United States | 0.951 | 16 | 15.4 |
| 24 | Greece | 0.926 | 24 | NA |
| 32 | Czech Republic | 0.891 | 29 | NA |
| 38 | Argentina | 0.869 | 36 | 4.1 |
| 48 | Costa Rica | 0.846 | 47 | 4.4 |
| 61 | Saudi Arabia | 0.812 | 70 | NA |
| 67 | Russian Federation | 0.802 | 59 | NA |
| 70 | Brazil | 0.8 | 60 | 9.7 |
| 78 | Thailand | 0.781 | 71 | 10.0 |
| 81 | China | 0.777 | 73 | 11.7 |
| 84 | Turkey | 0.775 | 79 | 9.2 |
| 90 | Philippines | 0.771 | 77 | 15.3 |
| 94 | Iran | 0.759 | 84 | 12.9 |
| 101 | Jamaica | 0.736 | 90 | 14.3 |
| 105 | Viet Nam | 0.733 | 91 | 15.2 |
| 114 | Mongolia | 0.7 | 100 | NA |
| 117 | Bolivia | 0.695 | 103 | 13.6 |
| 126 | Morocco | 0.646 | 112 | 33.4 |
| 128 | India | 0.619 | 113 | 31.3 |
| 135 | Ghana | 0.553 | 117 | 32.3 |
| 136 | Pakistan | 0.551 | 125 | 36.2 |
| 148 | Kenya | 0.521 | 127 | 30.8 |
| 154 | Uganda | 0.505 | 132 | 34.7 |
| 156 | Senegal | 0.499 | 135 | 42.9 |
| 173 | Mali | 0.38 | 151 | 56.4 |
| 177 | Sierra Leone | 0.336 | 157 | 51.7 |
Source: United Nations Development Program, Human Development Report 2007/2008 (New York: Palgrave Macmillan, 2007).
Population Growth and Economic Development
It is easy to see why some people have become alarmists when it comes to population growth rates in developing nations. Looking at the world’s low-income countries, they see a population of more than 2 billion growing at a rate that suggests a doubling every 31 years. How will we cope with so many more people? The following statement captures the essence of widely expressed concerns:
“At the end of each day, the world now has over two hundred thousand more mouths to feed than it had the day before; at the end of each week, one and one-half million more; at the close of each year, an additional eighty million. … Humankind, now doubling its numbers every thirty-five years, has fallen into an ambush of its own making; economists call it the “Malthusian trap,” after the man who most forcefully stated our biological predicament: population growth tends to outstrip the supply of food.
(Source: Phillip Appleman, ed., Thomas Robert Malthus: An Essay on the Principle of Population - Text, Sources, and Background, Criticism (New York: Norton, 1976), xi.)
But what are we to make of such a statement? Certainly, if the world’s population continues to increase at the rate that it grew in the past 50 years, economic growth is less likely to be translated into an improvement in the average standard of living. However, the rate of population growth is not a constant; it is affected by other economic forces. This section begins with a discussion of the relationship between population growth and income growth, then turns to an explanation of the sources of population growth in low-income countries, and closes with a discussion of the Malthusian warning suggested in the quote above.
Population Growth and Income Growth
On a simplistic level, the relationship between growth in population and growth in per capita income is clear. After all, per capita income equals total income divided by population. The growth rate of per capita income roughly equals the difference between the growth rate of income and the growth rate of population. Kenya’s annual growth rate in real GDP from 1975 to 2005, for example, was 3.3%. Its population growth rate during that period was 3.2%, leaving it a growth rate of per capita GDP of just 0.1%. A slower rate of population growth, together with the same rate of GDP increase, would have left Kenya with more impressive gains in per capita income. The implication is that if the developing countries want to increase their rate of growth of per capita GDP relative to the developed nations, they must limit their population growth.
Figure 3: plots growth rates in population versus growth rates in per capita GDP from 1975 to 2005 for more than 100 developing countries. We do not see a simple relationship. Many countries experienced both rapid population growth and negative changes in real per capita GDP. But still others had relatively rapid population growth, yet they had a rapid increase in per capita GDP. Clearly, there is more to achieving gains in per capita income than a simple slowing in population growth. But the challenge raised at the beginning of this section remains: Can the world continue to feed a population that is growing exponentially—that is, doubling over fixed intervals?
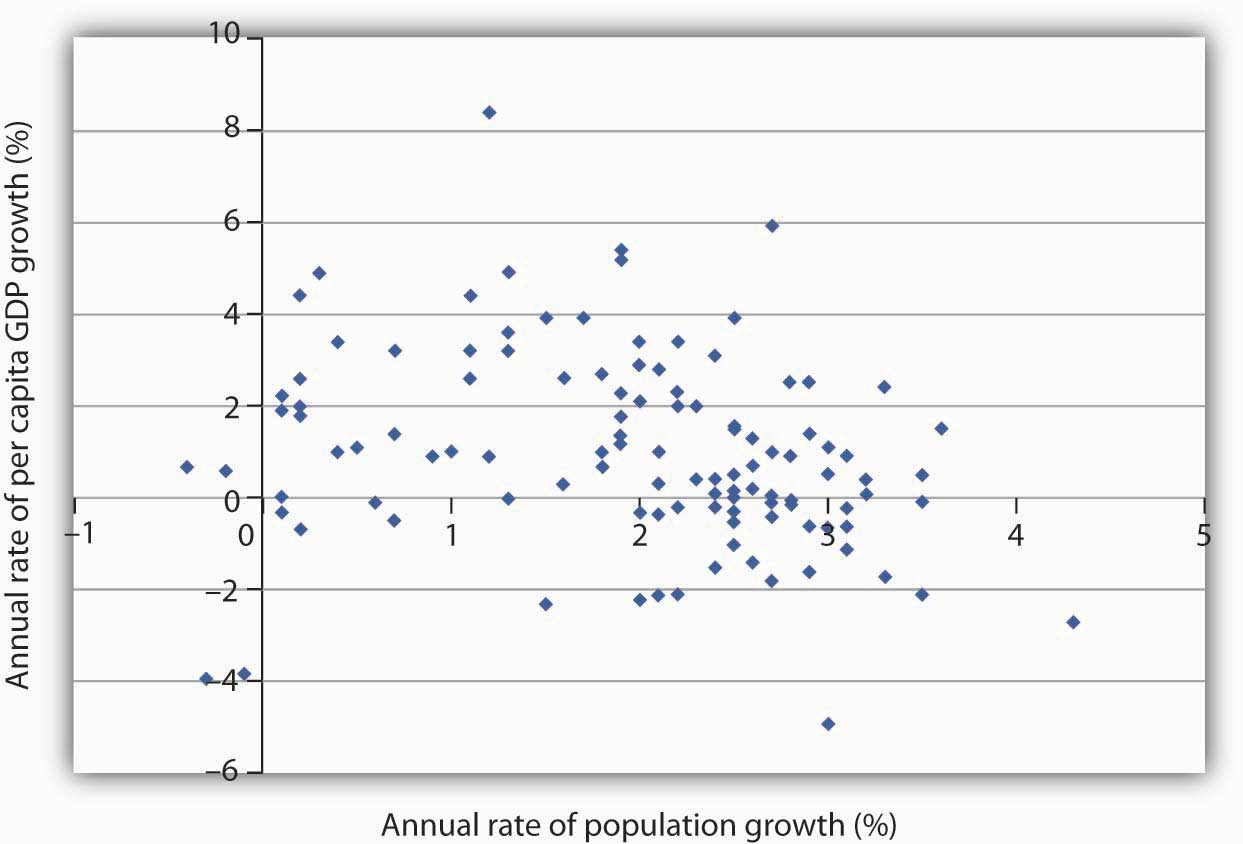
A scatter chart of population growth rates versus GNP per capita growth rates for various developing countries for the period 1975–2005 suggests no systematic relationship between the rates of population and of income growth.
Source: United Nations Development Program, Human Development Report 2007/2008 (New York: Palgrave Macmillan, 2007).
In 1798, Thomas Robert Malthus published his Essay on the Principle of Population. It proved to be one of the most enduring works of the time. Malthus’s fundamental argument was that population growth will inevitably collide with diminishing returns.
Diminishing returns imply that adding more labor to a fixed quantity of land increases output but by ever smaller amounts. Eventually, Malthus concluded, increases in food production would be too small to sustain the increased number of human beings who consume that output. As the population continued to grow unchecked, the number of people would eventually outstrip the ability of the land to generate enough food. There would be an inevitable Malthusian trap, a point at which the world is no longer able to meet the food requirements of the population, and starvation becomes the primary check to population growth.
A Malthusian trap is illustrated in the graph below titled "The Malthusian Trap". We can determine the total amount of food needed by multiplying the population in any period by the amount of food required to keep one person alive. Because population grows exponentially, food requirements rise at an increasing rate, as shown by the curve labeled “Food required.” Food produced, according to Malthus, rises by a constant amount each period; its increase is shown by an upward-sloping straight line labeled “Food produced.” Food required eventually exceeds food produced, and the Malthusian trap is reached at time t1. The faster the rate of population growth, the sooner t1 is reached.
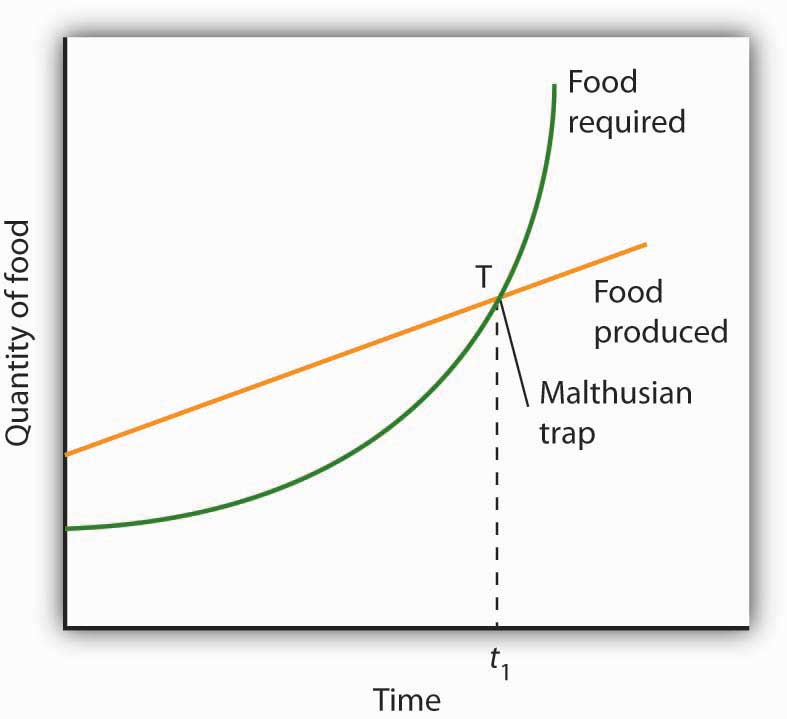
If the population grows at a fixed exponential rate, the amount of food required will increase exponentially. But Malthus held that the output of food could increase only by a constant amount each period. Given these two different growth processes, food requirements would eventually catch up with food production. The population hits the subsistence level of food production at the Malthusian trap, shown here at point T.
What Happens at the Malthusian Trap?
Clearly, there is not enough food to support the population growth implied by the “Food required” curve. Instead, people starve, and the population begins rising arithmetically, held in check by the “Food produced” curve. Starvation becomes the limiting force for the population; the population lives at the margin of subsistence. For Malthus, the long-run fate of human beings was a standard of living barely sufficient to keep them alive. As he put it, “the view has a melancholy hue.”
Happily, Malthus’s predictions do not match the experience of Western societies in the 19th- and 20th-centuries. One weakness of his argument is that he failed to take into account the gains in output that could be achieved through increased use of physical capital and new technologies in agriculture. Increases in the amount of capital per worker in the form of machines, improved seed, irrigation, and fertilization have made possible huge increases in agricultural output at the same time as the supply of labor was rising. Agricultural productivity rose rapidly in the United States over the last two centuries, just the opposite of the fall in productivity expected by Malthus. Productivity has continued to expand.
Malthus was wrong as well about the relationship between population growth and income. He believed that any increase in income would boost population growth. But the law of demand tells us that the opposite may be true: higher incomes tend to reduce population growth. The primary cost of having children is the opportunity cost of the parents’ time in raising them—higher incomes increase this opportunity cost. Higher incomes increase the cost of having children and tend to reduce the number of children people want and thus to slow population growth.
Panel (a) of Figure 5: shows the birth rates of low-, middle-, and high-income countries for the period 2000–2005. We see that the higher the income level, the lower the birth rate. Fewer births translate into slower population growth. In Panel (b), we see that high-income nations had much slower rates of population growth than did middle- and low-income nations over the last 30 years.
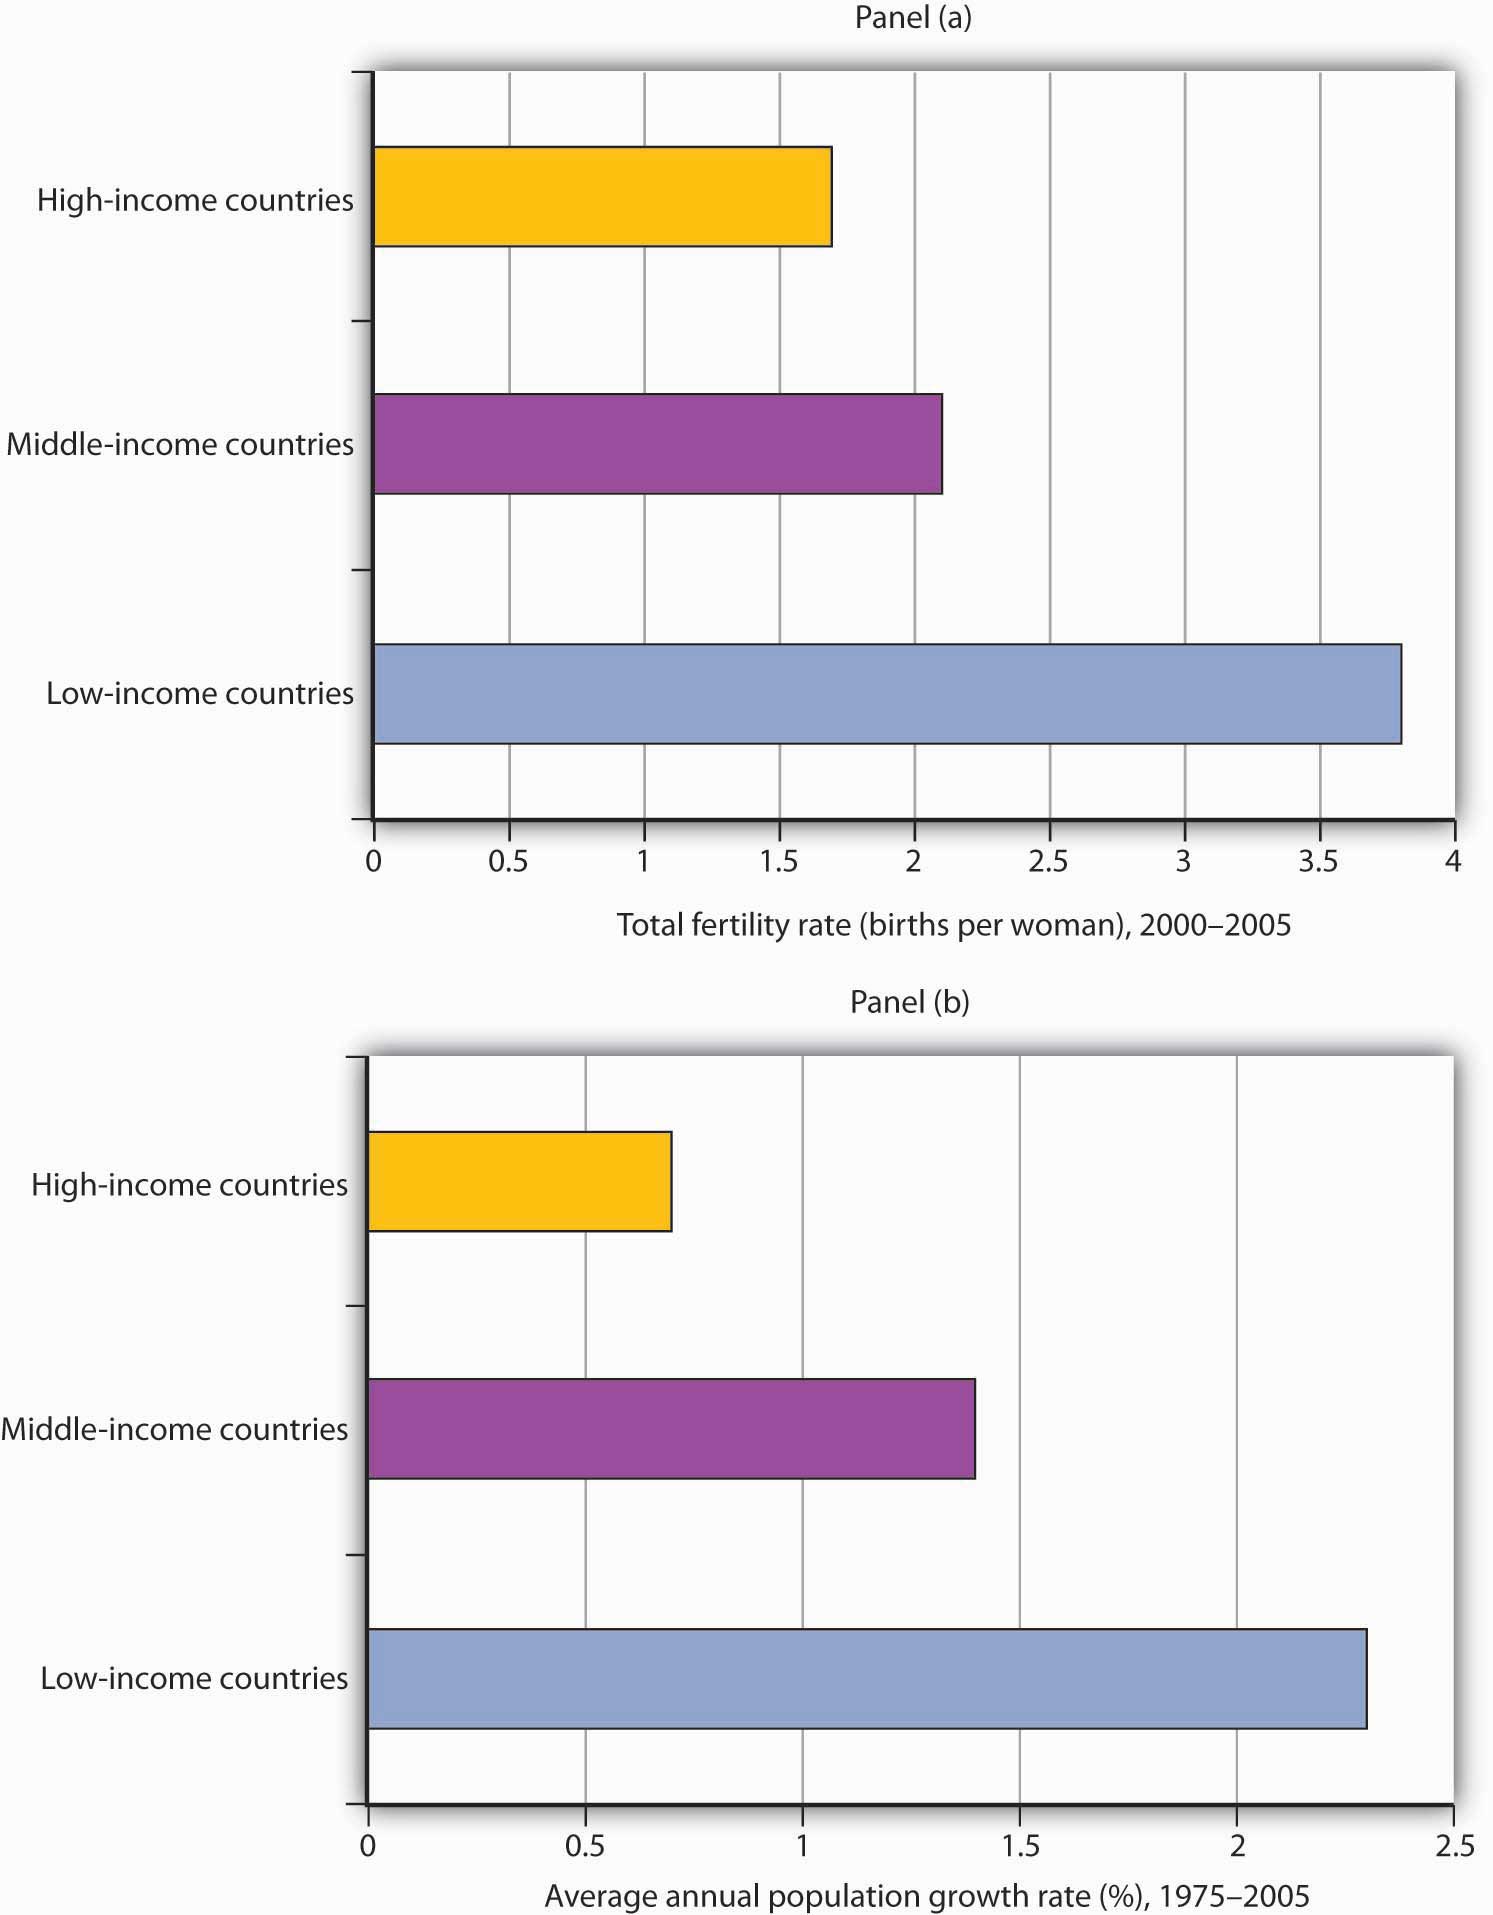
Source: World Development Indicators database, World Bank, revised October 17, 2008. Panel (a) shows that low-income nations had much higher total fertility rates (births per woman) during the 2000–2005 period than did high-income nations. In Panel (b), we see that low-income nations had a much higher rate of population growth during the 1975–2005 period.
An increase in a nation’s income can be expected to slow its rate of population growth. Hong Kong, for example, has enjoyed dramatic gains in income since the 1960s. Its birth rate and rate of population growth have fallen by over half during that time.
If economic development can slow population growth, it can also increase it. One of the first gains a developing nation can achieve are improvements in such basics as the provision of clean drinking water, improved sanitation, and public health measures such as vaccination against childhood diseases. Such gains can dramatically reduce disease and death rates. As desirable as such gains are, they also boost the rate of population growth. Nations are likely to enjoy sharp reductions in death rates before they achieve gains in per capita income. That can accelerate population growth early in the development process. Demographers have identified a process of demographic transition in which population growth rises with a fall in death rates and then falls with a reduction in birth rates.
The process of demographic transition has unfolded in a strikingly different manner in developed versus less developed nations over the past two centuries. In 1800, birth rates barely exceeded death rates in both developed and less developed countries. The result was a rate of population growth of only about 0.5% per year worldwide. By 1900, the death rate in developed nations had fallen by about 25%, with little change in the birth rate. Among developing nations, the birth rate was unchanged, while the death rate was down only slightly. The combined result was a modest increase in the rate of world population growth.
Changes were much more rapid in the 20th century. By 1965, the death rate among developed nations had plunged to about one-quarter of its 1800 level, while the birth rate had fallen by half. In developing nations, death rates took a similarly dramatic drop, while birth rates showed little change. The result was dramatic world population growth.
The world’s high-income economies have completed the demographic transition. Less developed nations have begun to make progress, with birth rates falling by a slightly greater percentage than death rates. The results have been a sharp slowing in the rate of population growth among high-income nations and a more modest slowing among low-income nations. Continued slowing in population growth at all income levels is suggested in Figure 6:.
Between 1965 and 1980, the world population grew at an annual rate of 2%, suggesting a doubling time of 36 years. For the world as a whole, it is predicted that population growth will slow to a 1.1% rate during the 2005–2015 period, a rate that would imply a doubling time of 65 years.
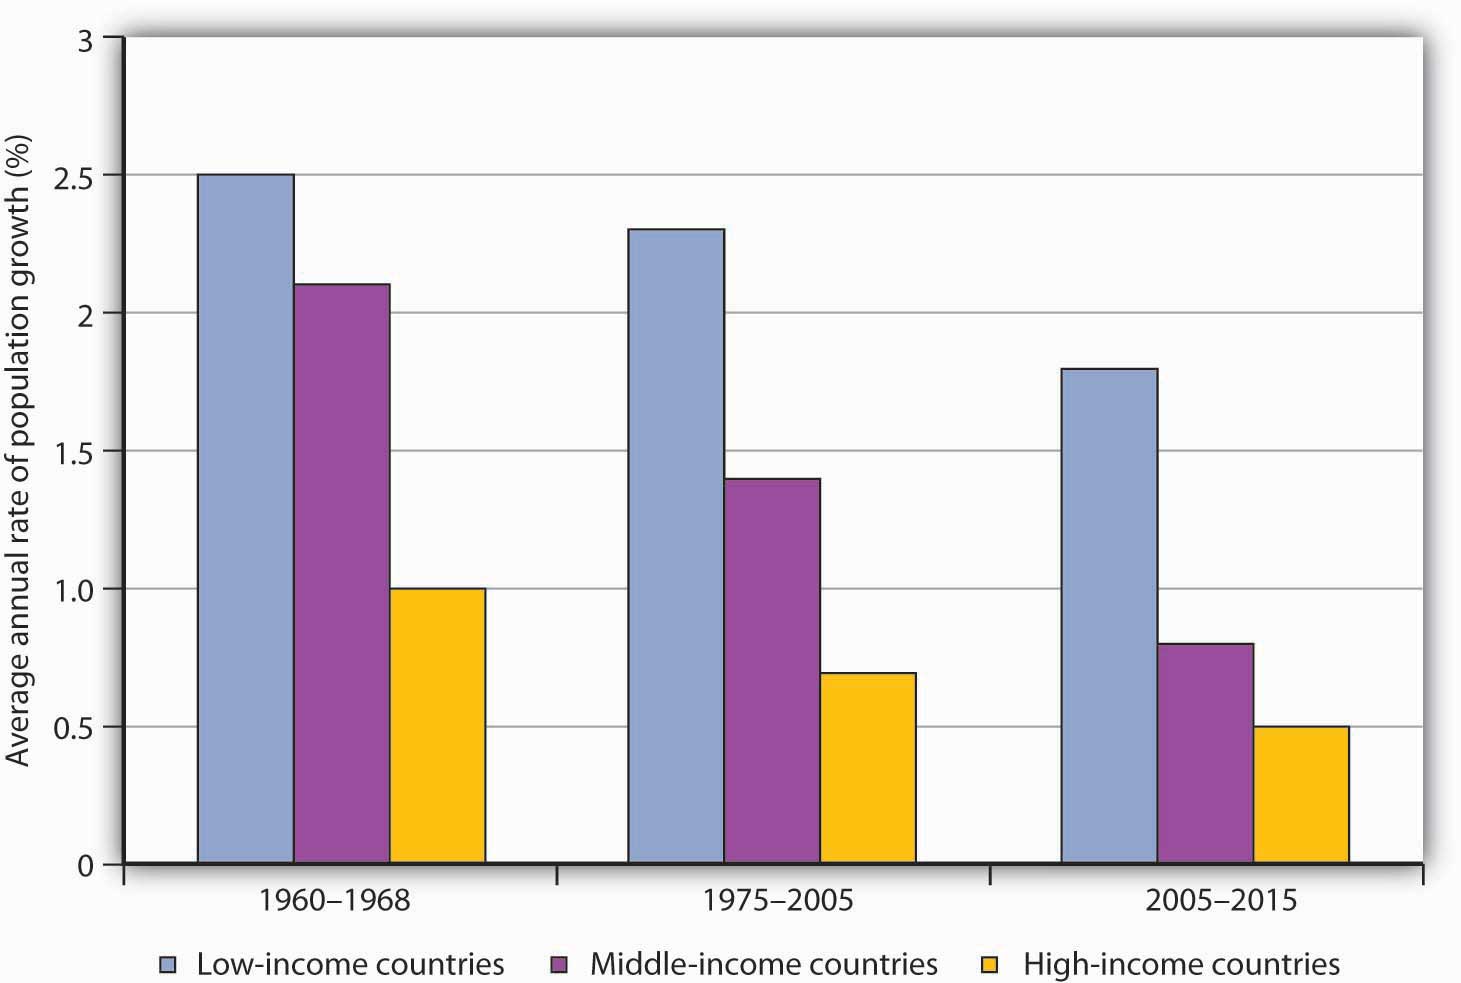
Source: United Nations Development Program, Human Development Report 2007/2008 (New York: Palgrave Macmillan, 2007) for periods 1975–2000 and 2005–2015, United Nations Development Program, Human Development Report 1990 (New York, Oxford: Oxford University Press, 1990) for the 1960–1988 period, in which categories refer to low, middle, and high human development rankings.
Case in Point: China Curtails Population Growth
China is an example of a country that has achieved a very low rate of population growth and a very high rate of growth in per capita GNP.
China’s low rate of population growth represents a dramatic shift. As recently as the early 1970s, China had a relatively high rate of population growth; its population expanded at an annual rate of 2.7% from 1965 to 1973. By the 1980s, that rate had plunged to 1.5%. The World Bank reports a growth rate in China’s population of about 1% in the early part of the 21st-century.
This dramatic drop in the population growth rate was brought about by a strict government policy by which couples are allowed to have only one child. Disincentives have been known to include fines, loss of employment, confiscation of property, demolition of homes, forced abortions, and sterilization. While the Chinese government has denied that forced abortions and sterilizations are part of its strategy, policies are administered locally, and all of the above means of coercion seem to have been employed at one time or another. If a woman who already has one child becomes pregnant, she will most likely be forced to have an abortion.
Although the policy has achieved its desired result—reduced population growth—it has had some horrible side effects. Given a strong cultural tradition favoring having a son, some couples resort to infanticide as a means of eliminating newborn daughters. When the sex of an unborn baby is determined to be female, abortion is common.
The coercive aspects of China’s policies and their undesirable side effects have been condemned by many governments around the world, as well as by nongovernmental organizations. Declarations from United Nations’ conferences—the U.N. Conference on Population in Cairo in 1994 and the U.N. Conference on Women in Beijing in 1995—have emphasized that birth rates are linked to the economic conditions of women and that improving health, education, and employment opportunities for women constitutes a better and more humane way of reducing birth rates. Fearful that pro-democracy and human rights activists from other countries might stir up those movements locally, the Chinese government actually designed the 1995 Beijing Conference so as to minimize contact between Chinese and foreigners.
There are signs, though, that Chinese officials may have heard the message. In a number of counties in China, experimental programs with slogans such as “Carry out Contraception and Family Planning Measures Voluntarily” are underway. The new approach to family planning emphasizes health care, education, and reduction in poverty to encourage women to have fewer children.
International pressures may only be part of the reason for the emerging Chinese change of heart. In the late 1980s, Chinese officials discovered that the number of births in China was being underreported by about 30%. The aggressive policies may not have been as successful as they were cracked up to be.
Labor Productivity and Economic Growth
Sustained long-term economic growth comes from increases in worker productivity, which essentially means how well we do things. In other words, how efficient is your nation with its time and workers? Labor productivity is the value that each employed person creates per unit of his or her input. The easiest way to comprehend labor productivity is to imagine a Canadian worker who can make 10 loaves of bread in an hour versus a U.S. worker who in the same hour can make only two loaves of bread. In this fictional example, the Canadians are more productive. Being more productive essentially means you can do more in the same amount of time. This, in turn, frees up resources to be used elsewhere.
What determines how productive workers are? The answer is pretty intuitive. The first determinant of labor productivity is human capital. Human capital is the accumulated knowledge (from education and experience), skills, and expertise that the average worker in an economy possesses. Typically the higher the average level of education in an economy, the higher the accumulated human capital and the higher the labor productivity.
The second factor that determines labor productivity is technological change. Technological change is a combination of invention—advances in knowledge—and innovation, which is putting that advance to use in a new product or service. For example, the transistor was invented in 1947. It allowed us to miniaturize the footprint of electronic devices and use less power than the tube technology that came before it. Innovations since then have produced smaller and better transistors that that are ubiquitous in products as varied as smart-phones, computers, and escalators. The development of the transistor has allowed workers to be anywhere with smaller devices. These devices can be used to communicate with other workers, measure product quality or do any other task in less time, improving worker productivity.
The third factor that determines labor productivity is economies of scale. Recall that economies of scale are the cost advantages that industries obtain due to size. Consider again the case of the fictional Canadian worker who could produce 10 loaves of bread in an hour. If this difference in productivity was due only to economies of scale, it could be that Canadian workers had access to a large industrial-size oven while the U.S. worker was using a standard residential size oven.
Sources of Economic Growth: The Aggregate Production Function
To analyze the sources of economic growth, it is useful to think about a production function, which is the process of turning economic inputs like labor, machinery, and raw materials into outputs like goods and services used by consumers. A microeconomic production function describes the inputs and outputs of a firm, or perhaps an industry. In macroeconomics, the connection from inputs to outputs for the entire economy is called an aggregate production function.
Components of the Aggregate Production Function
Economists construct different production functions depending on the focus of their studies. Figure 7 presents two examples of aggregate production functions. In the first production function, shown in Figure 7 (a), the output is GDP. The inputs in this example are workforce, human capital, physical capital, and technology.
Figure 7: Aggregate Production Functions
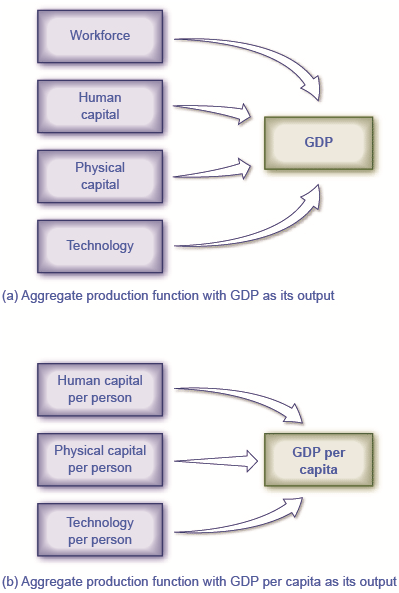
An aggregate production function shows what goes into producing the output for an overall economy. (a) This aggregate production function has GDP as its output. (b) This aggregate production function has GDP per capita as its output. Because it is calculated on a per-person basis, the labor input is already figured into the other factors and does not need to be listed separately.
Measuring Productivity
An economy’s rate of productivity growth is closely linked to the growth rate of its GDP per capita, although the two are not identical. For example, if the percentage of the population who holds jobs in an economy increases, GDP per capita will increase but the productivity of individual workers may not be affected. Over the long term, the only way that GDP per capita can grow continually is if the productivity of the average worker rises or if there are complementary increases in capital.
A common measure of U.S. productivity per worker is dollar value per hour the worker contributes to the employer’s output. This measure excludes government workers, because their output is not sold in the market and so their productivity is hard to measure. It also excludes farming, which accounts for only a relatively small share of the U.S. economy. Figure 8 shows that the average amount produced by a U.S. worker in an hour averaged over $100 in 2011, more than twice the amount an average worker produced per hour in 1966.
Figure 8: Output per Hour Worked in the U.S. Economy, 1947–2011
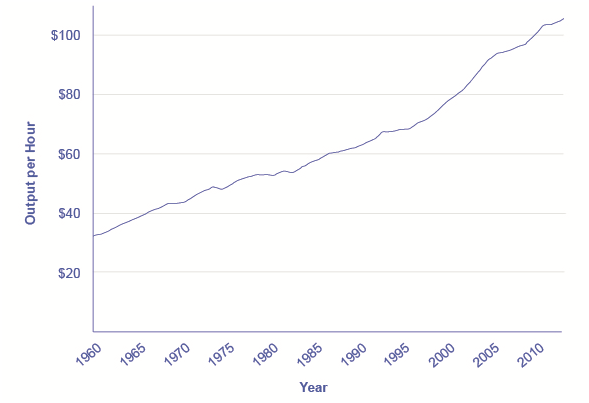
Output per hour worked is a measure of worker productivity. In the U.S. economy, worker productivity rose more quickly in the 1960s and the mid-1990s compared with the 1970s and 1980s. However, these growth-rate differences are only a few percentage points per year. Look carefully to see them in the changing slope of the line. The average U.S. worker produced nearly $105 per hour in 2012. (Source: U.S. Department of Labor, Bureau of Labor Statistics.)
The “New Economy” Controversy
In recent years a controversy has been brewing among economists about the resurgence of U.S. productivity in the second half of the 1990s. One school of thought argues that the United States had developed a “new economy” based on the extraordinary advances in communications and information technology of the 1990s. The most optimistic proponents argue that it would generate higher average productivity growth for decades to come. The pessimists, on the other hand, argue that even five or ten years of stronger productivity growth does not prove that higher productivity will last for the long term. It is hard to infer anything about long-term productivity trends during the later part of the 2000s, because the steep recession of 2008–2009, with its sharp but not completely synchronized declines in output and employment, complicates any interpretation.
Productivity growth is also closely linked to the average level of wages. Over time, the amount that firms are willing to pay workers will depend on the value of the output those workers produce. If a few employers tried to pay their workers less than what those workers produced, then those workers would receive offers of higher wages from other profit-seeking employers. If a few employers mistakenly paid their workers more than what those workers produced, those employers would soon end up with losses. In the long run, productivity per hour is the most important determinant of the average wage level in any economy.
The Organization for Economic Co-operation and Development (OECD) tracks data on the annual growth rate of real GDP per hour worked. You can find these data on the OECD data webpage “Labour productivity growth in the total economy”.
Step 1. Visit the OECD website given above and select two countries to compare.
Step 2. On the drop-down menu “Variable,” select “Real GDP, Annual Growth, in percent” and record the data for the countries you have chosen for the five most recent years.
Step 3. Go back to the drop-down menu and select “Real GDP per Hour Worked, Annual Growth Rate, in percent” and select data for the same years for which you selected GDP data.
Step 4. Compare real GDP growth for both countries.
| Australia | 2008 | 2009 | 2010 | 2011 | 2012 |
| Real GDP Growth (%) | 1.6% | 2.1% | 2.4% | 3.3% | 2.8% |
| Real GDP Growth/Hours Worked (%) | 0.6% | 2.1% | –0.2% | 1.7% | 2.4% |
| Belgium | 2008 | 2009 | 2010 | 2011 | 2012 |
| Real GDP Growth (%) | 1 | –2.8 | 2.4 | 1.8 | –0.3 |
| Real GDP Growth/Hours Worked (%) | –1.2 | –1.5 | 1.6 | –1.1 | –0.3 |
Step 5. Consider the many factors can affect growth. For example, one factor that may have affected Australia is its isolation from Europe, which may have insulated the country from the effects of the global recession. In Belgium’s case, the global recession seems to have had an impact on both GDP and real GDP per hours worked between 2008 and 2012.
Video: What is Sustainable Development?
A simple introduction to sustainable development and the Sustainable Development Goals (SDGs).
The Power of Sustained Economic Growth
Nothing is more important for people’s standard of living than sustained economic growth. Even small changes in the rate of growth, when sustained and compounded over long periods of time, make an enormous difference in the standard of living. Consider Table 2, in which the rows of the table show several different rates of growth in GDP per capita and the columns show different periods of time. Assume for simplicity that an economy starts with a GDP per capita of 100. The table then applies the following formula to calculate what GDP will be at the given growth rate in the future:
GDP at starting date × (1 + growth rate of GDP) years = GDP at end date
For example, an economy that starts with a GDP of 100 and grows at 3% per year will reach a GDP of 209 after 25 years; that is, 100 (1.03)25 = 209.
The slowest rate of GDP per capita growth in the table, just 1% per year, is similar to what the United States experienced during its weakest years of productivity growth. The second highest rate, 3% per year, is close to what the U.S. economy experienced during the strong economy of the late 1990s and into the 2000s. Higher rates of per capita growth, such as 5% or 8% per year, represent the experience of rapid growth in economies like Japan, Korea, and China.
Table 3 shows that even a few percentage points of difference in economic growth rates will have a profound effect if sustained and compounded over time. For example, an economy growing at a 1% annual rate over 50 years will see its GDP per capita rise by a total of 64%, from 100 to 164 in this example. However, a country growing at a 5% annual rate will see (almost) the same amount of growth—from 100 to 163—over just 10 years. Rapid rates of economic growth can bring profound transformation. (See the following Clear It Up feature on the relationship between compound growth rates and compound interest rates.) If the rate of growth is 8%, young adults starting at age 20 will see the average standard of living in their country more than double by the time they reach age 30, and grow nearly sevenfold by the time they reach age 45.
| Growth Rate | Value of an original 100 in 10 Years | Value of an original 100 in 25 Years | Value of an original 100 in 50 Years |
| 1% | 110 | 128 | 164 |
| 3% | 134 | 209 | 438 |
| 5% | 163 | 338 | 1,147 |
| 8% | 216 | 685 | 4,690 |
Productivity
Productivity is the value of what is produced per worker, or per hour worked. Productivity can be measured as the level of GDP per worker or GDP per hour. The United States experienced a productivity slowdown between 1973 and 1989. Since then, U.S. productivity has rebounded (the current global recession notwithstanding). It is not clear whether the current growth in productivity will be sustained. The rate of productivity growth is the primary determinant of an economy’s rate of long-term economic growth and higher wages. Over decades and generations, seemingly small differences of a few percentage points in the annual rate of economic growth make an enormous difference in GDP per capita. An aggregate production function specifies how certain inputs in the economy, like human capital, physical capital, and technology, lead to the output measured as GDP per capita.
Compound interest and compound growth rates behave in the same way as productivity rates. Seemingly small changes in percentage points can have big impacts on income over time.
Video: Top 10 Highly Developed Countries
 Answer the self check questions below to monitor your understanding of the concepts in this section.
Self Check Questions
- Define the term developing country.
- Identify where in the world most of the developing countries are located.
- Give 10 examples of the types of problems that developing countries experience.
- What is the trade-off between developing countries and developed countries when it comes ot trade?
- Which parts of the world are considered developed nations?
- What are some of the most basic obstacles of development for Third World nations?
- Because population growth can be an obstacle to economic development, what can a country do to lower the birth rate and raise life expectancy?
- Explain how education and technology can help a nation move from a developing nation to a developed nation.
- Explain how religion can prevent economic development.
- How does corruption by a government prevent economic development?
- What is the International Monetary Fund? What does it do?
- Go online and look up the International Monetary Fund and research what the IMF is working on right now.
- What is the World Bank? What does it do?
- Go online and look up the World Bank. Research what the World Bank is working on right now.