
3.4: Employment Trends and Issues
- Page ID
- 6815
\( \newcommand{\vecs}[1]{\overset { \scriptstyle \rightharpoonup} {\mathbf{#1}} } \)
\( \newcommand{\vecd}[1]{\overset{-\!-\!\rightharpoonup}{\vphantom{a}\smash {#1}}} \)
\( \newcommand{\dsum}{\displaystyle\sum\limits} \)
\( \newcommand{\dint}{\displaystyle\int\limits} \)
\( \newcommand{\dlim}{\displaystyle\lim\limits} \)
\( \newcommand{\id}{\mathrm{id}}\) \( \newcommand{\Span}{\mathrm{span}}\)
( \newcommand{\kernel}{\mathrm{null}\,}\) \( \newcommand{\range}{\mathrm{range}\,}\)
\( \newcommand{\RealPart}{\mathrm{Re}}\) \( \newcommand{\ImaginaryPart}{\mathrm{Im}}\)
\( \newcommand{\Argument}{\mathrm{Arg}}\) \( \newcommand{\norm}[1]{\| #1 \|}\)
\( \newcommand{\inner}[2]{\langle #1, #2 \rangle}\)
\( \newcommand{\Span}{\mathrm{span}}\)
\( \newcommand{\id}{\mathrm{id}}\)
\( \newcommand{\Span}{\mathrm{span}}\)
\( \newcommand{\kernel}{\mathrm{null}\,}\)
\( \newcommand{\range}{\mathrm{range}\,}\)
\( \newcommand{\RealPart}{\mathrm{Re}}\)
\( \newcommand{\ImaginaryPart}{\mathrm{Im}}\)
\( \newcommand{\Argument}{\mathrm{Arg}}\)
\( \newcommand{\norm}[1]{\| #1 \|}\)
\( \newcommand{\inner}[2]{\langle #1, #2 \rangle}\)
\( \newcommand{\Span}{\mathrm{span}}\) \( \newcommand{\AA}{\unicode[.8,0]{x212B}}\)
\( \newcommand{\vectorA}[1]{\vec{#1}} % arrow\)
\( \newcommand{\vectorAt}[1]{\vec{\text{#1}}} % arrow\)
\( \newcommand{\vectorB}[1]{\overset { \scriptstyle \rightharpoonup} {\mathbf{#1}} } \)
\( \newcommand{\vectorC}[1]{\textbf{#1}} \)
\( \newcommand{\vectorD}[1]{\overrightarrow{#1}} \)
\( \newcommand{\vectorDt}[1]{\overrightarrow{\text{#1}}} \)
\( \newcommand{\vectE}[1]{\overset{-\!-\!\rightharpoonup}{\vphantom{a}\smash{\mathbf {#1}}}} \)
\( \newcommand{\vecs}[1]{\overset { \scriptstyle \rightharpoonup} {\mathbf{#1}} } \)
\(\newcommand{\longvect}{\overrightarrow}\)
\( \newcommand{\vecd}[1]{\overset{-\!-\!\rightharpoonup}{\vphantom{a}\smash {#1}}} \)
\(\newcommand{\avec}{\mathbf a}\) \(\newcommand{\bvec}{\mathbf b}\) \(\newcommand{\cvec}{\mathbf c}\) \(\newcommand{\dvec}{\mathbf d}\) \(\newcommand{\dtil}{\widetilde{\mathbf d}}\) \(\newcommand{\evec}{\mathbf e}\) \(\newcommand{\fvec}{\mathbf f}\) \(\newcommand{\nvec}{\mathbf n}\) \(\newcommand{\pvec}{\mathbf p}\) \(\newcommand{\qvec}{\mathbf q}\) \(\newcommand{\svec}{\mathbf s}\) \(\newcommand{\tvec}{\mathbf t}\) \(\newcommand{\uvec}{\mathbf u}\) \(\newcommand{\vvec}{\mathbf v}\) \(\newcommand{\wvec}{\mathbf w}\) \(\newcommand{\xvec}{\mathbf x}\) \(\newcommand{\yvec}{\mathbf y}\) \(\newcommand{\zvec}{\mathbf z}\) \(\newcommand{\rvec}{\mathbf r}\) \(\newcommand{\mvec}{\mathbf m}\) \(\newcommand{\zerovec}{\mathbf 0}\) \(\newcommand{\onevec}{\mathbf 1}\) \(\newcommand{\real}{\mathbb R}\) \(\newcommand{\twovec}[2]{\left[\begin{array}{r}#1 \\ #2 \end{array}\right]}\) \(\newcommand{\ctwovec}[2]{\left[\begin{array}{c}#1 \\ #2 \end{array}\right]}\) \(\newcommand{\threevec}[3]{\left[\begin{array}{r}#1 \\ #2 \\ #3 \end{array}\right]}\) \(\newcommand{\cthreevec}[3]{\left[\begin{array}{c}#1 \\ #2 \\ #3 \end{array}\right]}\) \(\newcommand{\fourvec}[4]{\left[\begin{array}{r}#1 \\ #2 \\ #3 \\ #4 \end{array}\right]}\) \(\newcommand{\cfourvec}[4]{\left[\begin{array}{c}#1 \\ #2 \\ #3 \\ #4 \end{array}\right]}\) \(\newcommand{\fivevec}[5]{\left[\begin{array}{r}#1 \\ #2 \\ #3 \\ #4 \\ #5 \\ \end{array}\right]}\) \(\newcommand{\cfivevec}[5]{\left[\begin{array}{c}#1 \\ #2 \\ #3 \\ #4 \\ #5 \\ \end{array}\right]}\) \(\newcommand{\mattwo}[4]{\left[\begin{array}{rr}#1 \amp #2 \\ #3 \amp #4 \\ \end{array}\right]}\) \(\newcommand{\laspan}[1]{\text{Span}\{#1\}}\) \(\newcommand{\bcal}{\cal B}\) \(\newcommand{\ccal}{\cal C}\) \(\newcommand{\scal}{\cal S}\) \(\newcommand{\wcal}{\cal W}\) \(\newcommand{\ecal}{\cal E}\) \(\newcommand{\coords}[2]{\left\{#1\right\}_{#2}}\) \(\newcommand{\gray}[1]{\color{gray}{#1}}\) \(\newcommand{\lgray}[1]{\color{lightgray}{#1}}\) \(\newcommand{\rank}{\operatorname{rank}}\) \(\newcommand{\row}{\text{Row}}\) \(\newcommand{\col}{\text{Col}}\) \(\renewcommand{\row}{\text{Row}}\) \(\newcommand{\nul}{\text{Nul}}\) \(\newcommand{\var}{\text{Var}}\) \(\newcommand{\corr}{\text{corr}}\) \(\newcommand{\len}[1]{\left|#1\right|}\) \(\newcommand{\bbar}{\overline{\bvec}}\) \(\newcommand{\bhat}{\widehat{\bvec}}\) \(\newcommand{\bperp}{\bvec^\perp}\) \(\newcommand{\xhat}{\widehat{\xvec}}\) \(\newcommand{\vhat}{\widehat{\vvec}}\) \(\newcommand{\uhat}{\widehat{\uvec}}\) \(\newcommand{\what}{\widehat{\wvec}}\) \(\newcommand{\Sighat}{\widehat{\Sigma}}\) \(\newcommand{\lt}{<}\) \(\newcommand{\gt}{>}\) \(\newcommand{\amp}{&}\) \(\definecolor{fillinmathshade}{gray}{0.9}\)Employment Trends and Issues
Historically, there has been a love-hate relationship with unions. Unions have made it possible for workers in the United States to have safe working conditions, better pay, shorter hours, and additional benefits. On the other hand, unions are sometimes perceived as troublemakers when they take action against their employers by going on strike or forcing employers to have a closed shop and only hiring those people in the union. In addition, the cost of American made union products may be higher than products made by other workers, which could, in fact, harm the overall sales of those union made goods
Universal Generalizations
- Issues surrounding employment, unions, pay, and discrimination change over time.
Guiding Questions
- How have unions become victims of their own success?
- Why has the federal government created legislation regarding wages and discrimination?
- Which economic issues do you believe are the most important for the government to deal with?
Labor-Leisure Choices
People do not obtain utility just from products they purchase. They also obtain utility from leisure time. Leisure time is time not spent at work. The decision-making process of a utility-maximizing household applies to what quantity of hours to work in much the same way that it applies to purchases of goods and services. Choices made along the labor-leisure budget constraint, as wages shift, provide the logical underpinning for the labor supply curve. This discussion also offers some insights about the range of possible reactions when people receive higher wages, and specifically about the claim that if people are paid higher wages, they will work a greater quantity of hours—assuming that they have a say in the matter.
According to the Bureau of Labor Statistics, U.S. workers averaged 38.5 hours per week on the job in 2013. This average includes part-time workers; for full-time workers only, the average was 42.5 hours per week. Table 1 shows that more than half of all workers are on the job 35 to 48 hours per week, but significant proportions work more or less than this amount.
Table 1 breaks down the average hourly compensation received by private industry workers, including wages and benefits. Wages and salaries are about three-quarters of total compensation received by workers; the rest is in the form of health insurance, vacation pay, and other benefits. The compensation workers receive differs for many reasons, including experience, education, skill, talent, membership in a labor union, and the presence of discrimination against certain groups in the labor market.
| Hours Worked per Week | Number of Workers | Percentage of Workforce |
| 1–14 hours | 6.9 million | 5.0% |
| 15–34 hours | 27.6 million | 20.1% |
| 35–40 hours | 68.5 million | 49.9% |
| 41–48 hours | 11.9 million | 8.6% |
| 49–59 hours | 13.3 million | 9.6% |
| 60 hours and over | 9.3 million | 6.8% |
Persons at Work, by Average Hours Worked per Week in 2013 (Total number of workers: 137.7 million)(Source: http://www.bls.gov/news.release/empsit.t18.htm)
| Compensation and Benefits | Hourly Amount |
| Wages and salaries | $21.50 |
| Vacation and holiday pay | $1.72 |
| Sick leave and other leave | $0.45 |
| Bonuses and premium pay | $0.73 |
| Employee insurance (mainly health) | $2.81 |
| Retirement plans | $1.47 |
| Employer payments to Social Security | $1.39 |
| Unemployment and worker's compensation insurance | $0.67 |
| Other benefits (Medicare) | $0.35 |
| Total compensation per hour | $31.09 |
Hourly Compensation: Wages, Benefits, and Taxes in 2013(Source: http://www.bls.gov/news.release/ecec.nr0.htm)
The Labor-Leisure Budget Constraint
How do workers make decisions about the number of hours to work? Again, let’s proceed with a concrete example. The economic logic is precisely the same as in the case of a consumption choice budget constraint, but the labels are different on a labor-leisure budget constraint.
Vivian has 70 hours per week that she could devote either to work or to leisure. Her wage is $10/hour. The lower budget constraint in Figure 1 shows Vivian’s possible choices. The horizontal axis of this diagram measures both leisure and labor by showing how Vivian’s time is divided between leisure and labor. Hours of leisure are measured from left to right on the horizontal axis, while hours of labor are measured from right to left. Vivian will compare choices along this budget constraint, ranging from 70 hours of leisure and no income at point S to zero hours of leisure and $700 of income at point L. She will choose the point that provides her with the highest total utility. For this example, let’s assume that Vivian’s utility-maximizing choice occurs at O, with 30 hours of leisure, 40 hours of work, and $400 in weekly income.
How a Rise in Wages Alters the Utility-Maximizing Choice
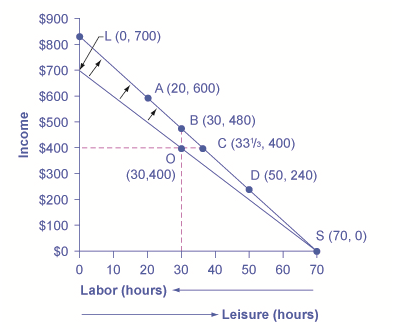
Vivian’s original choice is point O on the lower opportunity set. A rise in her wage causes her opportunity set to swing upward. In response to the increase in wages, Vivian can make a range of different choices available to her: a choice like D, which involves less work; and a choice like B, which involves the same amount of work but more income; or a choice like A, which involves more work and considerably more income. Vivian’s personal preferences will determine which choice she makes.
For Vivian to discover the labor-leisure choice that will maximize her utility, she does not have to place numerical values on the total and marginal utility that she would receive from every level of income and leisure. All that really matters is that Vivian can compare, in her own mind, whether she would prefer more leisure or more income, given the tradeoffs she faces. If Vivian can say to herself: “I’d really rather work a little less and have more leisure, even if it means less income,” or “I’d be willing to work more hours to make some extra income,” then as she gradually moves in the direction of her preferences, she will seek out the utility-maximizing choice on her labor-leisure budget constraint.
Now imagine that Vivian’s wage level increases to $12/hour. A higher wage will mean a new budget constraint that tilts up more steeply; conversely, a lower wage would have led to a new budget constraint that was flatter. How will a change in the wage and the corresponding shift in the budget constraint affect Vivian’s decisions about how many hours to work?
Vivian’s choices of quantity of hours to work and income along her new budget constraint can be divided into several categories, using the dashed horizontal and vertical lines in Figure 1 that go through her original choice (O). One set of choices in the upper-left portion of the new budget constraint involves more hours of work (that is, less leisure) and more income, at a point like A with 20 hours of leisure, 50 hours of work, and $600 of income (that is, 50 hours of work multiplied by the new wage of $12 per hour). A second choice would be to work exactly the same 40 hours, and to take the benefits of the higher wage in the form of income that would now be $480, at choice B. A third choice would involve more leisure and the same income at point C (that is, 33-1/3 hours of work multiplied by the new wage of $12 per hour equals $400 of total income). A fourth choice would involve less income and much more leisure at a point like D, with a choice like 50 hours of leisure, 20 hours of work, and $240 in income.
In effect, Vivian can choose whether to receive the benefits of her wage increase in the form of more income, or more leisure, or some mixture of these two. With this range of possibilities, it would be unwise to assume that Vivian (or anyone else) will necessarily react to a wage increase by working substantially more hours. Maybe they will; maybe they will not.
Applications of Utility Maximizing with the Labor-Leisure Budget Constraint
The theoretical insight that higher wages will sometimes cause an increase in hours worked, sometimes cause hours worked not to change by much, and sometimes cause hours worked to decline, has led to labor supply curves that look like the one in Figure 2. The bottom-left portion of the labor supply curve slopes upward, which reflects the situation of a person who reacts to a higher wage by supplying a greater quantity of labor. The middle, close-to-vertical portion of the labor supply curve reflects the situation of a person who reacts to a higher wage by supplying about the same quantity of labor. The very top portion of the labor supply curve is called a backward-bending supply curve for labor, which is the situation of high-wage people who can earn so much that they respond to a still-higher wage by working fewer hours. Read the following Clear It Up feature for more on the number of hours the average person works each year.
A Backward-Bending Supply Curve of Labor
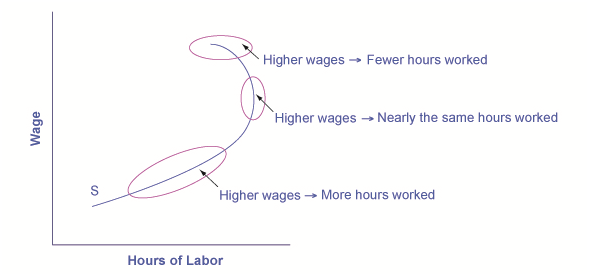
The bottom upward-sloping portion of the labor supply curve shows that as wages increase over this range, the quantity of hours worked also increases. The middle, nearly vertical portion of the labor supply curve shows that as wages increase over this range, the quantity of hours worked changes very little. The backward-bending portion of the labor supply curve at the top shows that as wages increase over this range, the quantity of hours worked actually decreases. All three of these possibilities can be derived from how a change in wages causes movement in the labor-leisure budget constraint, and thus different choices by individuals.
Is America a Nation of Workaholics?
Americans work a great deal. Table 2 shows average hours worked per year in the United States, Canada, Japan, and several European countries, with most of the data from 2008. To get a perspective on these numbers, someone who works 40 hours per week for 50 weeks per year, with two weeks off, would work 2,000 hours per year. The gap in hours worked is a little astonishing; the 250 to 300 hour gap between how much Americans work and how much Germans or the French work amounts to roughly six to seven weeks less of work per year. Economists who study these international patterns debate the extent to which average Americans and Japanese have a preference for working more than, say, Germans, or whether German workers and employers face particular kinds of taxes and regulations that lead to fewer hours worked. Many countries have laws that regulate the work week and dictate holidays and the standards of “normal” vacation time vary from country to country. It is also interesting to take the amount of time spent working in context; it is estimated that in the late nineteenth-century in the United States, the average work week was over 60 hours per week—leaving little to no time for leisure.
| Country | Average Annual Hours Actually Worked per Employed Person |
| United States | 1,824 |
| Spain | 1,799 |
| Japan | 1,759 |
| Canada | 1,751 |
| United Kingdom | 1,669 |
| Sweden | 1,585 |
| Germany | 1,443 |
| France | 1,441 |
Average Hours Worked Per Year in Select Countries(Source: stats.oecd.org/Index.aspx?DataSetCode=ANHRS)
The different responses to a rise in wages—more hours worked, the same hours worked, or fewer hours worked—are patterns exhibited by different groups of workers in the U.S. economy. Many full-time workers have jobs where the number of hours is held relatively fixed, partly by their own choice and partly by their employer’s practices. These workers do not much change their hours worked as wages rise or fall, so their supply curve of labor is inelastic. However, part-time workers and younger workers tend to be more flexible in their hours, and they are more ready to increase hours worked when wages are high or cut back when wages fall.
The backward-bending supply curve for labor, when workers react to higher wages by working fewer hours and having more income, is not observed often in the short run. However, some well-paid professionals, like dentists or accountants, may react to higher wages by choosing to limit the number of hours, perhaps by taking especially long vacations, or taking every other Friday off. Over a long-term perspective, the backward-bending supply curve for labor is common. Over the last century, Americans have reacted to gradually rising wages by working fewer hours; for example, the length of the average work-week has fallen from about 60 hours per week in 1900 to the present average of less than 40 hours per week.
Recognizing that workers have a range of possible reactions to a change in wages casts some fresh insight on a perennial political debate: the claim that a reduction in income taxes—which would, in effect, allow people to earn more per hour—will encourage people to work more. The leisure-income budget set points out that this connection will not hold true for all workers. Some people, especially part-timers, may react to higher wages by working more. Many will work the same number of hours. Some people, especially those whose incomes are already high, may react to the tax cut by working fewer hours. Of course, cutting taxes may be a good or a bad idea for a variety of reasons, not only because of its impact on work incentives, but also the specific claim that tax cuts will lead people to work more hours is only likely to hold for specific groups of workers and will depend on how and for whom taxes are cut.
When making a choice along the labor-leisure budget constraint, a household will choose the combination of labor, leisure, and income that provides the most utility. The result of a change in wage levels can be higher work hours, the same work hours, or lower work hours.
Making Choices
In what category did consumers worldwide increase their spending during the recession? Higher education. According to the United Nations Educational, Scientific, and Cultural Organization (UNESCO), enrollment in colleges and universities rose one-third in China and almost two-thirds in Saudi Arabia, nearly doubled in Pakistan, tripled in Uganda, and surged by three million—18 percent—in the United States. Why were consumers willing to spend on education during lean times? Both individuals and countries view higher education as the way to prosperity. Many feel that increased earnings are a significant benefit of attending college.
Bureau of Labor Statistics data from May 2012 supports this view, as shown in Figure 3. They show a positive correlation between earnings and education. The data also indicate that unemployment rates fall with higher levels of education and training.
The Impact of Education on Earnings and Unemployment Rates, 2012
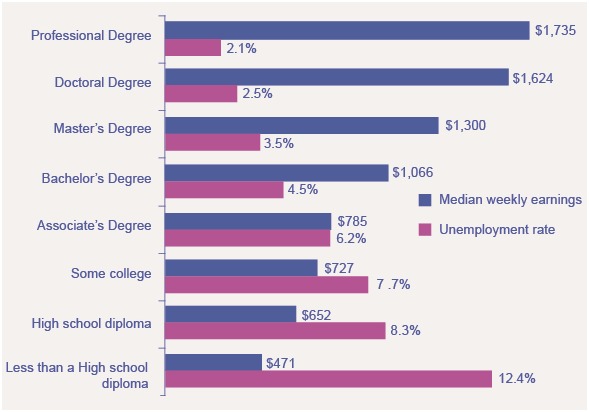
Those with the highest degrees in 2012 had substantially lower unemployment rates whereas those with the least formal education suffered from the highest unemployment rates. The national median average weekly income was $815, and the nation unemployment average in 2012 was 6.8%. (Source: Bureau of Labor Statistics, May 22, 2013)
For additional information on current trends in the labor market click on the following link:
Trends and Challenges for Work in the 21st Century
The Decline in U.S. Union Membership
The proportion of U.S. workers belonging to unions has declined dramatically since the early 1950s. Economists have offered a number of possible explanations:
- The shift from manufacturing to service industries
- The force of globalization and increased competition from foreign producers
- A reduced desire for unions because of the workplace protection laws now in place
- U.S. legal environment that makes it relatively more difficult for unions to organize workers and expand their membership
Let’s discuss each of these four explanations in more detail.
A first possible explanation for the decline in the share of U.S. workers belonging to unions involves the patterns of job growth in the manufacturing and service sectors of the economy shown in Figure 4. The U.S. economy had about 15 million manufacturing jobs in 1960. This total rose to 19 million by the late 1970s and then declined to 17 million in 2013. Meanwhile, the number of jobs in service industries and in government combined rose from 35 million in 1960 to over 118 million by 2013, according to the Bureau of Labor Statistics. Because over time unions were stronger in manufacturing than in service industries, the growth in jobs was not happening where the unions were. It is interesting to note that several of the biggest unions in the country are made up of government workers, including the American Federation of State, County and Municipal Employees (AFSCME); the Service Employees International Union; and the National Education Association. The membership of each of these unions is listed in Table 3. Outside of government employees, however, unions have not had great success in organizing the service sector.
The Growth of Service Jobs
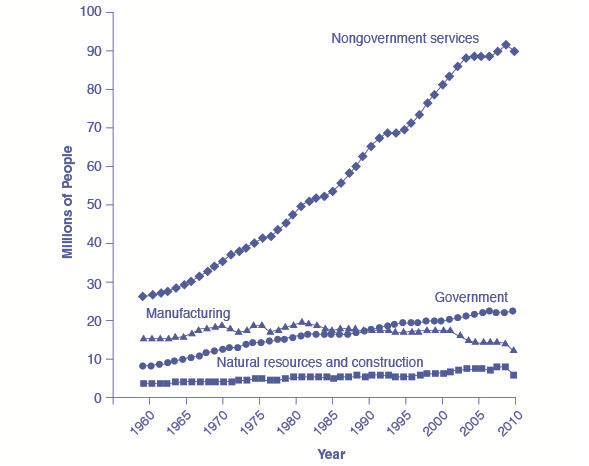
According to the U.S. Department of Labor's Bureau of Labor Statistics, jobs in services have increased dramatically in the last few decades. Jobs in government have increased modestly. Jobs in manufacturing have not changed much, although they have trended down in recent years.
A second explanation for the decline in the share of unionized workers looks at import competition. Starting in the 1960s, U.S. carmakers and steelmakers faced increasing competition from Japanese and European manufacturers. As sales of imported cars and steel rose, the number of jobs in U.S. auto manufacturing fell. This industry is heavily unionized. Not surprisingly, membership in the United Auto Workers, which was 975,000 in 1985, had fallen to roughly 390,000 by 2013. Import competition not only decreases the employment in sectors where unions were once strong, but also decreases the bargaining power of unions in those sectors. However, as we have seen, unions that organize public-sector workers, who are not threatened by import competition, have continued to see growth.
A third possible reason for the decline in the number of union workers is that citizens often call on their elected representatives to pass laws concerning work conditions, overtime, parental leave, regulation of pensions, and other issues. Unions offered strong political support for these laws aimed at protecting workers but, in an ironic twist, the passage of those laws then made many workers feel less need for unions.
These first three possible reasons for the decline of unions are all somewhat plausible, but they have a common problem. Most other developed economies have experienced similar economic and political trends, such as the shift from manufacturing to services, globalization, and increasing government social benefits and regulation of the workplace. Clearly there are cultural differences between countries as to their acceptance of unions in the workplace. The share of the population belonging to unions in other countries is very high compared with the share in the United States. Table 3 shows the proportion of workers in a number of the world’s high-income economies who belong to unions. The United States is near the bottom, along with France and Spain. The last column shows union coverage, defined as including those workers whose wages are determined by a union negotiation even if the workers do not officially belong to the union. In the United States, union membership is almost identical to union coverage. However, in many countries, the wages of many workers who do not officially belong to a union are still determined by collective bargaining between unions and firms.
| Country | Union Density: Percentage of Workers Belonging to a Union | Union Coverage: Percentage of Workers Whose Wages Are Determined by Union Bargaining |
| Austria | 37% | 99% |
| France | 9% | 95% |
| Germany | 26% | 63% |
| Japan | 22% | 23% |
| Netherlands | 25% | 82% |
| Spain | 11.3% | 81% |
| Sweden | 82% | 92% |
| United Kingdom | 29% | 35% |
| United States | 11.3% | 12.5% |
International Comparisons of Union Membership and Coverage in 2012(Source, CIA World Factbook, retrieved from www.cia.gov)
These international differences in union membership suggest a fourth reason for the decline of union membership in the United States: perhaps U.S. laws are less friendly to the formation of unions than such laws in other countries. The close connection between union membership and a friendly legal environment is apparent in the history of U.S. unions. The great rise in union membership in the 1930s followed the passage of the National Labor-Management Relations Act of 1935, which specified that workers had a right to organize unions and that management had to give them a fair chance to do so. The U.S. government strongly encouraged the formation of unions during the early 1940s in the belief that unions would help to coordinate the all-out production efforts needed during World War II. However, after World War II came the passage of the Taft-Hartley Act of 1947, which gave states the power to allow workers to opt out of the union in their workplace if they so desired. This law made the legal climate less encouraging to those seeking to form unions, and union membership levels soon started declining.
The procedures for forming a union differ substantially from country to country. For example, the procedures in the United States and those in Canada are strikingly different. When a group of workers wish to form a union in the United States, they announce this fact and an election date is set when the employees at a firm will vote in a secret ballot on whether to form a union. Supporters of the union lobby for a “yes” vote, and the management of the firm lobbies for a “no” vote—often even hiring outside consultants for assistance in swaying workers to vote “no.” In Canada, by contrast, a union is formed when a sufficient proportion of workers (usually about 60%) sign an official card saying that they want a union. There is no separate “election date.” The management of Canadian firms is limited by law in its ability to lobby against the union. In addition, though it is illegal to discriminate and fire workers based on their union activity in the United States, the penalties are slight, making this a not so costly way of deterring union activity. In short, forming unions is easier in Canada—and in many other countries—than in the United States.
In summary, union membership in the United States is lower than in many other high-income countries, a difference that may be due to different legal environments and cultural attitudes toward unions.
Employment Discrimination
Discrimination involves acting on the belief that members of a certain group are inferior solely because of a factor such as race, gender, or religion. There are many types of discrimination but the focus here will be on discrimination in labor markets, which arises if workers with the same skill levels—as measured by education, experience, and expertise—receive different pay or have different job opportunities because of their race or gender.
Earnings Gaps by Race and Gender
A possible signal of labor market discrimination is when one group is paid less than another. Figure 5 shows the average wage of black workers as a ratio of the average wage of white workers and the average wage of female workers as a ratio of the average wage of male workers. Research by the economists Francine Blau and Laurence Kahn shows that the gap between the earnings of women and men did not move much in the 1970s, but has declined since the 1980s. According to the U.S. Census, the gap between the earnings of blacks and whites diminished in the 1970s, but has not changed in 50 years. In both gender and race, an earnings gap remains.
Wage Ratios by Sex and Race
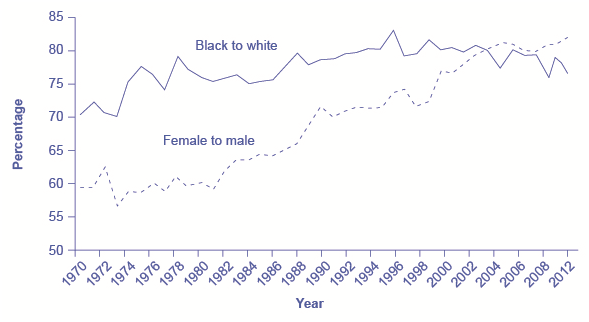
The U.S. Department of Labor, Bureau of Labor Statistics cites that the ratio of wages for black workers to white workers rose substantially in the late 1960s and through the 1970s, but has not changed much since then. The ratio of wages for female to male workers changed little through the 1970s, but has risen substantially since the 1980s. In both cases, a gap remains between the average wages of black and white workers and between the average wages of female and male workers.
An earnings gap between average wages, in and of itself, does not prove that discrimination is occurring in the labor market. We need to apply the same productivity characteristics to all parties (employees) involved. Gender discrimination in the labor market occurs when women are paid less than men despite having comparable levels of education, experience, and expertise. (Read the Clear It Up about the sex-discrimination suit brought against Wal-Mart.) Similarly, racial discrimination in the labor market exists when racially diverse employees are paid less than their coworkers of the majority race despite having comparable levels of education, experience, and expertise. To bring a successful gender discrimination lawsuit, a female employee must prove that she is paid less than a male employee who holds a similar job, with similar educational attainment, and with similar expertise. Likewise, someone who wants to sue on the grounds of racial discrimination must prove that he or she is paid less than an employee of another race who holds a similar job, with similar educational attainment, and with similar expertise.
In one of the largest class-action sex-discrimination cases in U.S. history, 1.2 million female employees of Wal-Mart claimed that the company engaged in wage and promotion discrimination. In 2011, the Supreme Court threw out the case on the grounds that the group was too large and too diverse for the case to be considered a class action suit. Lawyers for the women regrouped and are now suing in smaller groups. Part of the difficulty for the female employees is that the court said that pay and promotion decisions were made by local managers and were not necessarily policies of the company as a whole. Consequently, female Wal-Mart employees in Texas are arguing that their new suit will challenge the management of a “discrete group of regional district and store managers.” They claim these managers made biased pay and promotion decisions. However, in 2013, a smaller California class action suit against the company was again rejected by a federal district court.
On other issues, Wal-Mart made the news again in 2013 when the National Labor Relations Board found Wal-Mart guilty of illegally penalizing and firing workers who took part in labor protests and strikes. Wal-Mart has already paid $11.7 million in back wages and compensatory damages to women in Kentucky who were denied jobs due to their sex.
To read more about Wal-Mart's continuing struggle with labor practices, follow this link: The Fight Against Walmart’s Labor Practices Goes Global.
Investigating the Female/Male Earnings Gap
As a result of changes in law and culture, women began to enter the paid workforce in substantial numbers in the mid- to late-twentieth century. By 2013, 58.6% of adult women held jobs while 71.2% of adult men did. Moreover, along with entering the workforce, women began to ratchet up their education levels. In 1971, 44% of undergraduate college degrees went to women; by 2013, women received 56% of bachelor’s degrees. In 1970, women received 5.4% of the degrees from law schools and 8.4% of the degrees from medical schools. By 2013, women were receiving 47.2% of the law degrees and 48.3% of the medical degrees. These gains in education and experience have reduced the female/male wage gap over time. However, concerns remain about the extent to which women have not yet assumed a substantial share of the positions at the top of the largest companies or in the U.S. Congress.
There are factors that can lower women’s average wages. Women are likely to bear a disproportionately large share of household responsibilities. A mother of young children is more likely to drop out of the labor force for several years or work on a reduced schedule than is the father. As a result, women in their 30s and 40s are likely, on average, to have less job experience than men. In the United States, childless women with the same education and experience levels as men are typically paid comparably. However, women with families and children are typically paid about 7% to 14% less than other women of similar education and work experience. Meanwhile, married men earn about 10% to 15% more than single men with comparable education and work experience.
The different patterns of family responsibilities possibly could be called discrimination, but it is primarily rooted in America’s social patterns of discrimination, which involve the roles that fathers and mothers play in child-rearing, rather than discrimination by employers in hiring and salary decisions.
Visit this website to read more about the persistently low numbers of women in executive roles in business and in the U.S. Congress: Changing Workplaces Changing Lives.
Investigating the Black/White Earnings Gap
Blacks experienced blatant labor market discrimination during much of the twentieth century. Until the passage of the Civil Rights Act of 1964, it was legal in many states to refuse to hire a black worker, regardless of the credentials or experience of that worker. Moreover, blacks were often denied access to educational opportunities, which in turn meant that they had lower levels of qualifications for many jobs. At least one economic study has shown that the 1964 law is partially responsible for the narrowing of the gap in black–white earnings in the late 1960s and into the 1970s; for example, the ratio of total earnings of black male workers to white male workers rose from 62% in 1964 to 75.3% in 2013, according to the Bureau of Labor Statistics.
However, the earnings gap between black and white workers has not changed as much as the earnings gap between men and women has in the last half century. The remaining racial gap seems related both to continuing differences in education levels and to the presence of discrimination. Table 4 shows that the percentage of blacks who complete a four-year college degree remains substantially lower than the percentage of whites who complete college. According to the U.S. Census, both whites and blacks have higher levels of educational attainment than Hispanics and lower levels than Asians. The lower average levels of education for black workers surely explain part of the earnings gap. In fact, black women who have the same levels of education and experience as white women receive, on average, about the same level of pay. One study shows that white and black college graduates have identical salaries immediately after college; however, the racial wage gap widens over time, an outcome that suggests the possibility of continuing discrimination. Another study conducted a field experiment by responding to job advertisements with fictitious resumes with either very African American sounding names or very white sounding names and found out that white names received 50 percent more callbacks for interviews. This is suggestive of discrimination in job opportunities. Further, as the following Clear It Up feature explains, there is evidence to support that discrimination in the housing market is connected to employment discrimination.
| White | Hispanic | Black | Asian | |
| Completed four years of high school or more | 87.6% | 62.9% | 84.2% | 88.9% |
| Completed four years of college or more | 30.3% | 13.9% | 19.8% | 52.4% |
In a recent study by the Housing and Urban Development (HUD) department, black homebuyers who ask to look at homes for sale are shown 18 percent fewer homes compared to white homebuyers. Asians are shown 19 percent fewer properties. Additionally, Hispanics experience more discrimination in renting apartments and undergo stiffer credit checks than white renters. In a 2012 study conducted by the U.S. Department of Housing and Urban Development and the nonprofit Urban Institute, Hispanic testers who contacted agents about advertised rental units were given information about 12 percent fewer units available and were shown seven percent fewer units than white renters. The $9 million study, based on research in 28 metropolitan areas, concluded that blatant “door slamming” forms of discrimination are on the decline but that the discrimination that does exist is harder to detect, and as a result, more difficult to remedy. According to the Chicago Tribune, HUD Secretary Shaun Donovan told reporters, “Just because it’s taken on a hidden form doesn’t make it any less harmful. You might not be able to move into that community with the good schools.”
The lower levels of education for black workers can also be a result of discrimination—although it may be pre-labor market discrimination, rather than direct discrimination by employers in the labor market. For example, if discrimination in housing markets causes black families to live clustered together in certain poorer neighborhoods, then the black children will continue to have lower educational attainment then their white counterparts and, consequently, not be able to obtain the higher paying jobs that require higher levels of education. Another element to consider is that in the past, when blacks were effectively barred from many high-paying jobs, getting the additional education could have seemed somewhat pointless because the educational degrees would not pay off. Even though labor market discrimination has been legally abolished, it can take some time to establish a culture and a tradition of valuing education highly. Additionally, a legacy of past discrimination may contribute to an attitude that blacks will have a difficult time succeeding in academic subjects. In any case, the impact of social discrimination in labor markets is more complicated than seeking to punish a few bigoted employers.
Competitive Markets and Discrimination
Gary Becker (b. 1930), who won the Nobel Prize in economics in 1992, was one of the first to analyze discrimination in economic terms. Becker pointed out that while competitive markets can allow some employers to practice discrimination, it can also provide profit-seeking firms with incentives not to discriminate. Given these incentives, Becker explored the question of why discrimination persists.
If a business is located in an area with a large minority population and refuses to sell to minorities, it will cut into its own profits. If some businesses run by bigoted employers refuse to pay women and/or minorities a wage based on their productivity, then other profit-seeking employers can hire these workers. In a competitive market, if the owners of a business care more about the color of money than about the color of skin, they will have an incentive to make buying, selling, hiring, and promotion decisions strictly based on economic factors.
The power of markets to offer at least a degree of freedom to oppressed groups should not be underestimated. In many countries, cohesive minority groups like Jews and emigrant Chinese have managed to carve out space for themselves through their economic activities despite legal and social discrimination against them. Many immigrants, including those who come to the United States, have taken advantage of economic freedom to make new lives for themselves. However, history teaches that market forces alone are unlikely to eliminate discrimination. After all, discrimination against African Americans persisted in the market-oriented U.S. economy during the century between President Abraham Lincoln’s Emancipation Proclamation, which freed the slaves in 1863, and the passage of the Civil Rights Act of 1964—and has continued since then.
So why does discrimination persist in competitive markets? Gary Becker sought to explain this persistence. Discriminatory impulses can emerge at a number of levels: among managers, among workers, and among customers. Consider the situation of a manager who is not personally prejudiced, but who has many workers or customers who are prejudiced. If that manager treats minority groups or women fairly, the manager may find it hurts the morale of prejudiced co-workers or drives away prejudiced customers. In such a situation, a policy of non-discrimination could reduce the firm’s profits. After all, a business firm is part of society, and a firm that does not follow the societal norms is likely to suffer. Market forces alone are unlikely to overwhelm strong social attitudes about discrimination.
Public Policies to Reduce Discrimination
A first public policy step against discrimination in the labor market is to make it illegal. For example, the Equal Pay Act of 1963 said that men and women who do equal work at a company must be paid the same. The Civil Rights Act of 1964 prohibits employment discrimination based on race, color, religion, sex, or national origin. The Age Discrimination in Employment Act of 1967 prohibited discrimination on the basis of age against individuals who are 40 years of age or older. The Civil Rights Act of 1991 provides monetary damages in cases of intentional employment discrimination. The Pregnancy Discrimination Act of 1978 was aimed at prohibiting discrimination against women in the workplace who are planning to get pregnant, are pregnant, or are returning after pregnancy. Passing a law, however, is only part of the answer, since discrimination by prejudiced employers may be less important than broader social patterns.
These laws against discrimination have reduced the gender wage gap. A study by the Department of Labor in 2007 compared salaries of men and women who have a similar educational achievement, work experience, and occupation and found that the gender wage gap is only 5%.
In the case of the earnings gap between blacks and whites (and also between Hispanics and whites), probably the single largest step that could be taken at this point in U.S. history to close the earnings gap would be to reduce the gap in educational achievement. Part of the answer to this issue involves finding ways to improve the performance of schools, which is a highly controversial topic in itself. In addition, the education gap is unlikely to close unless black and Hispanic families and peer groups strengthen their culture of support for educational achievement.
Affirmative action is the name given to active efforts by government or businesses that give special rights to minorities in hiring and promotion to make up for past discrimination. Affirmative action, in its limited and not especially controversial form, means making an effort to reach out to a broader range of minority candidates for jobs. In its more aggressive and controversial form, affirmative action required government and companies to hire a specific number or percentage of minority employees. However, the U.S. Supreme Court has ruled against state affirmative action laws. Today, affirmative action policies are applied only to federal contractors who have lost a discrimination lawsuit. This type of redress is enforced by the federal Equal Employment Opportunity Commission (EEOC).
An Increasingly Diverse Workforce
Racial and ethnic diversity is on the rise in the U.S. population and work force. As Figure 6 shows, while the white Americans composed 78% of the population in 2012, the U.S. Bureau of the Census projects that whites will be 69% of the U.S. population by 2060. The proportion of U.S. citizens who are of Hispanic background is predicted to rise substantially. Moreover, in addition to expected changes in the population, diversity is being increased in the workforce as the women who entered the workforce in the 1970s and 1980s are now moving up the promotion ladders within their organizations.
Projected Changes in America’s Racial and Ethnic Diversity
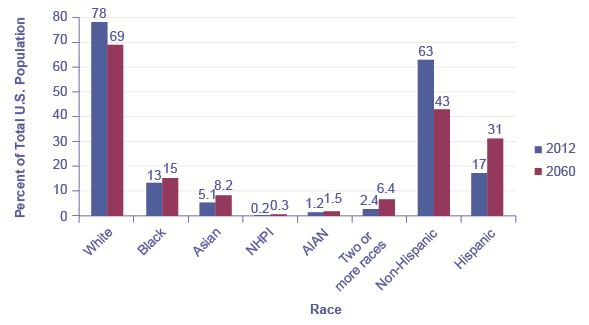
This figure shows projected changes in the ethnic makeup of the U.S. population by 2060. Note that “NHPI” stands for Native Hawaiian and Other Pacific Islander. “AIAN” stands for American Indian and Alaska Native. Source: US Department of Commerce
Fortune-telling is not economics, but it still can be clarifying to speculate about the future. Optimists argue that the growing proportions of minority workers will knock over remaining discriminatory barriers. The economy will benefit as an increasing proportion of workers from traditionally disadvantaged groups have a greater opportunity to fulfill their potential. Pessimists worry that the social tensions between men and women and between ethnic groups will rise and that workers will be less productive as a result. Anti-discrimination policy, at its best, seeks to help society move toward the more optimistic outcome.
Visit this website to read more about wage discrimination: US Census Bureau Income Poverty Health.
Visit this website to obtain more context regarding immigration: Is the New Immigration Really So Bad?
Video: Labor Markets and Minimum Wage
 Answer the self check questions below to monitor your understanding of the concepts in this section.
Self Check Questions
- What are some of the reasons for declining union membership?
- Explain why women make less money than men in the same industry. Give 3 reasons for the low wages.
- There is a debate over minimum wage. Explain your position: are you an opponent of raising the minimum wage or are you a supporter of raising the minimum wage. Defend your answer.
- There is a debate about hiring illegal workers. Some people believe it is okay to hire them, steal their wages, or pay them less than minimum wage; others believe that this is not only illegal but also unfair. Take a position on this topic and defend your answer.
| Image | Reference | Attributions |
|
[Figure 1] | Credit: opentextbc.ca Source: opentextbc.ca/principlesofeconomics/chapter/6-3-labor-leisure-choices/ License: CC BY-NC 3.0 |
|
[Figure 2] | Credit: opentextbc.ca Source: opentextbc.ca/principlesofeconomics/chapter/6-3-labor-leisure-choices/ License: CC BY-NC 3.0 |