
3.14: GDP and Population
- Page ID
- 6807
\( \newcommand{\vecs}[1]{\overset { \scriptstyle \rightharpoonup} {\mathbf{#1}} } \)
\( \newcommand{\vecd}[1]{\overset{-\!-\!\rightharpoonup}{\vphantom{a}\smash {#1}}} \)
\( \newcommand{\dsum}{\displaystyle\sum\limits} \)
\( \newcommand{\dint}{\displaystyle\int\limits} \)
\( \newcommand{\dlim}{\displaystyle\lim\limits} \)
\( \newcommand{\id}{\mathrm{id}}\) \( \newcommand{\Span}{\mathrm{span}}\)
( \newcommand{\kernel}{\mathrm{null}\,}\) \( \newcommand{\range}{\mathrm{range}\,}\)
\( \newcommand{\RealPart}{\mathrm{Re}}\) \( \newcommand{\ImaginaryPart}{\mathrm{Im}}\)
\( \newcommand{\Argument}{\mathrm{Arg}}\) \( \newcommand{\norm}[1]{\| #1 \|}\)
\( \newcommand{\inner}[2]{\langle #1, #2 \rangle}\)
\( \newcommand{\Span}{\mathrm{span}}\)
\( \newcommand{\id}{\mathrm{id}}\)
\( \newcommand{\Span}{\mathrm{span}}\)
\( \newcommand{\kernel}{\mathrm{null}\,}\)
\( \newcommand{\range}{\mathrm{range}\,}\)
\( \newcommand{\RealPart}{\mathrm{Re}}\)
\( \newcommand{\ImaginaryPart}{\mathrm{Im}}\)
\( \newcommand{\Argument}{\mathrm{Arg}}\)
\( \newcommand{\norm}[1]{\| #1 \|}\)
\( \newcommand{\inner}[2]{\langle #1, #2 \rangle}\)
\( \newcommand{\Span}{\mathrm{span}}\) \( \newcommand{\AA}{\unicode[.8,0]{x212B}}\)
\( \newcommand{\vectorA}[1]{\vec{#1}} % arrow\)
\( \newcommand{\vectorAt}[1]{\vec{\text{#1}}} % arrow\)
\( \newcommand{\vectorB}[1]{\overset { \scriptstyle \rightharpoonup} {\mathbf{#1}} } \)
\( \newcommand{\vectorC}[1]{\textbf{#1}} \)
\( \newcommand{\vectorD}[1]{\overrightarrow{#1}} \)
\( \newcommand{\vectorDt}[1]{\overrightarrow{\text{#1}}} \)
\( \newcommand{\vectE}[1]{\overset{-\!-\!\rightharpoonup}{\vphantom{a}\smash{\mathbf {#1}}}} \)
\( \newcommand{\vecs}[1]{\overset { \scriptstyle \rightharpoonup} {\mathbf{#1}} } \)
\(\newcommand{\longvect}{\overrightarrow}\)
\( \newcommand{\vecd}[1]{\overset{-\!-\!\rightharpoonup}{\vphantom{a}\smash {#1}}} \)
\(\newcommand{\avec}{\mathbf a}\) \(\newcommand{\bvec}{\mathbf b}\) \(\newcommand{\cvec}{\mathbf c}\) \(\newcommand{\dvec}{\mathbf d}\) \(\newcommand{\dtil}{\widetilde{\mathbf d}}\) \(\newcommand{\evec}{\mathbf e}\) \(\newcommand{\fvec}{\mathbf f}\) \(\newcommand{\nvec}{\mathbf n}\) \(\newcommand{\pvec}{\mathbf p}\) \(\newcommand{\qvec}{\mathbf q}\) \(\newcommand{\svec}{\mathbf s}\) \(\newcommand{\tvec}{\mathbf t}\) \(\newcommand{\uvec}{\mathbf u}\) \(\newcommand{\vvec}{\mathbf v}\) \(\newcommand{\wvec}{\mathbf w}\) \(\newcommand{\xvec}{\mathbf x}\) \(\newcommand{\yvec}{\mathbf y}\) \(\newcommand{\zvec}{\mathbf z}\) \(\newcommand{\rvec}{\mathbf r}\) \(\newcommand{\mvec}{\mathbf m}\) \(\newcommand{\zerovec}{\mathbf 0}\) \(\newcommand{\onevec}{\mathbf 1}\) \(\newcommand{\real}{\mathbb R}\) \(\newcommand{\twovec}[2]{\left[\begin{array}{r}#1 \\ #2 \end{array}\right]}\) \(\newcommand{\ctwovec}[2]{\left[\begin{array}{c}#1 \\ #2 \end{array}\right]}\) \(\newcommand{\threevec}[3]{\left[\begin{array}{r}#1 \\ #2 \\ #3 \end{array}\right]}\) \(\newcommand{\cthreevec}[3]{\left[\begin{array}{c}#1 \\ #2 \\ #3 \end{array}\right]}\) \(\newcommand{\fourvec}[4]{\left[\begin{array}{r}#1 \\ #2 \\ #3 \\ #4 \end{array}\right]}\) \(\newcommand{\cfourvec}[4]{\left[\begin{array}{c}#1 \\ #2 \\ #3 \\ #4 \end{array}\right]}\) \(\newcommand{\fivevec}[5]{\left[\begin{array}{r}#1 \\ #2 \\ #3 \\ #4 \\ #5 \\ \end{array}\right]}\) \(\newcommand{\cfivevec}[5]{\left[\begin{array}{c}#1 \\ #2 \\ #3 \\ #4 \\ #5 \\ \end{array}\right]}\) \(\newcommand{\mattwo}[4]{\left[\begin{array}{rr}#1 \amp #2 \\ #3 \amp #4 \\ \end{array}\right]}\) \(\newcommand{\laspan}[1]{\text{Span}\{#1\}}\) \(\newcommand{\bcal}{\cal B}\) \(\newcommand{\ccal}{\cal C}\) \(\newcommand{\scal}{\cal S}\) \(\newcommand{\wcal}{\cal W}\) \(\newcommand{\ecal}{\cal E}\) \(\newcommand{\coords}[2]{\left\{#1\right\}_{#2}}\) \(\newcommand{\gray}[1]{\color{gray}{#1}}\) \(\newcommand{\lgray}[1]{\color{lightgray}{#1}}\) \(\newcommand{\rank}{\operatorname{rank}}\) \(\newcommand{\row}{\text{Row}}\) \(\newcommand{\col}{\text{Col}}\) \(\renewcommand{\row}{\text{Row}}\) \(\newcommand{\nul}{\text{Nul}}\) \(\newcommand{\var}{\text{Var}}\) \(\newcommand{\corr}{\text{corr}}\) \(\newcommand{\len}[1]{\left|#1\right|}\) \(\newcommand{\bbar}{\overline{\bvec}}\) \(\newcommand{\bhat}{\widehat{\bvec}}\) \(\newcommand{\bperp}{\bvec^\perp}\) \(\newcommand{\xhat}{\widehat{\xvec}}\) \(\newcommand{\vhat}{\widehat{\vvec}}\) \(\newcommand{\uhat}{\widehat{\uvec}}\) \(\newcommand{\what}{\widehat{\wvec}}\) \(\newcommand{\Sighat}{\widehat{\Sigma}}\) \(\newcommand{\lt}{<}\) \(\newcommand{\gt}{>}\) \(\newcommand{\amp}{&}\) \(\definecolor{fillinmathshade}{gray}{0.9}\)GDP & Population
In addition to measuring the nation's output, the macroeconomic topic of economic performance also examines inflation, changes in population, the standard of living, factors that influence growth such as labor and capital, and business cycles. The evaluation of economic performance shows that when productivity falters the economy suffers and when productivity grows the economy benefits. Therefore, without productivity, the economic growth of a nation is difficult to achieve, and we may not realize that changes need to be made unless the economic performance of the country is measured.
Universal Generalizations
- Projected population trends can help determine the direction of economic development.
- Labor is closely tied to population and location of industrial centers.
- Changes in population can distort GDP and GNP.
- Population growth can affect the quality of life of a country.
Guiding Questions
- What are the three most important factors that determine future population growth?
- How has the projection of race and ethnicity changed over the last fifty years?
- What is the projected situation regarding age in the U.S. for the next twenty years?
- How do demographics affect economic growth?
Video: India's Booming Population
Population Growth and Economic Growth
The rate at which population grows influences the economy, especially GDP and economic growth. As the economy grows, the factors of production (land, labor, capital, entrepreneur) must also grow or become more productive to provide for consumers. Of the factors, the most important at this point is labor. The labor market can influence economic growth. Gross Domestic Product (GDP) calculations can be distorted, this is why economists look at per capita, or per person, output. If per capita income grows, the economy is considered to be in a cycle of growth. The opposite is equally true, if the per capita income declines, then the economy may be in a cycle of recession. Economists consider population numbers when determining if a country's economy is moving into a higher standard of living. Generally countries with fewer people tend to live better, or at a higher standard than if the country is overpopulated.
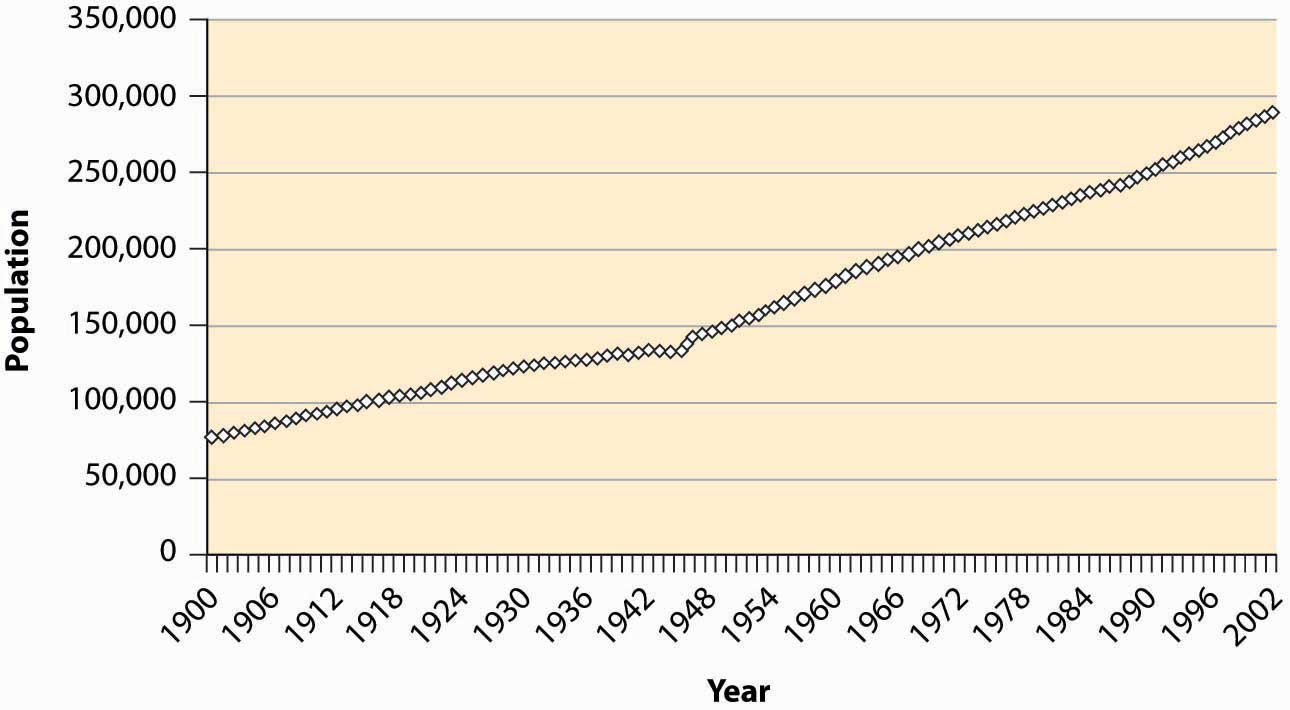
There are about 300 million people in the United States, up from 76 million in 1900. So how do we know how many people live in the United States? In 1902 the Census Bureau was set up to calculate where the U.S. population was living and how the Congress would need to be "re-apportioned" based on where people were living or moving to. Today the U.S. Census Bureau works year-round to conduct surveys related to the size and characteristics of the current population.
Figure 1: U.S. Resident Population
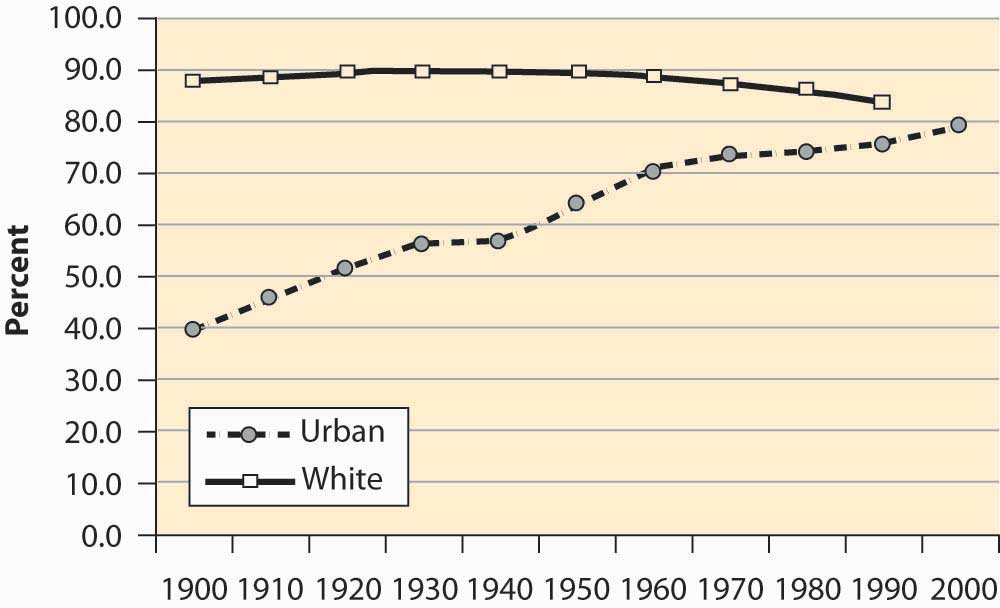
During the last century, the U.S. population has become primarily an urban population, growing from 40% to 80% urban. The population is primarily white, with 12%–13% African American and 4% classified as other. These proportions are relatively stable over the century, with the white population falling from 89% to 83%. The census is thought to understate minority populations because of greater difficulties in contacting minorities. The census does not attempt to classify people but instead accepts people’s descriptions of their own race.
Historically, the U.S. population has grown significantly since colonial times. However, there have been periods of steady decline: the Civil War, the Great Depression and prior to World War II. There was a population "boom" from 1945-1967 followed by another period of population decline. The trend reflects that people in the U.S. are having smaller families. Why now? The country's population has moved from rural areas or living in the country-side where large families were needed to work the land, to urban areas where the cost of living was more expensive. In addition, improvements in healthcare and life expectancy have made it possible for children to survive and the population to live longer. Another factor to consider is the widespread use of birth control, as well as the increased cost of raising a child.
Figure 2: Urban and White Populations
The U.S. population has been aging significantly with the proportion of seniors (over 65 years of age) tripling over the past century, and the proportion of young people dropping by over one-third. Indeed, the proportion of children between 0 and 5 years old has dropped from 12.1% of the population to under 7%.
Figure 3: Population by Age
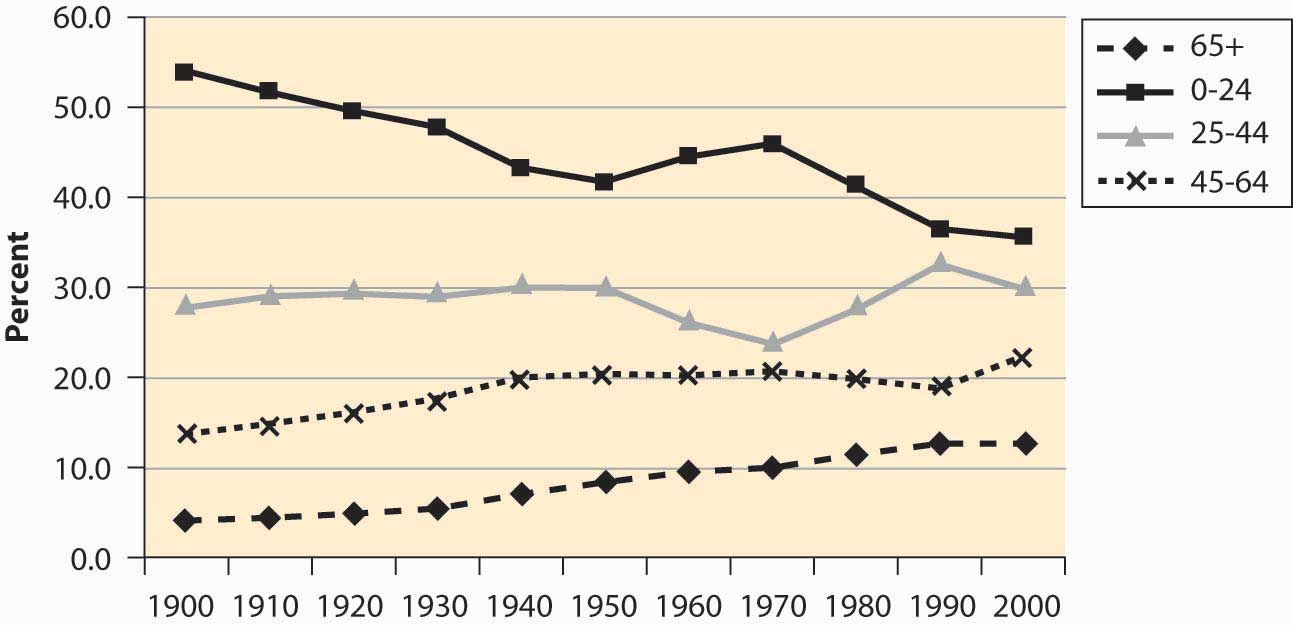
Population trends are important because they help to determine possible population shifts in age, or where people may be moving, as well as whether or not a community may need additional services such as education, crime prevention, or housing. In addition, businesses examine population shifts to make decisions about where to build new factories, add stores, or hire more employees.
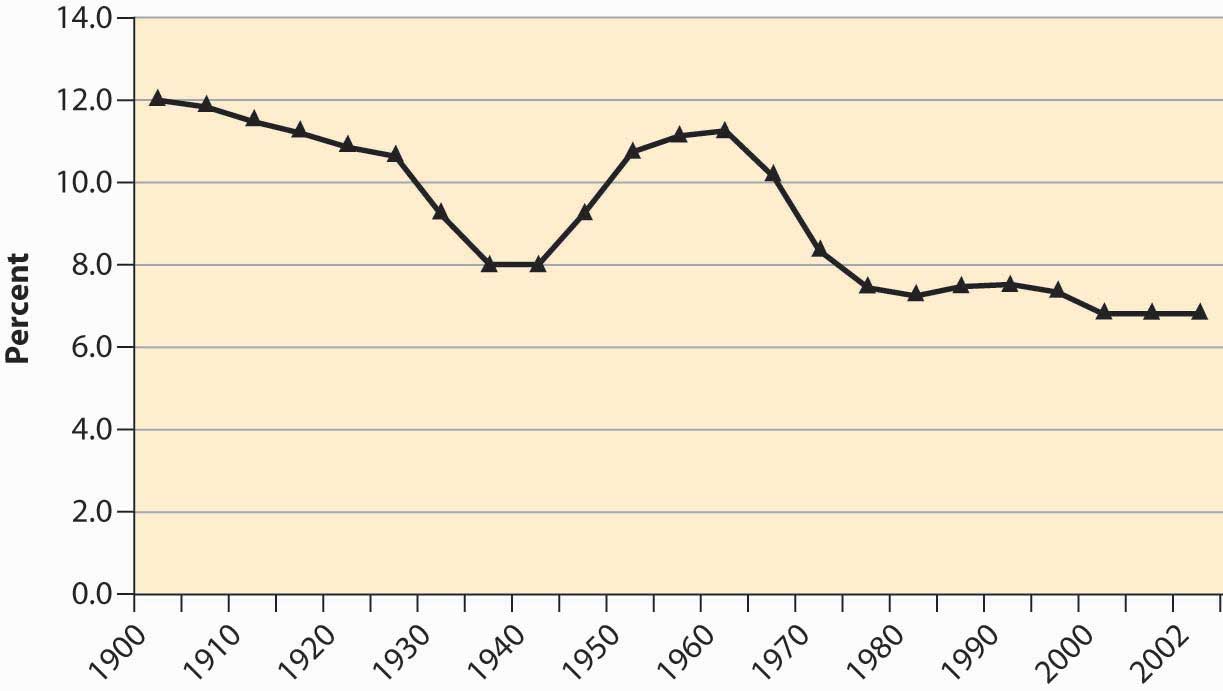
The baby boom—a dramatic increase in births for the years 1946–1964—is visible in Figure 3 as the population in the 0–24 age group begins increasing in 1950, peaking in 1970, and then declining significantly as the baby boom moves into the 25- to 44-year-old bracket. There is a slight “echo” of the baby boom, most readily seen by looking at the 0–5 age bracket, as in Figure 4.
Figure 4: Population Under Age 5
The aging of the American population is a consequence of greater life expectancy. When social security was created in 1935, the average American male lived to be slightly less than 60 years old. The social security benefits didn’t start until age 65, thus they were not being paid to a substantial portion of the population.
Video: Life Expectancy Shocker for High School Dropouts
Figure 5: US Life Expectancy at Birth
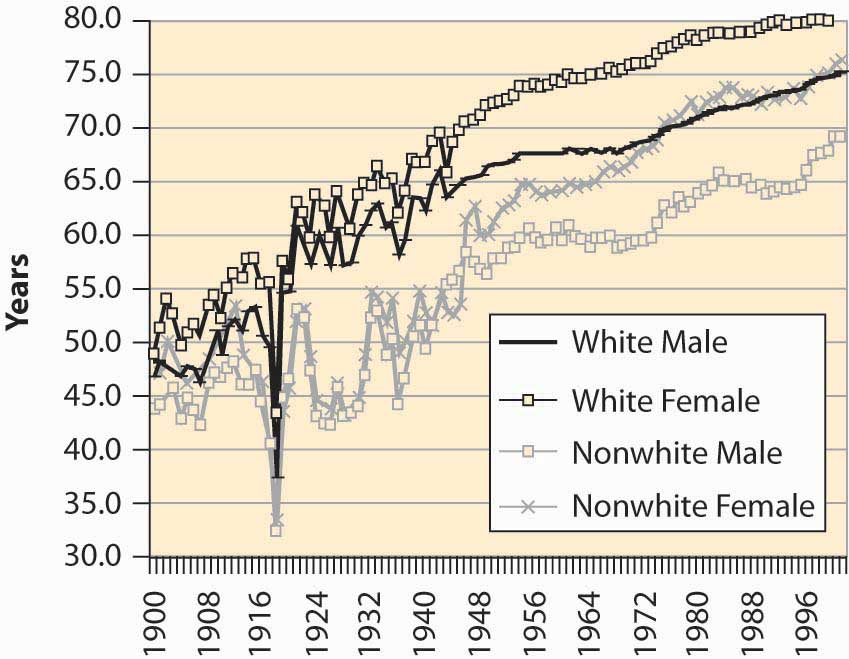
Figure 5 shows life expectancy at birth, so it also includes infant mortality. The significant drop in life expectancy in 1918—to nearly 30 years old for nonwhites—is primarily a consequence of the great influenza, which killed about 2.5% of the people who contracted it. This flu killed more Americans in 1918 than World War I. The Great Depression (1929–1939) also reduced life expectancy. The steady increase in life expectancy is also visible with white females now living 80 years on average.
The three main factors that demographers (people who study population growth and its characteristics) are: fertility rates, life expectancy, and net immigration levels. Fertility rates are the number of live births per 1,000 women of child-bearing years, are expected to have over their lifetime. In 2014, the fertility rate for women in the U.S. was 2, putting this country at 114th out of 228 nations. The country with the highest fertility rate was Niger at 7, while the lowest was Singapore at 0.8.
To see a world-wide break-down of fertility rates by country/years go to World Fertility Rates by Country.
Life expectancy is the average lifespan of people in a given area, country, or nation. Depending on how well the people live in a country can influence their life expectancy. Proper nutrition, health care, clean water to drink, sanitation, exercise, accidents, epidemics, plagues, wars, and childbirth, can affect a country's life expectancy rate. The current life expectancy rate for the U.S. is 79 years old, placing the U.S. at 53 out of 228 nations. The country with the highest life expectancy rate is Monaco at 89.57 years, while the country with the lowest life expectancy is Chad at 49.44 years old.
To see the list of the nations ranked based on life expectancy go to Life Expectancy by Country.
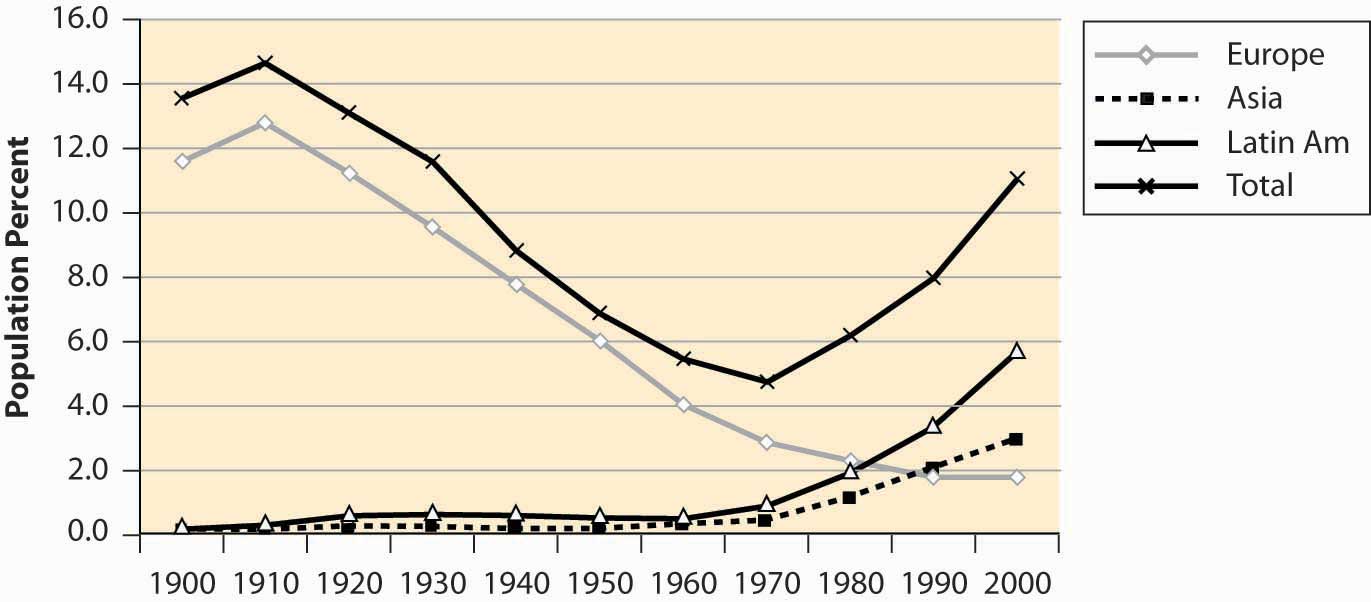
Figure 6: U.S. Immigrant Population (Percentages) by Continent of Origin
Another way that population can be analyzed is immigration. Net immigration is the net change of the population caused by people moving into a country and out of a country.
It is said that the United States is a country of immigrants, and a large fraction of the population had ancestors who came from elsewhere. Immigration into this United States, however, has been increasing after a long decline, and the fraction of the population that was born in foreign countries is about 11%—one in nine.
To see the most current listing of global net migration rates visit World Bank: Net Migration Data.
Figure 7: National Origin of Immigrants, 1900–2000
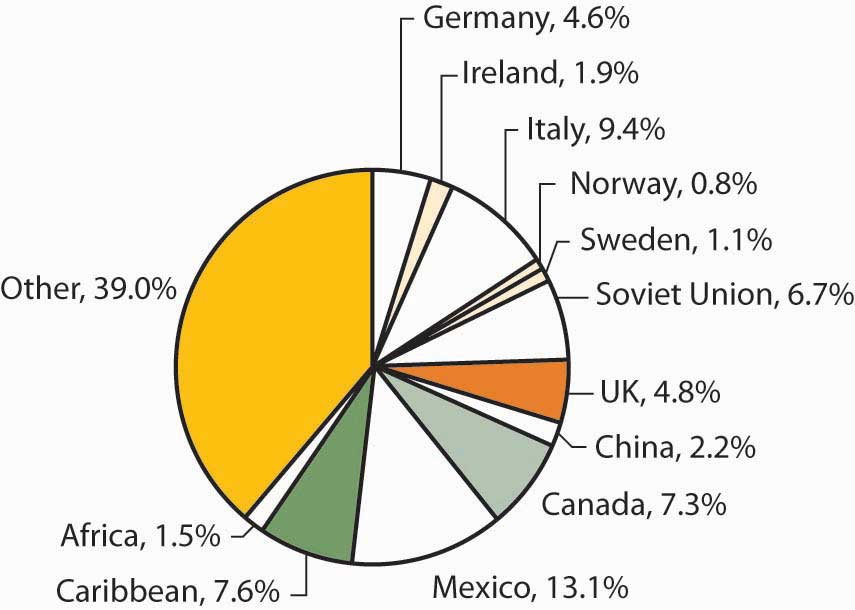
The majority of immigrants during this century came from Europe, but immigration from Europe has been declining for most of the century while immigration from Asia and Latin America has grown substantially. Figure 7 aggregates the total country-of-origin data over the century to identify the major sources of immigrants.
Another topic the Census Bureau examines is the population by age and gender.
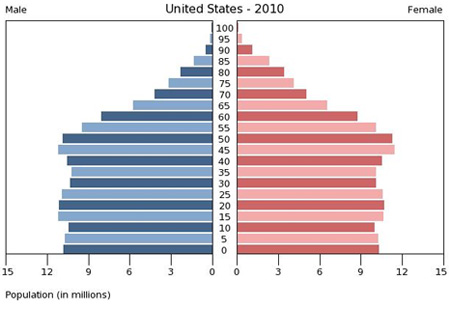
retrieved from www.premedhq.com/gender
The "baby boom" was an unusually high birthrate that began after World War II and lasted from 1945 until 1967. The population pyramid shows a slight bulge (ages 48-70) and as the population ages, this group will be pushed upwards. Notice that based on the population pyramid that there was a decline in births from 1975-1990, and then another slight increase in birth rates beginning from 1995-2000.
The increase in the number of "baby boomers" will have an economic impact when the majority of them reach retirement. This will alter the number of people who will no longer be working but will be collecting Social Security, pensions, and Medicare. The fact that a larger number of people will be retired will create an unusually heavy burden on the younger, smaller workforce. The significant number of people getting these "transfer payments" will change the dependency ratio, or the ratio based on the number of children and elderly for every 100 persons in the working age bracket (ages 18-64).
According to the U.S. Census Bureau
"...the dependency ratio, or the number of people 65 and older to every 100 people of traditional working ages, is projected to climb rapidly from 22 in 2010 to 35 in 2030. This time period coincides with the time when baby boomers are moving into the 65 and older age category. After 2030, however, the ratio of the aging population to the working-age population (ages 20 to 64) will rise more slowly, to 37 in 2050. The higher this old-age dependency ratio, the greater the potential burden."
(retrieved from www.census.gov/newsroom/releases/archives/aging_population/cb10-72.html )
Besides the size of the population, the U.S. pyramid also shows the number of men and women by population. The size of the male population is slightly smaller as it ages. Women tend to live longer than men in the U.S. The average life expectancy for men is 76, for women it is 81. Life expectancy is an important indicator of how well people in a country live. The average for the United States is 79 years old. The country with the shortest life expectancy is Botswana at 47 years old, while the countries with the longest life expectancy are found in both Japan and Iceland at 83 years old, based on 2010-2014 statistics.
(retrieved from http://data.worldbank.org/indicator/SP.DYN.LE00.IN)
The Census Bureau has projected that in the category of race and ethnicity there will be a change over time. Up until recently, whites were the largest group, however, since 1990, there has been a shift toward a larger percentage of the population being of Hispanic origin. Differences in fertility rates and immigration will continue to change the trend in the makeup of the U.S. population.
Both the Bureau of Labor Statistics and the United States Census Bureau are the best sources of additional information regarding U.S. statistics. For additional information from the Bureau of Labor Statistics visit their website.
The United States Census Bureau has a wealth of information related to economic growth, population, age, and immigration. Visit their web page at Census Bureau.
 Answer the self check questions below to monitor your understanding of concepts in this section.
Self Check Questions
- How can population growth influence GDP?
- What is the U.S. Census? What is its purpose?
- Define "urban population".
- Define "rural population".
- Go online and look up the historic population growth of the United States since 1860. What has accounted for population growth? Where do most people live in the U.S. today? What possible reasons would account for these population numbers?
- What is the role of a demographer?
- Define "fertility rate".
- Go online and find out about fertility rates. Which countries have the "highest" rates? Which ones have the "lowest" rates? How can fertility rates impact standard of living in a country? What do countries with high fertility rates have in common? What do countries with low fertility rates have in common? How does the U.S. rank in comparison to other nations?
- Define "life expectancy".
- Go online and find out about life expectancy. Which countries have the "highest" life expectancy? Which ones have the "lowest" life expectancy? How can life expectancies impact standard of living in a country? What do countries with high life expectancy have in common? What do countries with low life expectancy have in common? How does the U.S. rank in comparison to other nations?
- Define "net immigration".
- Go online and find out about the current U.S. net immigration rate. How has it changed over the last 100 years? Where have immigrants migrated from in the early 1900s compared to other years, such as 1910, 1930, 1960, 1980, 2000, and 2010?
- Besides taking a census every 10 years, what other statistics does the U.S. Census Bureau research? Go online and make a list of other statistics that the U.S. Census Bureau collects.
- What is the U.S. Census Bureau projecting for the United States regarding race and ethnic populations over the next decade? What about by the year 2050?