
4.5: Deficits, Surpluses, and the National Debt
- Page ID
- 6973
\( \newcommand{\vecs}[1]{\overset { \scriptstyle \rightharpoonup} {\mathbf{#1}} } \)
\( \newcommand{\vecd}[1]{\overset{-\!-\!\rightharpoonup}{\vphantom{a}\smash {#1}}} \)
\( \newcommand{\id}{\mathrm{id}}\) \( \newcommand{\Span}{\mathrm{span}}\)
( \newcommand{\kernel}{\mathrm{null}\,}\) \( \newcommand{\range}{\mathrm{range}\,}\)
\( \newcommand{\RealPart}{\mathrm{Re}}\) \( \newcommand{\ImaginaryPart}{\mathrm{Im}}\)
\( \newcommand{\Argument}{\mathrm{Arg}}\) \( \newcommand{\norm}[1]{\| #1 \|}\)
\( \newcommand{\inner}[2]{\langle #1, #2 \rangle}\)
\( \newcommand{\Span}{\mathrm{span}}\)
\( \newcommand{\id}{\mathrm{id}}\)
\( \newcommand{\Span}{\mathrm{span}}\)
\( \newcommand{\kernel}{\mathrm{null}\,}\)
\( \newcommand{\range}{\mathrm{range}\,}\)
\( \newcommand{\RealPart}{\mathrm{Re}}\)
\( \newcommand{\ImaginaryPart}{\mathrm{Im}}\)
\( \newcommand{\Argument}{\mathrm{Arg}}\)
\( \newcommand{\norm}[1]{\| #1 \|}\)
\( \newcommand{\inner}[2]{\langle #1, #2 \rangle}\)
\( \newcommand{\Span}{\mathrm{span}}\) \( \newcommand{\AA}{\unicode[.8,0]{x212B}}\)
\( \newcommand{\vectorA}[1]{\vec{#1}} % arrow\)
\( \newcommand{\vectorAt}[1]{\vec{\text{#1}}} % arrow\)
\( \newcommand{\vectorB}[1]{\overset { \scriptstyle \rightharpoonup} {\mathbf{#1}} } \)
\( \newcommand{\vectorC}[1]{\textbf{#1}} \)
\( \newcommand{\vectorD}[1]{\overrightarrow{#1}} \)
\( \newcommand{\vectorDt}[1]{\overrightarrow{\text{#1}}} \)
\( \newcommand{\vectE}[1]{\overset{-\!-\!\rightharpoonup}{\vphantom{a}\smash{\mathbf {#1}}}} \)
\( \newcommand{\vecs}[1]{\overset { \scriptstyle \rightharpoonup} {\mathbf{#1}} } \)
\( \newcommand{\vecd}[1]{\overset{-\!-\!\rightharpoonup}{\vphantom{a}\smash {#1}}} \)
\(\newcommand{\avec}{\mathbf a}\) \(\newcommand{\bvec}{\mathbf b}\) \(\newcommand{\cvec}{\mathbf c}\) \(\newcommand{\dvec}{\mathbf d}\) \(\newcommand{\dtil}{\widetilde{\mathbf d}}\) \(\newcommand{\evec}{\mathbf e}\) \(\newcommand{\fvec}{\mathbf f}\) \(\newcommand{\nvec}{\mathbf n}\) \(\newcommand{\pvec}{\mathbf p}\) \(\newcommand{\qvec}{\mathbf q}\) \(\newcommand{\svec}{\mathbf s}\) \(\newcommand{\tvec}{\mathbf t}\) \(\newcommand{\uvec}{\mathbf u}\) \(\newcommand{\vvec}{\mathbf v}\) \(\newcommand{\wvec}{\mathbf w}\) \(\newcommand{\xvec}{\mathbf x}\) \(\newcommand{\yvec}{\mathbf y}\) \(\newcommand{\zvec}{\mathbf z}\) \(\newcommand{\rvec}{\mathbf r}\) \(\newcommand{\mvec}{\mathbf m}\) \(\newcommand{\zerovec}{\mathbf 0}\) \(\newcommand{\onevec}{\mathbf 1}\) \(\newcommand{\real}{\mathbb R}\) \(\newcommand{\twovec}[2]{\left[\begin{array}{r}#1 \\ #2 \end{array}\right]}\) \(\newcommand{\ctwovec}[2]{\left[\begin{array}{c}#1 \\ #2 \end{array}\right]}\) \(\newcommand{\threevec}[3]{\left[\begin{array}{r}#1 \\ #2 \\ #3 \end{array}\right]}\) \(\newcommand{\cthreevec}[3]{\left[\begin{array}{c}#1 \\ #2 \\ #3 \end{array}\right]}\) \(\newcommand{\fourvec}[4]{\left[\begin{array}{r}#1 \\ #2 \\ #3 \\ #4 \end{array}\right]}\) \(\newcommand{\cfourvec}[4]{\left[\begin{array}{c}#1 \\ #2 \\ #3 \\ #4 \end{array}\right]}\) \(\newcommand{\fivevec}[5]{\left[\begin{array}{r}#1 \\ #2 \\ #3 \\ #4 \\ #5 \\ \end{array}\right]}\) \(\newcommand{\cfivevec}[5]{\left[\begin{array}{c}#1 \\ #2 \\ #3 \\ #4 \\ #5 \\ \end{array}\right]}\) \(\newcommand{\mattwo}[4]{\left[\begin{array}{rr}#1 \amp #2 \\ #3 \amp #4 \\ \end{array}\right]}\) \(\newcommand{\laspan}[1]{\text{Span}\{#1\}}\) \(\newcommand{\bcal}{\cal B}\) \(\newcommand{\ccal}{\cal C}\) \(\newcommand{\scal}{\cal S}\) \(\newcommand{\wcal}{\cal W}\) \(\newcommand{\ecal}{\cal E}\) \(\newcommand{\coords}[2]{\left\{#1\right\}_{#2}}\) \(\newcommand{\gray}[1]{\color{gray}{#1}}\) \(\newcommand{\lgray}[1]{\color{lightgray}{#1}}\) \(\newcommand{\rank}{\operatorname{rank}}\) \(\newcommand{\row}{\text{Row}}\) \(\newcommand{\col}{\text{Col}}\) \(\renewcommand{\row}{\text{Row}}\) \(\newcommand{\nul}{\text{Nul}}\) \(\newcommand{\var}{\text{Var}}\) \(\newcommand{\corr}{\text{corr}}\) \(\newcommand{\len}[1]{\left|#1\right|}\) \(\newcommand{\bbar}{\overline{\bvec}}\) \(\newcommand{\bhat}{\widehat{\bvec}}\) \(\newcommand{\bperp}{\bvec^\perp}\) \(\newcommand{\xhat}{\widehat{\xvec}}\) \(\newcommand{\vhat}{\widehat{\vvec}}\) \(\newcommand{\uhat}{\widehat{\uvec}}\) \(\newcommand{\what}{\widehat{\wvec}}\) \(\newcommand{\Sighat}{\widehat{\Sigma}}\) \(\newcommand{\lt}{<}\) \(\newcommand{\gt}{>}\) \(\newcommand{\amp}{&}\) \(\definecolor{fillinmathshade}{gray}{0.9}\)Deficits, Surpluses, and the National Debt
The government projects its future revenues and expenditures, however, it depends on how strong the economy is and whether or not there will be economic growth. A projected surplus means that the government has collected more revenues than it will spend (expenditures) on programs. A projected deficit means that the government will collect less taxes (revenues) than it has estimated it will need to spend to maintain specific programs.
Universal Generalizations
- Deficit spending has helped to create the national debt.
- The federal government’s decision to maintain its economic policies related to the economic goals of economic growth, stability and full employment has impacted annual federal budgets.
Guiding Questions
- If the federal government wanted to lower the national debt, what would it have to do?
- Why is deficit spending sometimes considered necessary?
Video: WWII Vet Offers Emotional Warning about Growing National Debt
Deficit Spending
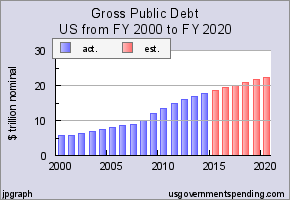
Since the end of World War II, the federal budget has been characterized by an enormous amount of deficit spending. Deficit spending is when the government spends more money than it has collected in revenues (taxes). Sometimes deficit spending by the government is necessary and planned, other times it is forced to do this because of unexpected developments and unforeseen events at home or abroad. When the federal government runs a deficit , it has to finance its spending with money it will need to borrow. Borrowing funds can come from citizens or foreign countries. Treasury bonds and other forms of government debt are sold to raise these necessary funds. If we add up all of the debt, or federal debt, it is the amount of money borrowed from investors to finance the government's current deficit spending.
As of July 2015 the national debt stands at $18,581,234,768,000. At the end of FY 2015 the total government debt in the United States, including federal, state, and local, is expected to be $21.694 trillion.
(Source: www.usgovernmentdebt.us/)
Some of the debt is money the government owes to itself, or debt held in government trust funds. These funds are special accounts used to fund specific types of expenditures such as Medicare and Social Security. When the government collects the FICA tax from individuals, it invests that money in the trust or government securities until that money is paid out. While this is money the government owes to itself, it is still a significant portion of the debt.
This debt is a public debt. Because the government owes it to itself, it does not have the same impact as a private debt. A private debt is one that individuals owe to another and therefore it must be paid. For the government, it does not worry about the eventual repayment of the loan because it can simply issue more bonds to cover the outstanding debt. When the government does repay its debt, there is no loss of purchasing power as there is for individuals who gives up some of its purchasing power to pay off their debts. The government simply collects taxes and then redistributes the money to others. The exception of this rule is the debt that is owed to foreigners, which accounts for between 15-20% of the debt. This money is considered a loss of purchasing power since the money will be diverted from the US economy.
The United States as a Global Borrower
In the global economy, trillions of dollars of financial investment cross national borders every year. In the early 2000s, financial investors from foreign countries were investing several hundred billion dollars per year more in the U.S. economy than U.S. financial investors were investing abroad. The following Work It Out deals with one of the macroeconomic concerns for the U.S. economy in recent years.

The Effect of Growing U.S. Debt
Imagine that the U.S. economy became viewed as a less desirable place for foreign investors to put their money because of fears about the growth of the U.S. public debt. Using the four-step process for analyzing how changes in supply and demand affect equilibrium outcomes, how would increased U.S. public debt affect the equilibrium price and quantity for capital in U.S. financial markets?
Step 1. Draw a diagram showing demand and supply for financial capital that represents the original scenario in which foreign investors are pouring money into the U.S. economy. Figure 3 shows a demand curve, D, and a supply curve, S, where the supply of capital includes the funds arriving from foreign investors. The original equilibrium E0 occurs at interest rate R0 and quantity of financial investment Q0.
The United States as a Global Borrower Before U.S. Debt Uncertainty
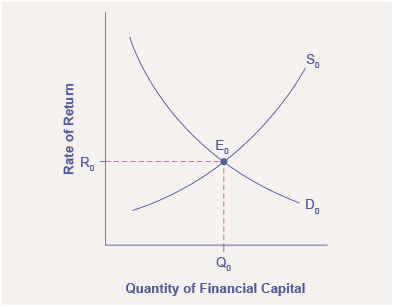
The graph shows the demand for financial capital from and supply of financial capital into the U.S. financial markets by the foreign sector before the increase in uncertainty regarding U.S. public debt. The original equilibrium (E0) occurs at an equilibrium rate of return (R0) and the equilibrium quantity is at Q0.
Step 2. Will the diminished confidence in the U.S. economy as a place to invest effect demand or supply of financial capital? Yes, it will effect supply. Many foreign investors look to the U.S. financial markets to store their money in safe financial vehicles with low risk and stable returns. As the U.S. debt increases, debt servicing will increase—that is, more current income will be used to pay the interest rate on past debt. Increasing U.S. debt also means that businesses may have to pay higher interest rates to borrow money because business is now competing with the government for financial resources.
Step 3. Will supply increase or decrease? When the enthusiasm of foreign investors’ for investing their money in the U.S. economy diminishes, the supply of financial capital shifts to the left. Figure 4 shows the supply curve shift from S0 to S1.
The United States as a Global Borrower Before and After U.S. Debt Uncertainty
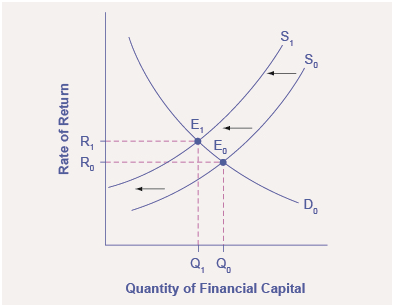
The graph shows the demand for financial capital and supply of financial capital into the U.S. financial markets by the foreign sector before and after the increase in uncertainty regarding U.S. public debt. The original equilibrium (E0) occurs at an equilibrium rate of return (R0) and the equilibrium quantity is at Q0.
Step 4. Thus, foreign investors’ diminished enthusiasm leads to a new equilibrium, E1, which occurs at the higher interest rate, R1, and the lower quantity of financial investment, Q1.
The economy has experienced an enormous inflow of foreign capital. According to U.S. Bureau of Economic Analysis, by 2012, U.S. investors had accumulated $20.1 trillion of foreign assets, but foreign investors owned a total $25.2 trillion of U.S. assets. If foreign investors were to pull their money out of the U.S. economy and invest elsewhere in the world, the result could be a significantly lower quantity of financial investment in the United States, available only at a higher interest rate. This reduced inflow of foreign financial investment could impose hardship on U.S. consumers and firms interested in borrowing.
In a modern, developed economy, financial capital often moves invisibly through electronic transfers between one bank account and another. Yet these flows of funds can be analyzed with the same tools of demand and supply as markets for goods or labor.
Video: The National Debt and Federal Budget Deficit Deconstructed
Federal Deficits and the National Debt
Having discussed the revenue (taxes) and expense (spending) side of the budget, we now turn to the annual budget deficit or surplus, which is the difference between the tax revenue collected and spending over a fiscal year, which starts October 1 and ends September 30 of the next year.
Figure 5 shows the pattern of annual federal budget deficits and surpluses, back to 1930, as a share of GDP. When the line is above the horizontal axis, the budget is in surplus; when the line is below the horizontal axis, a budget deficit occurred. Clearly, the biggest deficits as a share of GDP during this time were incurred to finance World War II. Deficits were also large during the 1930s, the 1980s, the early 1990s, and most recently during the recession of 2008–2009.
Pattern of Federal Budget Deficits and Surpluses, 1930–2012
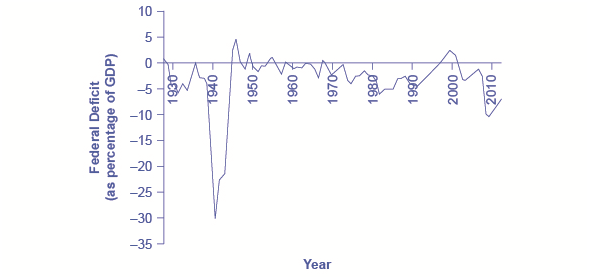
The federal government has run budget deficits for decades. The budget was briefly in surplus in the late 1990s before heading into deficit again in the first decade of the 2000s—and especially deep deficits in the recession of 2008–2009. (Source: Economic Report of the President, Table B-79, http://www.gpo.gov/fdsys/pkg/ERP-201...nt-detail.html)
Debt/GDP Ratio
Another useful way to view the budget deficit is through the prism of accumulated debt rather than annual deficits. The national debt refers to the total amount that the government has borrowed over time; in contrast, the budget deficit refers to how much has been borrowed in one particular year. Figure 6 shows the ratio of debt/GDP since 1940. Until the 1970s, the debt/GDP ratio revealed a fairly clear pattern of federal borrowing. The government ran up large deficits and raised the debt/GDP ratio in World War II, but from the 1950s to the 1970s the government ran either surpluses or relatively small deficits, and so the debt/GDP ratio drifted down. Large deficits in the 1980s and early 1990s caused the ratio to rise sharply. When budget surpluses arrived from 1998 to 2001, the debt/GDP ratio declined substantially. The budget deficits starting in 2002 then tugged the debt/GDP ratio higher—with a big jump when the recession took hold in 2008–2009.
Federal Debt as a Percentage of GDP, 1940–2010
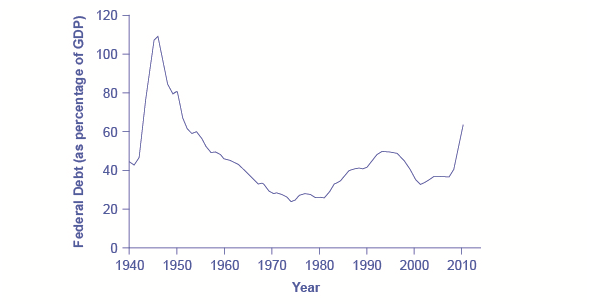
When government spending exceeds taxes, the gap is the budget deficit. When taxes exceed spending, the gap is a budget surplus. The recessionary period starting in late 2007 saw higher spending and lower taxes, combining to create a large deficit in 2009. (Source: Economic Report of the President, Tables B-80, B-81, and B-1, https://www.gpo.gov/fdsys/pkg/ERP-2013/content-detail.html)
Government spending as a share of GDP declined steadily through the 1990s. The biggest single reason was that defense spending declined from 5.2% of GDP in 1990 to 3.0% in 2000, but interest payments by the federal government also fell by about 1.0% of GDP. However, federal tax collections increased substantially in the later 1990s, jumping from 18.1% of GDP in 1994 to 20.8% in 2000. Powerful economic growth in the late 1990s fueled the boom in taxes. Personal income taxes rise as income goes up; payroll taxes rise as jobs and payrolls go up; corporate income taxes rise as profits go up. At the same time, government spending on transfer payments such as unemployment benefits, foods stamps, and welfare declined with more people working.
This sharp increase in tax revenues and a decrease in expenditures on transfer payments was largely unexpected--even by experienced budget analysts. Budget surpluses came as a surprise. In the early 2000s, many of these factors started running in reverse. Tax revenues sagged, due largely to the recession that started in March 2001, which reduced revenues. A series of tax cuts were enacted by Congress and signed into law by President George W. Bush in 2001. In addition, government spending swelled due to increases in defense, healthcare, education, Social Security, and support programs for those who were hurt by the recession and the slow growth that followed. Deficits returned. When the severe recession hit in late 2007, spending climbed and tax collections fell to historically unusual levels, resulting in enormous deficits.
Longer-term forecasts of the U.S. budget, a decade or more into the future, predict enormous deficits. The higher deficits run during the recession of 2008–2009 have repercussions, and the demographics will be challenging. The primary reason is the “baby boom”—the exceptionally high birthrates that began in 1946, right after World War II, and lasted for about two decades. Starting in 2010, the front edge of the baby boom generation began to reach age 65, and in the next two decades, the proportion of Americans over the age of 65 will increase substantially. The current level of the payroll taxes that support Social Security and Medicare will fall well short of the projected expenses of these programs, as the following Clear It Up feature shows; thus, the forecast is for large budget deficits. A decision to collect more revenue to support these programs or to decrease benefit levels would alter this long-term forecast.
What is the Long-term Budget Outlook for Social Security and Medicare?
In 1946, just one American in 13 was over age 65. By 2000, it was one in eight. By 2030, one American in five will be over age 65. Two enormous U.S. federal programs focus on the elderly—Social Security and Medicare. The growing numbers of elderly Americans will increase spending on these programs, as well as on Medicaid. The current payroll tax levied on workers, which supports all of Social Security and the hospitalization insurance part of Medicare will not be enough to cover the expected costs. So, what are the options?
Long-term projections from the Congressional Budget Office in 2009 are that Medicare and Social Security spending combined will rise from 8.3% of GDP in 2009 to about 13% by 2035 and about 20% in 2080. If this rise in spending occurs without any corresponding rise in tax collections, then some mix of changes must occur: (1) taxes will need to be increased dramatically; (2) other spending will need to be cut dramatically; (3) the retirement age and/or age receiving Medicare benefits will need to increase, or (4) the federal government will need to run extremely large budget deficits.
Some proposals suggest removing the cap on wages subject to the payroll tax, so those with very high incomes would have to pay the tax on the entire amount of their wages. Other proposals suggest moving Social Security and Medicare from systems in which workers pay for retirees toward programs that set up accounts where workers save funds over their lifetimes and then draw out after retirement to pay for healthcare.
The United States is not alone in this problem. Indeed, providing the promised level of retirement and health benefits to a growing proportion of elderly with a falling proportion of workers is an even more severe problem in many European nations and in Japan. How to pay promised levels of benefits to the elderly will be a difficult public policy decision.
In the next module, we shift to the use of fiscal policy to counteract business cycle fluctuations. In addition, we will explore proposals requiring a balanced budget—that is, for government spending and taxes to be equal each year. Fiscal policy and government borrowing also will affect national saving—and thus affect economic growth and trade imbalances.
For most of the twentieth-century, the U.S. government took on debt during wartime then slowly paid down that debt in peacetime. However, it took on quite substantial debts in peacetime in the 1980s and early 1990s before a brief period of budget surpluses from 1998 to 2001. This was followed by a return to annual budget deficits since 2002, with very large deficits in the recession of 2008 and 2009. A budget deficit or budget surplus is measured annually. Total government debt or national debt is the sum of budget deficits and budget surpluses over time.
The Question of a Balanced Budget
For many decades, going back to the 1930s, proposals have been put forward to require that the U.S. government balance its budget every year. In 1995, a proposed constitutional amendment that would require a balanced budget passed the U.S. House of Representatives by a wide margin and failed in the U.S. Senate by only a single vote. (For the balanced budget to have become an amendment to the Constitution would have required a two-thirds vote by Congress and passage by three-quarters of the state legislatures.)
Most economists view the proposals for a perpetually balanced budget with bemusement. After all, in the short term, economists would expect the budget deficits and surpluses to fluctuate up and down with the economy and the automatic stabilizers. Economic recessions should automatically lead to larger budget deficits or smaller budget surpluses while economic booms lead to smaller deficits or larger surpluses. A requirement that the budget is balanced each and every year would prevent these automatic stabilizers from working and would worsen the severity of economic fluctuations.
Some supporters of the balanced budget amendment like to argue, since households must balance their own budgets, the government should too. But this analogy between household and government behavior is severely flawed. Most households do not balance their budgets every year. Some years households borrow to buy houses or cars or to pay for medical expenses or college tuition. Other years they repay loans and save funds in retirement accounts. After retirement, they withdraw and spend those savings. Also, the government is not a household for many reasons, one of which is that the government has macroeconomic responsibilities. The argument of Keynesian macroeconomic policy is that the government needs to lean against the wind, spending when times are hard and saving when times are good, for the sake of the overall economy.
There is also no particular reason to expect a government budget to be balanced in the medium term of a few years. For example, a government may decide that by running large budget deficits, it can make crucial long-term investments in human capital and physical infrastructure that will build the long-term productivity of a country. These decisions may work out well or poorly, but they are not always irrational. Such policies of ongoing government budget deficits may persist for decades. As the U.S. experience from the end of World War II up to about 1980 shows, it is perfectly possible to run budget deficits almost every year for decades, but as long as the percentage increases in debt are smaller than the percentage growth of GDP, the debt/GDP ratio will decline at the same time.
Nothing in this argument should be taken as a claim that budget deficits are always a wise policy. In the short run, a government that runs a very large budget deficit can shift aggregate demand to the right and trigger severe inflation. Additionally, governments may borrow for foolish or impractical reasons. Large budget deficits reduce national savings and can, in certain cases, reduce economic growth and even contribute to international financial crises. A requirement that the budget be balanced in each calendar year, however, is a misguided overreaction to the fear that in some cases, budget deficits can become too large.

The federal budget shutdown of 2013 illustrated the many sides to fiscal policy and the federal budget. In 2013, Republicans and Democrats could not agree on which spending policies to fund and how large the government debt should be. Due to the severity of the recession in 2008–2009, the fiscal stimulus, and previous policies, the federal budget deficit and debt was historically high. One way to try to cut federal spending and borrowing was to refuse to raise the legal federal debt limit or tie on conditions to appropriation bills to stop the Affordable Health Care Act. This disagreement led to a two-week shutdown of the federal government and got close to the deadline where the federal government would default on its Treasury bonds. Finally, however, a compromise emerged and default was avoided. This shows clearly how closely fiscal policies are tied to politics.
Balanced budget amendments are a popular political idea, but the economic merits behind such proposals are questionable. Most economists accept that fiscal policy needs to be flexible enough to accommodate unforeseen expenditures, such as wars or recessions. While persistent, large budget deficits can indeed be a problem, a balanced budget amendment prevents even small, temporary deficits that might, in some cases, be necessary.
The Impacts of Government Borrowing
Balanced budget amendments are a popular political idea, but the economic merits behind such proposals are questionable. Most economists accept that fiscal policy needs to be flexible enough to accommodate unforeseen expenditures, such as wars or recessions. While persistent, large budget deficits can indeed be a problem, a balanced budget amendment prevents even small, temporary deficits that might, in some cases, be necessary.
Governments have many competing demands for financial support. Any spending should be tempered by fiscal responsibility and by looking carefully at the spending’s impact. When a government spends more than it collects in taxes, it runs a budget deficit. Then it needs to borrow. When government borrowing becomes especially large and sustained, it can substantially reduce the financial capital available to private sector firms, as well as lead to trade imbalances and even financial crises.
We have discussed the concepts of deficits and debt, as well as how a government could use fiscal policy to address recession or inflation. This chapter begins by building on the national savings and investment identity, to show how government borrowing affects firms’ physical capital investment levels and trade balances. A prolonged period of budget deficits may lead to lower economic growth, in part because the funds borrowed by the government to fund its budget deficits are typically no longer available for private investment. Moreover, a sustained pattern of large budget deficits can lead to disruptive economic patterns of high inflation, substantial inflows of financial capital from abroad, plummeting exchange rates, and heavy strains on a country’s banking and financial system.
How Government Borrowing Affects Investment and the Trade Balance
When governments are borrowers in financial markets, there are three possible sources for the funds from a macroeconomic point of view: (1) households might save more; (2) private firms might borrow less; and (3) the additional funds for government borrowing might come from outside the country, from foreign financial investors. Let’s begin with a review of why one of these three options must occur, and then explore how interest rates and exchange rates adjust to these connections.
The National Saving and Investment Identity
The national saving and investment identity provides a framework for showing the relationships between the sources of demand and supply in financial capital markets. The identity begins with a statement that must always hold true: the quantity of financial capital supplied in the market must equal the quantity of financial capital demanded.
The U.S. economy has two main sources for financial capital: private savings from inside the U.S. economy and public savings.
Total savings = Private savings (S) + Public savings (T – G)
These include the inflow of foreign financial capital from abroad. The inflow of savings from abroad is, by definition, equal to the trade deficit. So this inflow of foreign investment capital can be written as imports (M) minus exports (X). There are also two main sources of demand for financial capital: private sector investment (I) and government borrowing. Government borrowing in any given year is equal to the budget deficit, and can be written as the difference between government spending (G) and net taxes (T). Let’s call this equation 1.
Quantity supplied of financial capital = Quantity demanded of financial capital
Private savings + Inflow of foreign savings= Private investment + Government budget deficit
S + (M – X) = I + (G –T)
Governments often spend more than they receive in taxes and, therefore, public savings (T – G) is negative. This causes a need to borrow money in the amount of (G – T) instead of adding to the nation’s savings. If this is the case, governments can be viewed as demanders of financial capital instead of suppliers. So, in algebraic terms, the national savings and investment identity can be rewritten like this:
Private investment = Private savings + Public savings + Trade deficit
I = S + (T – G) + (M – X)
Let’s call this equation 2. A change in any part of the national saving and investment identity must be accompanied by offsetting changes in at least one other part of the equation because the equality of quantity supplied and quantity demanded is always assumed to hold. If the government budget deficit changes, then either private saving or investment or the trade balance—or some combination of the three—must change as well. Figure 8 shows the possible effects.
Effects of Change in Budget Surplus or Deficit on Investment, Savings, and The Trade Balance
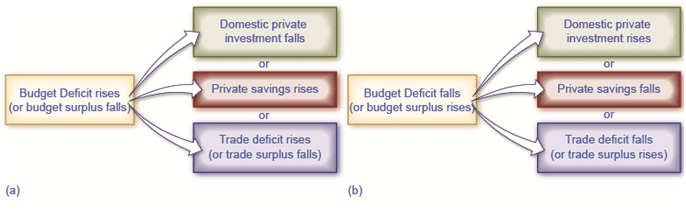
Chart (a) shows the potential results when the budget deficit rises (or budget surplus falls). Chart (b) shows the potential results when the budget deficit falls (or budget surplus rises).
What about Budget Surpluses and Trade Surpluses?
The national saving and investment identity must always hold true because, by definition, the quantity supplied and quantity demanded in the financial capital market must always be equal. However, the formula will look somewhat different if the government budget is in deficit rather than surplus or if the balance of trade is in surplus rather than deficit. For example, in 1999 and 2000, the U.S. government had budget surpluses, although the economy was still experiencing trade deficits. When the government was running budget surpluses, it was acting as a saver rather than a borrower, and supplying rather than demanding financial capital. As a result, the national saving and investment identity during this time would be more properly written:
Quantity supplied of financial capital= Quantity demanded of financial capital
Private savings + Trade deficit + Government surplus= Private Investment
S + (M – X) + (T – G) = I
Let's call this equation 3. Notice that this expression is mathematically the same as equation 2 except the savings and investment sides of the identity have simply flipped sides.
During the 1960s, the U.S. government was often running a budget deficit, but the economy was typically running trade surpluses. Since a trade surplus means that an economy is experiencing a net outflow of financial capital, the national saving and investment identity would be written:
Quantity supplied of financial capital = Quantity demanded of financial capital
Private savings = Private investment + Outflow of foreign savings + Government budget deficit
S= I + (X – M) + (G – T)
Instead of the balance of trade representing part of the supply of financial capital, which occurs with a trade deficit, a trade surplus represents an outflow of financial capital leaving the domestic economy and being invested elsewhere in the world.
Quantity supplied of financial capital= Quantity demanded of financial capital demand
Private savings = Private investment + Government budget deficit + Trade surplus
I + (G – T) + (X – M)
The point to this parade of equations is that the national saving and investment identity is assumed to always hold. So when you write these relationships, it is important to engage your brain and think about what is on the supply side and what is on the demand side of the financial capital market before you put pencil to paper.
As can be seen in Figure 9, the Office of Management and Budget shows that the United States has consistently run budget deficits since 1977, with the exception of 1999 and 2000. What is alarming is the dramatic increase in budget deficits that has occurred since 2008, which in part reflects declining tax revenues and increased safety net expenditures due to the Great Recession. (Recall that T is net taxes. When the government must transfer funds back to individuals for safety net expenditures like Social Security and unemployment benefits, budget deficits rise.) These deficits have implications for the future health of the U.S. economy.
United States On-Budget, Surplus, and Deficit, 1977–2012 (in millions)
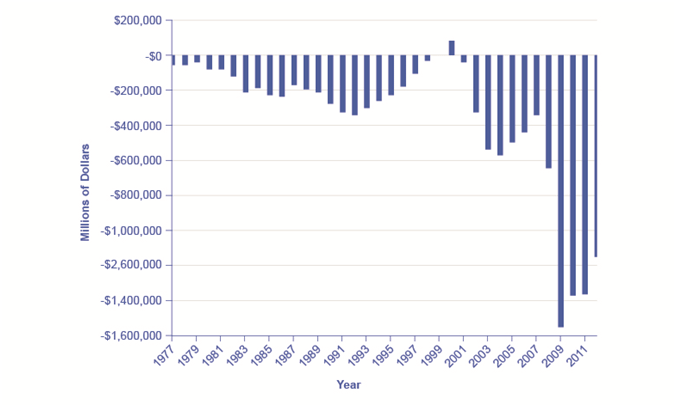
The United States has run a budget deficit for over 30 years, with the exception of 1999 and 2000. Military expenditures, entitlement programs, and the decrease in tax revenue coupled with increased safety net support during the Great Recession are major contributors to the dramatic increases in the deficit after 2008. (Source: https://www.whitehouse.gov/omb)
A rising budget deficit may result in a fall in domestic investment, a rise in private savings, or a rise in the trade deficit. The following modules discuss each of these possible effects in more detail. A change in any part of the national saving and investment identity suggests that if the government budget deficit changes, then either private savings, private investment in physical capital, or the trade balance—or some combination of the three—must change as well.
How Government Borrowing Affects Private Saving
A change in government budgets may impact private saving. Imagine that people watch government budgets and adjust their savings accordingly. For example, whenever the government runs a budget deficit, people might reason: “Well, a higher budget deficit means that I’m just going to owe more taxes in the future to pay off all that government borrowing, so I’ll start saving now.” If the government runs budget surpluses, people might reason: “With these budget surpluses (or lower budget deficits), interest rates are falling, so that saving is less attractive. Moreover, with a budget surplus the country will be able to afford a tax cut sometime in the future. I won’t bother saving as much now.”
The theory that rational private households might shift their saving to offset government saving or borrowing is known as Ricardian equivalence because the idea has intellectual roots in the writings of the early nineteenth-century economist David Ricardo (1772–1823). If Ricardian equivalence holds completely true, then in the national saving and investment identity, any change in budget deficits or budget surpluses would be completely offset by a corresponding change in private saving. As a result, changes in government borrowing would have no effect at all on either physical capital investment or trade balances.
In practice, the private sector only sometimes and partially adjusts its savings behavior to offset government budget deficits and surpluses. Figure 10 shows the patterns of U.S. government budget deficits and surpluses and the rate of private saving—which includes saving by both households and firms—since 1980. The connection between the two is not at all obvious. In the mid-1980s, for example, government budget deficits were quite large, but there is no corresponding surge of private saving. However, when budget deficits turn to surpluses in the late 1990s, there is a simultaneous decline in private saving. When budget deficits get very large in 2008 and 2009, on the other hand, there is some sign of a rise in saving. A variety of statistical studies based on the U.S. experience suggests that when government borrowing increases by $1, private saving rises by about 30 cents. A World Bank study done in the late 1990s, looking at government budgets and private saving behavior in countries around the world, found a similar result.
U.S. Budget Deficits and Private Savings
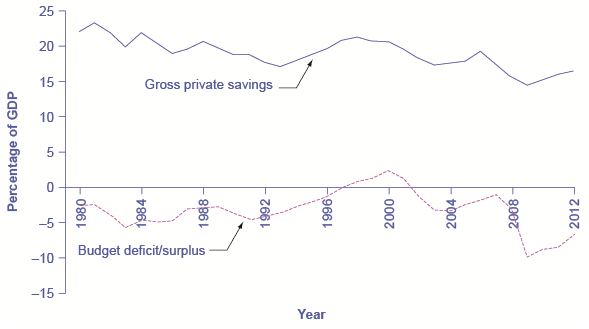
The theory of Ricardian equivalence suggests that any increase in government borrowing will be offset by additional private saving, while any decrease in government borrowing will be offset by reduced private saving. Sometimes this theory holds true, and sometimes it does not hold true at all. (Source: Bureau of Economic Analysis and Federal Reserve Economic Data)
So private saving does increase to some extent when governments run large budget deficits, and private saving falls when governments reduce deficits or run large budget surpluses. However, the offsetting effects of private saving compared to government borrowing are much less than one-to-one. In addition, this effect can vary a great deal from country to country, from time to time, and over the short run and the long run.
If the funding for a larger budget deficit comes from international financial investors, then a budget deficit may be accompanied by a trade deficit. In some countries, this pattern of a twin deficits has set the stage for international financial investors first to send their funds to a country and cause an appreciation of its exchange rate and then to pull their funds out and cause a depreciation of the exchange rate and a financial crisis as well. It depends on whether funding comes from international financial investors.
The theory of Ricardian equivalence holds that changes in government borrowing or saving will be offset by changes in private saving. Thus, higher budget deficits will be offset by greater private saving, while larger budget surpluses will be offset by greater private borrowing. If the theory holds true, then changes in government borrowing or saving would have no effect on private investment in physical capital or on the trade balance. However, empirical evidence suggests that the theory holds true only partially.
Fiscal Policy and the Trade Balance
Government budget balances can affect the trade balance. As The Keynesian Perspective discusses, a net inflow of foreign financial investment always accompanies a trade deficit, while a net outflow of financial investment always accompanies a trade surplus. One way to understand the connection from budget deficits to trade deficits is that when government creates a budget deficit with some combination of tax cuts or spending increases, it will increase aggregate demand in the economy, and some of that increase in aggregate demand will result in a higher level of imports. A higher level of imports, with exports remaining fixed, will cause a larger trade deficit. That means foreigners’ holdings of dollars increase as Americans purchase more imported goods. Foreigners use those dollars to invest in the United States, which leads to an inflow of foreign investment. One possible source of funding our budget deficit is foreigners buying Treasury securities that are sold by the U.S. government. So a budget deficit is often accompanied by a trade deficit.
Twin Deficits?
In the mid-1980s, it was common to hear economists and even newspaper articles refer to the twin deficits, as the budget deficit and trade deficit both grew substantially. Figure 11 shows the pattern. The federal budget deficit went from 2.6% of GDP in 1981 to 5.1% of GDP in 1985—a drop of 2.5% of GDP. Over that time, the trade deficit moved from 0.5% in 1981 to 2.9% in 1985—a drop of 2.4% of GDP. In the mid-1980s, the considerable increase in government borrowing was matched by an inflow of foreign investment capital, so the government budget deficit and the trade deficit moved together.
U.S. Budget Deficits and Trade Deficits
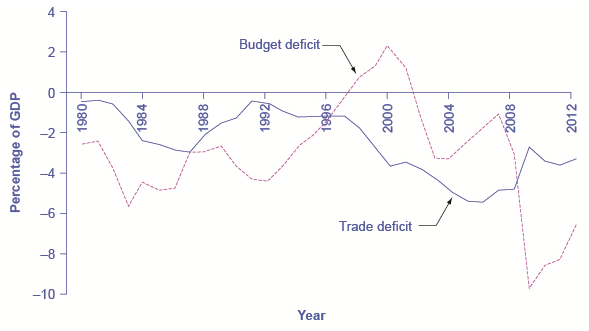
In the 1980s, the budget deficit and the trade deficit declined at the same time. However, since then, the deficits have stopped being twins. The trade deficit grew smaller in the early 1990s as the budget deficit increased, and then the trade deficit grew larger in the late 1990s as the budget deficit turned into a surplus. In the first half of the 2000s, both budget and trade deficits increased. But in 2009, the trade deficit declined as the budget deficit increased.
Of course, no one should expect the budget deficit and trade deficit to move in lockstep, because the other parts of the national saving and investment identity—investment and private savings—will often change as well. In the late 1990s, for example, the government budget balance turned from deficit to surplus, but the trade deficit remained large and growing. During this time, the inflow of foreign financial investment was supporting a surge of physical capital investment by U.S. firms. In the first half of the 2000s, the budget and trade deficits again increased together, but in 2009, the budget deficit increased while the trade deficit declined. The budget deficit and the trade deficits are related to each other, but they are more like cousins than twins.
Budget Deficits and Exchange Rates
Exchange rates can also help to explain why budget deficits are linked to trade deficits. Figure 12 shows a situation using the exchange rate for the U.S. dollar, measured in euros. At the original equilibrium (E0), where the demand for U.S. dollars (D0) intersects with the supply of U.S. dollars (S0) on the foreign exchange market, the exchange rate is 0.9 euros per U.S. dollar and the equilibrium quantity traded in the market is $100 billion per day (which was roughly the quantity of dollar–euro trading in exchange rate markets in the mid-2000s). Then the U.S. budget deficit rises and foreign financial investment provides the source of funds for that budget deficit.
International financial investors, as a group, will demand more U.S. dollars on foreign exchange markets to purchase the U.S. government bonds, and they will supply fewer of the U.S. dollars that they already hold in these markets. Demand for U.S. dollars on the foreign exchange market shifts from D0 to D1 and the supply of U.S. dollars falls from S0 to S1. At the new equilibrium (E1), the exchange rate has appreciated to 1.05 euros per dollar while, in this example, the quantity of dollars traded remains the same.
Budget Deficits and Exchange Rates
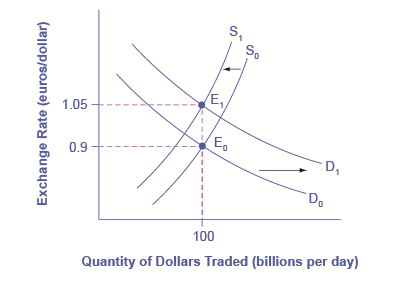
Imagine that the U.S. government increases its borrowing and the funds come from European financial investors. To purchase U.S. government bonds, those European investors will need to demand more U.S. dollars on foreign exchange markets, causing the demand for U.S. dollars to shift to the right from D0 to D1. European financial investors as a group will also be less likely to supply U.S. dollars to the foreign exchange markets, causing the supply of U.S. dollars to shift from S0 to S1. The equilibrium exchange rate strengthens from 0.9 euro/ dollar at E0 to 1.05 euros/dollar at E1.
A stronger exchange rate, of course, makes it more difficult for exporters to sell their goods abroad while making imports cheaper, so a trade deficit (or a reduced trade surplus) results. Thus, a budget deficit can easily result in an inflow of foreign financial capital, a stronger exchange rate, and a trade deficit.
You can also imagine this appreciation of the exchange rate as being driven by interest rates. As explained earlier a budget deficit increases demand in markets for domestic financial capital, raising the domestic interest rate. A higher interest rate will attract an inflow of foreign financial capital, and appreciate the exchange rate in response to the increase in demand for U.S. dollars by foreign investors and a decrease in supply of U. S. dollars. Because of higher interest rates in the United States, Americans find U.S. bonds more attractive than foreign bonds. When Americans are buying fewer foreign bonds, they are supplying fewer U.S. dollars. The depreciation of the U.S. dollar leads to a larger trade deficit (or reduced surplus). The connections between inflows of foreign investment capital, interest rates, and exchange rates are all just different ways of drawing the same economic connections: a larger budget deficit can result in a larger trade deficit, although the connection should not be expected to be one-to-one.
From Budget Deficits to International Economic Crisis
The economic story of how an outflow of international financial capital can cause a deep recession is laid out, step-by-step. When international financial investors decide to withdraw their funds from a country like Turkey, they increase the supply of the Turkish lira and reduce the demand for lira, depreciating the lira exchange rate. When firms and the government in a country like Turkey borrow money in international financial markets, they typically do so in stages. First, banks in Turkey borrow in a widely used currency like U.S. dollars or euros, then convert those U.S. dollars to lira, and then lend the money to borrowers in Turkey. If the value of the lira exchange rate depreciates, then Turkey’s banks will find it impossible to repay the international loans that are in U.S. dollars or euros.
The combination of less foreign investment capital and banks that are bankrupt can sharply reduce aggregate demand, which causes a deep recession. Many countries around the world have experienced this kind of recession in recent years: along with Turkey in 2002, this general pattern was followed by Mexico in 1995, Thailand and countries across East Asia in 1997–1998, Russia in 1998, and Argentina in 2002. In many of these countries, large government budget deficits played a role in setting the stage for the financial crisis. A moderate increase in a budget deficit that leads to a moderate increase in a trade deficit and a moderate appreciation of the exchange rate is not necessarily a cause for concern. But beyond some point that is hard to define in advance, a series of large budget deficits can become a cause for concern among international investors.
One reason for concern is that extremely large budget deficits mean that aggregate demand may shift so far to the right as to cause high inflation. The example of Turkey is a situation where very large budget deficits brought inflation rates well into double digits. In addition, very large budget deficits at some point begin to raise a fear that the borrowing will not be repaid. In the last 175 years, the government of Turkey has been unable to pay its debts and defaulted on its loans six times. Brazil’s government has been unable to pay its debts and defaulted on its loans seven times; Venezuela, nine times; and Argentina, five times. The risk of high inflation or a default on repaying international loans will worry international investors, since both factors imply that the rate of return on their investments in that country may end up lower than expected. If international investors start withdrawing the funds from a country rapidly, the scenario of less investment, a depreciated exchange rate, widespread bank failure, and deep recession can occur. The following Clear It Up feature explains other impacts of large deficits.
What are the Risks of Chronic Large Deficits in the United States?
If a government runs large budget deficits for a sustained period of time, what can go wrong? According to a recent report by the Brookings Institution, a key risk of a large budget deficit is that government debt may grow too high compared to the country’s GDP growth. As debt grows, the national savings rate will decline, leaving less available in financial capital for private investment. The impact of chronically large budget deficits is as follows:
- As the population ages, there will be an increasing demand for government services that may cause higher government deficits. Government borrowing and its interest payments will pull resources away from domestic investment in human capital and physical capital that is essential to economic growth.
- Interest rates may start to rise so that the cost of financing government debt will rise as well, creating pressure on the government to reduce its budget deficits through spending cuts and tax increases. These steps will be politically painful, and they will also have a contractionary effect on aggregate demand in the economy.
- Rising percentage of debt to GDP will create uncertainty in the financial and global markets that might cause a country to resort to inflationary tactics to reduce the real value of the debt outstanding. This will decrease real wealth and damage confidence in the country’s ability to manage its spending. After all, if the government has borrowed at a fixed interest rate of, say, 5%, and it lets inflation rise above that 5%, then it will effectively be able to repay its debt at a negative real interest rate.
The conventional reasoning suggests that the relationship between sustained deficits that lead to high levels of government debt and long-term growth is negative. How significant this relationship is, how big an issue it is compared to other macroeconomic issues, and the direction of causality, is less clear.
What remains important to acknowledge is that the relationship between debt and growth is negative and that for some countries, the relationship may be stronger than in others. It is also important to acknowledge the direction of causality: does high debt cause slow growth, slow growth cause high debt, or are both high debt and slow growth the result of third factors? In our analysis, we have argued simply that high debt causes slow growth. There may be more to this debate than we have space to discuss here.
Using Fiscal Policy to Address Trade Imbalances
If a nation is experiencing the inflow of foreign investment capital associated with a trade deficit because foreign investors are making long-term direct investments in firms, there may be no substantial reason for concern. After all, many low-income nations around the world would welcome direct investment by multinational firms that ties them more closely into the global networks of production and distribution of goods and services. In this case, the inflows of foreign investment capital and the trade deficit are attracted by the opportunities for a good rate of return on private sector investment in an economy.
However, governments should beware of a sustained pattern of high budget deficits and high trade deficits. The danger arises in particular when the inflow of foreign investment capital is not funding long-term physical capital investment by firms, but instead is short-term portfolio investment in government bonds. When inflows of foreign financial investment reach high levels, foreign financial investors will be on the alert for any reason to fear that the country’s exchange rate may decline or the government may be unable to repay what it has borrowed on time. Just as a few falling rocks can trigger an avalanche; a relatively small piece of bad news about an economy can trigger an enormous outflow of short-term financial capital.
Reducing a nation’s budget deficit will not always be a successful method of reducing its trade deficit, because other elements of the national saving and investment identity, like private saving or investment, may change instead. In those cases when the budget deficit is the main cause of the trade deficit, governments should take steps to reduce their budget deficits, lest they make their economy vulnerable to a rapid outflow of international financial capital that could bring a deep recession.
The government need not balance its budget every year. However, a sustained pattern of large budget deficits over time risks causing several negative macroeconomic outcomes: a shift to the right in aggregate demand that causes an inflationary increase in the price level; crowding out private investment in physical capital in a way that slows down economic growth; and creating a dependence on inflows of international portfolio investment which can sometimes turn into outflows of foreign financial investment that can be injurious to a macroeconomy.
 Answer the self check questions below to monitor your understanding of the concepts in this section.
Self Check Questions
- What is the federal spending deficit? What will the federal government need to do if it runs a deficit?
- What is the federal debt?
- Define the term "balanced budget."
- Go online and research what the current national debt is. Research to answer the question: What impact does the national debt have on the federal government?
- Go online and research the Gramm-Rudman-Hollings Act of 1985 (also known as the Balanced Budget and Emergency Deficit Control Act of 1985). Why did it fail?
- Go online and research the Budget Enforcement Act of 1990. Was it successful? Why or why not?
- Why was 1998 an important year in federal spending? Go online and research the reasons for the budget surplus.
- What are entitlements? How can this spending category impact the federal budget? Give an example.