4.14: The Federal Tax System
- Page ID
- 6935
\( \newcommand{\vecs}[1]{\overset { \scriptstyle \rightharpoonup} {\mathbf{#1}} } \)
\( \newcommand{\vecd}[1]{\overset{-\!-\!\rightharpoonup}{\vphantom{a}\smash {#1}}} \)
\( \newcommand{\dsum}{\displaystyle\sum\limits} \)
\( \newcommand{\dint}{\displaystyle\int\limits} \)
\( \newcommand{\dlim}{\displaystyle\lim\limits} \)
\( \newcommand{\id}{\mathrm{id}}\) \( \newcommand{\Span}{\mathrm{span}}\)
( \newcommand{\kernel}{\mathrm{null}\,}\) \( \newcommand{\range}{\mathrm{range}\,}\)
\( \newcommand{\RealPart}{\mathrm{Re}}\) \( \newcommand{\ImaginaryPart}{\mathrm{Im}}\)
\( \newcommand{\Argument}{\mathrm{Arg}}\) \( \newcommand{\norm}[1]{\| #1 \|}\)
\( \newcommand{\inner}[2]{\langle #1, #2 \rangle}\)
\( \newcommand{\Span}{\mathrm{span}}\)
\( \newcommand{\id}{\mathrm{id}}\)
\( \newcommand{\Span}{\mathrm{span}}\)
\( \newcommand{\kernel}{\mathrm{null}\,}\)
\( \newcommand{\range}{\mathrm{range}\,}\)
\( \newcommand{\RealPart}{\mathrm{Re}}\)
\( \newcommand{\ImaginaryPart}{\mathrm{Im}}\)
\( \newcommand{\Argument}{\mathrm{Arg}}\)
\( \newcommand{\norm}[1]{\| #1 \|}\)
\( \newcommand{\inner}[2]{\langle #1, #2 \rangle}\)
\( \newcommand{\Span}{\mathrm{span}}\) \( \newcommand{\AA}{\unicode[.8,0]{x212B}}\)
\( \newcommand{\vectorA}[1]{\vec{#1}} % arrow\)
\( \newcommand{\vectorAt}[1]{\vec{\text{#1}}} % arrow\)
\( \newcommand{\vectorB}[1]{\overset { \scriptstyle \rightharpoonup} {\mathbf{#1}} } \)
\( \newcommand{\vectorC}[1]{\textbf{#1}} \)
\( \newcommand{\vectorD}[1]{\overrightarrow{#1}} \)
\( \newcommand{\vectorDt}[1]{\overrightarrow{\text{#1}}} \)
\( \newcommand{\vectE}[1]{\overset{-\!-\!\rightharpoonup}{\vphantom{a}\smash{\mathbf {#1}}}} \)
\( \newcommand{\vecs}[1]{\overset { \scriptstyle \rightharpoonup} {\mathbf{#1}} } \)
\(\newcommand{\longvect}{\overrightarrow}\)
\( \newcommand{\vecd}[1]{\overset{-\!-\!\rightharpoonup}{\vphantom{a}\smash {#1}}} \)
\(\newcommand{\avec}{\mathbf a}\) \(\newcommand{\bvec}{\mathbf b}\) \(\newcommand{\cvec}{\mathbf c}\) \(\newcommand{\dvec}{\mathbf d}\) \(\newcommand{\dtil}{\widetilde{\mathbf d}}\) \(\newcommand{\evec}{\mathbf e}\) \(\newcommand{\fvec}{\mathbf f}\) \(\newcommand{\nvec}{\mathbf n}\) \(\newcommand{\pvec}{\mathbf p}\) \(\newcommand{\qvec}{\mathbf q}\) \(\newcommand{\svec}{\mathbf s}\) \(\newcommand{\tvec}{\mathbf t}\) \(\newcommand{\uvec}{\mathbf u}\) \(\newcommand{\vvec}{\mathbf v}\) \(\newcommand{\wvec}{\mathbf w}\) \(\newcommand{\xvec}{\mathbf x}\) \(\newcommand{\yvec}{\mathbf y}\) \(\newcommand{\zvec}{\mathbf z}\) \(\newcommand{\rvec}{\mathbf r}\) \(\newcommand{\mvec}{\mathbf m}\) \(\newcommand{\zerovec}{\mathbf 0}\) \(\newcommand{\onevec}{\mathbf 1}\) \(\newcommand{\real}{\mathbb R}\) \(\newcommand{\twovec}[2]{\left[\begin{array}{r}#1 \\ #2 \end{array}\right]}\) \(\newcommand{\ctwovec}[2]{\left[\begin{array}{c}#1 \\ #2 \end{array}\right]}\) \(\newcommand{\threevec}[3]{\left[\begin{array}{r}#1 \\ #2 \\ #3 \end{array}\right]}\) \(\newcommand{\cthreevec}[3]{\left[\begin{array}{c}#1 \\ #2 \\ #3 \end{array}\right]}\) \(\newcommand{\fourvec}[4]{\left[\begin{array}{r}#1 \\ #2 \\ #3 \\ #4 \end{array}\right]}\) \(\newcommand{\cfourvec}[4]{\left[\begin{array}{c}#1 \\ #2 \\ #3 \\ #4 \end{array}\right]}\) \(\newcommand{\fivevec}[5]{\left[\begin{array}{r}#1 \\ #2 \\ #3 \\ #4 \\ #5 \\ \end{array}\right]}\) \(\newcommand{\cfivevec}[5]{\left[\begin{array}{c}#1 \\ #2 \\ #3 \\ #4 \\ #5 \\ \end{array}\right]}\) \(\newcommand{\mattwo}[4]{\left[\begin{array}{rr}#1 \amp #2 \\ #3 \amp #4 \\ \end{array}\right]}\) \(\newcommand{\laspan}[1]{\text{Span}\{#1\}}\) \(\newcommand{\bcal}{\cal B}\) \(\newcommand{\ccal}{\cal C}\) \(\newcommand{\scal}{\cal S}\) \(\newcommand{\wcal}{\cal W}\) \(\newcommand{\ecal}{\cal E}\) \(\newcommand{\coords}[2]{\left\{#1\right\}_{#2}}\) \(\newcommand{\gray}[1]{\color{gray}{#1}}\) \(\newcommand{\lgray}[1]{\color{lightgray}{#1}}\) \(\newcommand{\rank}{\operatorname{rank}}\) \(\newcommand{\row}{\text{Row}}\) \(\newcommand{\col}{\text{Col}}\) \(\renewcommand{\row}{\text{Row}}\) \(\newcommand{\nul}{\text{Nul}}\) \(\newcommand{\var}{\text{Var}}\) \(\newcommand{\corr}{\text{corr}}\) \(\newcommand{\len}[1]{\left|#1\right|}\) \(\newcommand{\bbar}{\overline{\bvec}}\) \(\newcommand{\bhat}{\widehat{\bvec}}\) \(\newcommand{\bperp}{\bvec^\perp}\) \(\newcommand{\xhat}{\widehat{\xvec}}\) \(\newcommand{\vhat}{\widehat{\vvec}}\) \(\newcommand{\uhat}{\widehat{\uvec}}\) \(\newcommand{\what}{\widehat{\wvec}}\) \(\newcommand{\Sighat}{\widehat{\Sigma}}\) \(\newcommand{\lt}{<}\) \(\newcommand{\gt}{>}\) \(\newcommand{\amp}{&}\) \(\definecolor{fillinmathshade}{gray}{0.9}\)The Federal Tax System
Taxes will always need to be collected so they should meet certain requirements: they should be equitable, simple, and efficient. If these criteria are met, people will generally understand why they are being taxed and may be more receptive to the idea of the tax. There are, however, two principles that revolve around taxes. The first is that the benefit principle of taxation, which is that those who benefit from taxes should pay in proportion to the number of benefits that they receive. The second concept is the ability to pay principle, in which those that can bear the burden of taxes should pay more than those who cannot pay taxes.
Taxes are proportional, progressive, or regressive depending on the way in which the tax burden changes as income changes. The main source of revenue for the federal government is the individual income tax, while the second largest source is the FICA tax used to pay for Social Security and Medicare. Additional government revenues include excises taxes, gift taxes, customs duties, and user fees.
Universal Generalizations
- Taxes influence the economy by affecting resource allocation, consumer behavior, and the nation’s productivity and growth.
- The federal government raises revenue from a variety of taxes.
- Government economic policies at all levels influence levels of employment, output, and price levels.
Guiding Questions
- How do government policies of taxing and spending affect the economy at the national level?
- What are the positive and negative aspects of taxation?
- How do taxes contribute to government spending?
Video: Tax Day 2016
Source: National Priorities. https://www.nationalpriorities.org/budget-basics/webinars/tax-day2016-do-you-know-where-your-tax-dollar-went/
Figure 1: 1040 EZ Easy Tax Form

Every year, in the middle of April, U.S. citizens and residents are required to file an income tax form. The preceding figure shows the 1040EZ tax form, which is the simplest of all these tax forms. For the majority of us, this is one of the most direct pieces of contact that we have with the government. Based on the declarations we file, we are required to pay taxes on the income we have earned over the year. These tax revenues are used to finance a wide variety of government purchases of goods and services and transfers to households and firms. Of course, income taxes are not unique to the United States; most other countries require their residents to complete a similar kind of form.
From the perspective of a household or a firm, the tax form is a statement of financial responsibility. From the viewpoint of the government, the 1040 tax form is an instrument of fiscal policy. The 1040 form is based on the U.S. tax code. Changes in that code can have profound effects on the economy—both in the short-run and in the long-run.
In this chapter, we study the various ways in which income taxes affect the economy. An understanding of taxes is critical for policymakers who devise tax policies and for voters who elect them. Tax policies are often controversial, in large part because they affect the economy in several different ways. For example, in the 2004 and 2008 U.S. presidential campaigns, one of the most contentious economic policy issues was an income tax cut that President George W. Bush had initiated in his first term and that the Republican Party wished to make permanent. That issue returned to the forefront of political discussion in 2010, when these tax cuts were renewed.
Politicians have argued about such matters since the country was founded. Should the government ensure it has enough tax revenue to balance its budget? How should we raise the revenues to pay for our government programs? What is the appropriate tax on the income received by individuals and corporations? Fiscal policy questions like these are debated in the United States and other countries throughout the world. They are tough questions for politicians and economists alike.
Politicians focus largely on who wins and loses—which groups will bear the burden of taxes and receive the benefits of government spending and transfers? They do so for political reasons and because one goal of a tax system is to redistribute income. Economists emphasize something rather different. Economists know that taxes are necessary to finance government expenditures. At the same time, they know that taxes can have the negative effect of distorting people’s decisions and lead to inefficiency. Hence economists focus on designing a tax system that achieves its goals of raising revenue and redistributing income, without distorting the decisions of individuals and firms too much.
In addition, macroeconomists have observed that taxes significantly affect overall economic performance, as measured by variables such as real gross domestic product (real GDP) growth or the unemployment rate. The government can use changes in taxes as a means of influencing aggregate spending in the economy. In the United States, the federal government has often changed income taxes to affect overall economic performance. In this chapter, we examine two examples: the tax policies of the Kennedy administration of 1960–63 and the Reagan administration of 1980–88.
Our discussion of the Kennedy tax cut experience highlights the way in which variations in income taxes are used to help stabilize the macroeconomy. We use the Reagan tax cuts of the early 1980s to explore the growth implications of income taxes, which are often called “supply-side effects.”
Road Map
Our approach to understanding the effects of income taxes on the economy is summarized in Figure 2:
- Taxes affect consumption and hence aggregate expenditure and output.
- Taxes affect saving and hence the capital stock and output.
- Taxes affect labor supply and hence output.
Figure 2: Macroeconomic Effects of Tax Policy
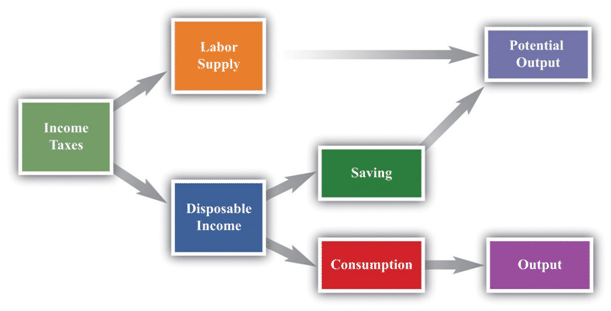
Any change in the income tax regime affects both the spending and the supply sides of the economy. Our reason for thinking separately about the Kennedy and Reagan tax experiments is to isolate the spending effects and the supply effects. Once you understand these different channels, you will be equipped to evaluate other tax policies, such as those adopted later by President George W. Bush. Finally, the figure reveals that the choice between consumption and saving and the choice between work and leisure are at the heart of our analysis.
http://2012books.lardbucket.org/books/theory-and-applications-of-economics/s31-00-income-taxes.html
Basic Concepts of Taxation
Before delving into the details of President Kennedy’s tax policy, we review the basics of personal income taxation. This review is not only helpful for your study of economics, but also may be useful when you have to fill out your own income tax form. Even a quick glance at the 1040EZ form in Figure 1 suggests that taxes are a very complex topic. Indeed, the US federal tax code governing income taxes alone runs to thousands of pages. The taxes that you pay depend on your adjusted gross income (line 4), which is the income you receive from a variety of sources (the main components noted on the return are wages, interest income, and unemployment compensation). There is also a “standard deduction” and an “exemption” (line 5)—for a single person in 2010, these totaled $9,350. For the EZ form, your taxable income is given as the following:
taxable income = adjusted gross income − (deduction + exemption).
If your financial situation is very simple, you can file this EZ form. However, if you receive income from other sources (such as dividends on stocks), or if you wish to “itemize” your deductions (for payments of interest on home mortgages, dependent children, property taxes, and so forth), you have to file a more complicated form, often with several other forms containing supplementary information. Thus the calculation of adjusted gross income and deductions can be quite complex. For all individuals, however, the basic relationship still holds:
taxable income = adjusted gross income − (deductions and exemptions).
Once you know your taxable income, there are then different tax rates for different income levels. Even this is not quite the whole story. There are various tax credits for which some individuals are eligible, and there is also something called the alternative minimum tax, which must be calculated.
Marginal and Average Tax Rates
From the perspective of macroeconomics, this complexity is daunting, particularly when we remember that the details of the tax system vary from country to country and year to year. The income tax is evidently not a simple thing that can be incorporated in a straightforward way into our frameworks. We cannot hope to incorporate all these features of the tax code into our theory without getting completely bogged down in the details. If we are going to make sense of how taxes affect consumption behavior, we must leave out most of these complicating elements. The challenge for economists is to decide which features of the tax system are critical for our analysis and which are peripheral and can be safely ignored.

One noteworthy feature of the income tax system is that not everyone pays the same amount of tax. Table 1 shows the income tax schedule for the year 2010 for a single taxpayer. There are other schedules for members of a household filing jointly. These and related tables are available from “Forms and Publications,” Internal Revenue Service, accessed September 20, 2011, http://www.irs.gov/formspubs/index.html. It indicates how much tax a must be paid for a given level of taxable income.
| If Taxable Income | The Tax Is Then | |||
| Is Over (in US$) | But Not Over (in US$) | This Amount (in US$) | Plus This (%) | Of the Excess Over (in US$) |
| 0 | 8,375 | 0 | 10 | 0 |
| 8,375 | 34,000 | 837.50 | 15 | 8,375 |
| 34,000 | 82.400 | 4,681.25 | 25 | 34,000 |
| 82.400 | 171,850 | 16,781.25 | 28 | 82.400 |
| 171,850 | 373,650 | 41,827.25 | 33 | 171,850 |
| 373,650 | — | 108,421.25 | 35 | 373,650 |
To use this table, you must first find your taxable income. Suppose it is $20,000. Your tax is then determined from the second row of the table. You would owe 837.50 + 0.15 × (20,000 − 8,375), which is $2,581.25. Figure 3 shows the relationship between taxes and income implicit in the tax schedule summarized in Table 1.
This figure shows the amount of tax you must pay given your adjusted gross income (upper panel) and your taxable income (lower panel). We see two key facts:
As an individual’s income increases, he or she pays more in tax (the line slopes upward).
As an individual’s income increases, he or she pays a larger fraction of additional income in tax (the line becomes steeper at higher levels of income).
This leads us to two ways to think about the tax schedule a household faces.
Figure 4: Amount of Tax Owed by Individuals
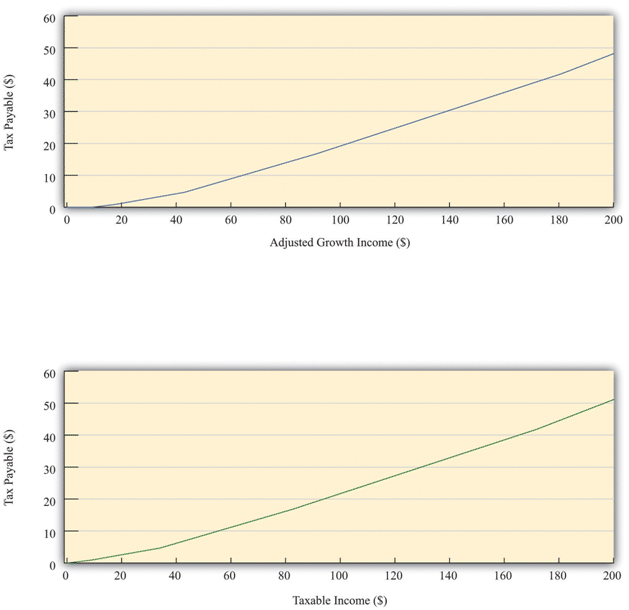
The figure shows the amount of tax owed by a single individual in the United States who takes the “standard deduction.” The upper panel has adjusted gross income on the horizontal axis, whereas the lower panel has taxable income on the horizontal axis.
As shown in Table 1, there were six different tax rates in effect in 2010, ranging from 10 percent for low-income individuals to 35 percent for high-income individuals. The tax rates in the fourth column are the marginal tax rates since they represent the tax rate paid on marginal (that is, additional) income. Thus higher income households pay higher marginal tax rates. The marginal tax rate can be seen graphically as the slope of the line in Figure 4.
We are often interested in knowing what fraction of an individual’s income goes to taxes. This is called the average tax rate. Returning to the example we calculated earlier, if you have an income of $20,000 and thus pay taxes of $2,581.25, your average tax rate is equal to 2,581.2520,000=0.129, or 12.9 percent. The marginal tax rate of 15 percent is greater than the average tax rate of 12.9 percent. There is a difference between the tax you pay on average and the tax rate charged on the last dollar of income. The average tax rate can also be given a graphical interpretation. It is the slope of a line from the origin to the point on the graph.
Leaving aside the details of exemptions and deductions, the essence of the income tax code is captured in the table and figures we have just presented. Even these, however, are quite complicated. We want to build income taxes into our framework of the economy, so it would be nice if we could decide on a simpler way to represent the tax code. The art of economics lies in deciding how to take something complicated, like the U.S. income tax code, and represent it in as simple a way as possible while still retaining the features that matter to the problem under discussion.
Looking at Figure 4, we can see that the relationship between taxes paid and taxable income looks approximately like a straight line. It is not exactly a straight line because it becomes steeper as marginal tax rates increase. For our purposes in this chapter, however, it is a reasonable simplification to represent this relationship as a line—that is, to suppose that the marginal tax rate is constant.
In addition, we ignore the standard deduction and exemption. That is, we suppose that people start paying taxes on their very first dollar of income. Thus we suppose that
taxes paid = tax rate × income.
Representing the tax schedule this way is fine if we want to examine the economy as a whole and are not particularly concerned with the way in which taxes affect different households. We use this simplified model of the tax system at various times in this chapter.
Effects of Changes in Tax Rates
We can use this simple model of the tax system to see how a change in the income tax rate affects both individuals and the economy as a whole. Suppose there is a cut in the tax rate. Since taxes paid = tax rate × income, the immediate impact is to reduce the amount of taxes households pay: for a given income, a reduction in the tax rate reduces taxes paid. This means that disposable income, which is the income left over after paying taxes and receiving transfers, increases.
What do households do with the increase in disposable income? A likely answer is that a typical household spends some of this extra income and saves the remainder. If all households follow this pattern, then the increased spending by each household translates into larger consumption in the aggregate economy. At this point, the power of the circular flow of income will take over, and the level of income and output in the economy will increase even further.
As the economy expands, the amount of taxes paid starts to increase. In other words, one consequence of a tax cut is that the tax base (income) expands. The ultimate effect of a tax cut on the overall amount of taxes paid depends on both this expansion of the tax base (income) and the reduction of the tax rate.
Taxes and Income Distribution
The effects of a tax cut are not the same for everyone. Changes in the tax code effect the distribution of income. If we want to understand such effects, however, it is a mistake to use our simple model of the tax system. We must instead examine how marginal tax rates are different at different levels of income. Suppose that marginal tax rates increase with income, which means that average tax rates increase with income. Higher income households then pay a larger fraction of their income as taxes to the government. As a result, the distribution of income after taxes is more equal than the distribution of income before taxes.
Imagine that we take two individuals with different levels of income and calculate their tax payments and after-tax income. Suppose that the first individual earns $20,000 per year and the other earns $200,000. Table 2 shows the amount of tax each pays and their income after taxes, based on the tax schedule from Table 1. Notice from the table that the marginal tax of the high-income household is 33 percent, compared with the 15 percent marginal tax of the low-income household. The total tax paid by the high-income individual is $51,116.75, which is almost 20 times the tax paid by the low-income household. Whereas the pre-tax income of the richer household was 10 times greater than that of the poorer household, its after-tax income is 8.5 times greater.
| Income | Tax Paid | Income after Taxes |
| 20,000 | 2,581.25 | 17,418.75 |
| 200,000 | 51,116.75 | 148,883.25 |
This example shows that the tax code redistributes income from high-income to low-income households. Furthermore, the redistribution does not necessarily stop here. We have not said anything about what the government does with the tax revenues it receives. If the government transfers all those revenues to low-income households, then the combined redistributive effect of taxes and transfers is even stronger.
When we talk about the effects of taxes on labor supply and disposable income, keep in mind that the size of these effects is different for households at different levels of income. These varying effects matter for the politics of tax cuts because lawmakers pay close attention to which income groups are affected by tax policy.
Taxation
There are two main categories of taxes: those collected by the federal government and those collected by state and local governments. What percentage is collected and what that revenue is used for varies greatly. The following sections will briefly explain the taxation system in the United States.
Federal Taxes
Just as many Americans erroneously think that federal spending has grown considerably, many also believe that taxes have increased substantially. The top line of Figure 5 shows total federal taxes as a share of GDP since 1960. Although the line rises and falls, it typically remains within the range of 17% to 20% of GDP, except for 2009, when taxes fell substantially below this level, due to a recession.
Figure 5: Federal Taxes, 1960–2012
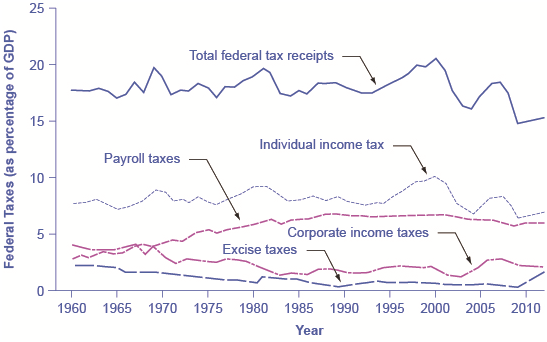
Federal tax revenues have been about 17–20% of GDP during most periods in recent decades. The primary sources of federal taxes are individual income taxes and the payroll taxes that finance Social Security and Medicare. Corporate income taxes, excise taxes, and other taxes provide smaller shares of revenue. (Source: Economic Report of the President, Tables B-81 and B-1)
Figure 5 also shows the patterns of taxation for the main categories of taxes levied by the federal government: personal income taxes, payroll taxes, corporate income taxes, and excise taxes. When most people think of taxes levied by the federal government, the first tax that comes to mind is the individual income tax that is due every year on April 15 (or the first business day after). The personal income tax is the largest single source of federal government revenue, but it still represents less than half of federal tax revenue.
The second largest source of federal revenue is the payroll tax, which provides funds for Social Security and Medicare. Payroll taxes have increased steadily over time. Together, the personal income tax and the payroll tax accounted for about 84% of federal tax revenues in 2012. Although personal income tax revenues account for more total revenue than the payroll tax, nearly three-quarters of households pay more in payroll taxes than in income taxes.
The income tax is a progressive tax, which means that the tax rates increase as a household’s income increases. Taxes also vary with marital status, family size, and other factors. The marginal tax rates (the tax that must be paid on all yearly income) for a single taxpayer range from 10% to 35%, depending on income, as the following Clear It Up feature explains.
How does the Marginal Rate Work?
Suppose that a single taxpayer’s income is $35,000 per year. Also suppose that income from $0 to $9,075 is taxed at 10%, income from $9,075 to $36,900 is taxed at 15%, and, finally, income from $36,900 and beyond is taxed at 25%. Since this person earns $35,000, their marginal tax rate is 15%.
The key fact here is that the federal income tax is designed so tax rates increase up to a certain level as income increases. The payroll taxes that support Social Security and Medicare are designed in a different way. First, the payroll taxes for Social Security are imposed at a rate of 12.4% up to a certain wage limit, set at $117,900 in 2014. Medicare, on the other hand, pays for elderly healthcare and is fixed at 2.9%, with no upper ceiling.
In both cases, the employer and the employee split the payroll taxes. An employee only sees 6.2% deducted from his paycheck for Social Security, and 1.45% from Medicare. However, as economists are quick to point out, the employer’s half of the taxes are probably passed along to the employees in the form of lower wages, so in reality, the worker pays all of the payroll taxes.
The Medicare payroll tax is also called a proportional tax; that is, a flat percentage of all wages earned. The Social Security payroll tax is proportional up to the wage limit, but above that level it becomes a regressive tax, meaning that people with higher incomes pay a smaller share of their income in tax.
The third-largest source of federal tax revenue, as shown in Figure 5 is the corporate income tax. The common name for corporate income is “profits.” Over time, corporate income tax receipts have declined as a share of GDP, from about 4% in the 1960s to an average of 1% to 2% of GDP in the first decade of the 2000s.
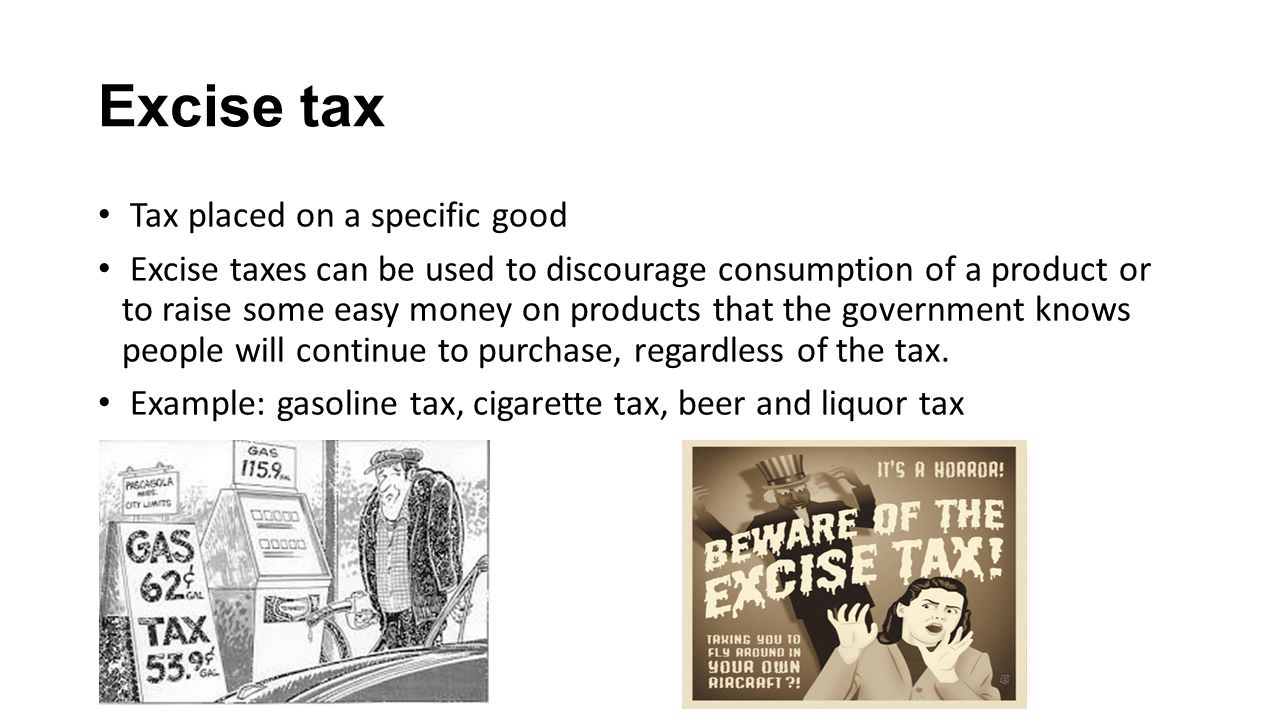
The federal government has a few other, smaller sources of revenue. It imposes an excise tax—that is, a tax on a particular good—on gasoline, tobacco, and alcohol. As a share of GDP, the amount collected by these taxes has stayed nearly constant over time, from about 2% of GDP in the 1960s to roughly 3% by 2012, according to the nonpartisan Congressional Budget Office. The government also imposes an estate and gift tax on people who pass large amounts of assets to the next generation—either after death or during life in the form of gifts. These estate and gift taxes collected about 0.2% of GDP in the first decade of the 2000s. By a quirk of legislation, the estate and gift tax was repealed in 2010, but reinstated in 2011. Other federal taxes, which are also relatively small in magnitude, include tariffs collected on imported goods and charges for inspections of goods entering the country.
The two main federal taxes are individual income taxes and payroll taxes that provide funds for Social Security and Medicare; these taxes together account for more than 80% of federal revenues. Other federal taxes include the corporate income tax, excise taxes on alcohol, gasoline and tobacco, and the estate and gift tax. A progressive tax is one, like the federal income tax, where those with higher incomes pay a higher share of taxes out of their income than those with lower incomes. A proportional tax is one, like the payroll tax for Medicare, where everyone pays the same share of taxes regardless of income level. A regressive tax is one, like the payroll tax (above a certain threshold) that supports Social Security, where those with high income pay a lower share of income in taxes than those with lower incomes.
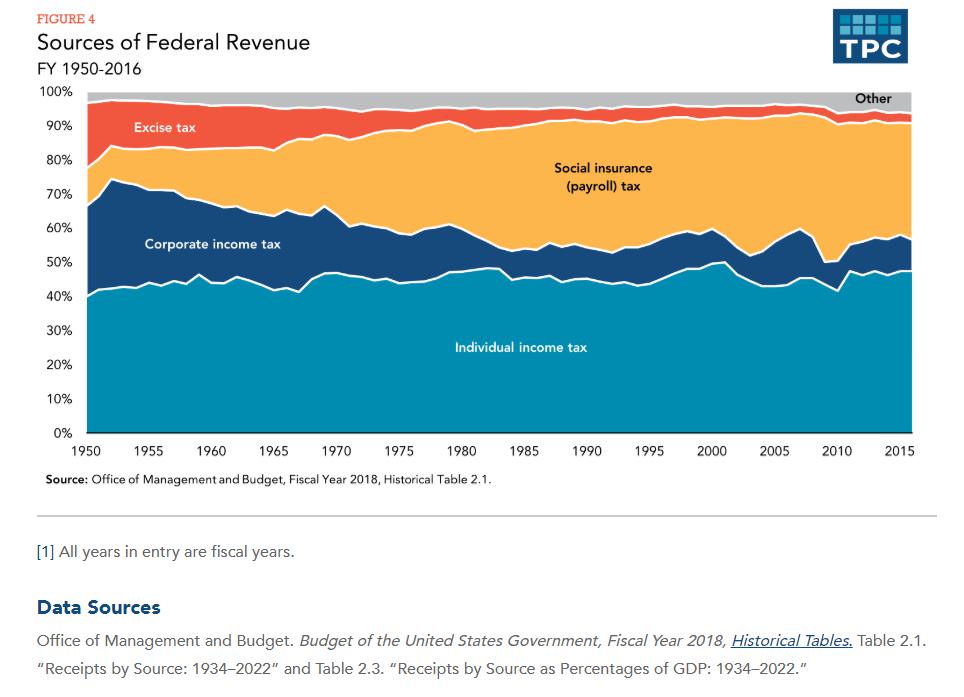
Sources of Federal Revenue
"Government revenue amounted to $1.3 trillion in the mid-1980s, and then breached $2 trillion in 1992 just after the recession of 1990-91. In the 1990s revenue increases accelerated, reaching $3.2 trillion in 1998 and reaching a peak of $3.7 trillion in 2000. But in the 2000s, with the dot-com crash and 9/11, government revenue declined hitting $3.3 trillion in 2002 before resuming its increase again. Revenue reached above $4 trillion in 2005 and $5 trillion in 2007. Then came the Crash of 2008 and government revenue nose-dived down to $3.6 trillion in 2009. After a few years of catch-up, revenue is expected to hit $6 trillion in 2015." ( retrieved from http://www.usgovernmentrevenue.com/recent_revenue)
Corporate Income Taxes
Companies that are corporations must pay income taxes on profits earned during the year. Corporate income taxes are considered the third largest category of taxes that the federal government collects. Because a corporation is considered a separate legal entity, they pay taxes based on the amount of profits the company earned. Currently, there are several corporate tax brackets.
| Taxable Income ($) | Tax Rate |
| 0 to 50,000 | 15% |
| 50,000 to 75,000 | $7,500 + 25% Of the amount over 50,000 |
| 75,000 to 100,000 | $13,750 + 34% Of the amount over 75,000 |
| 100,000 to 335,000 | $22,250 + 39% Of the amount over 100,000 |
| 335,000 to 10,000,000 | $113,900 + 34% Of the amount over 335,000 |
| 10,000,000 to 15,000,000 | $3,400,000 + 35% Of the amount over 10,000,000 |
| 15,000,000 to 18,333,333 | $5,150,000 + 38% Of the amount over 15,000,000 |
| 18,333,333 and up | 35% |
This rate structure produces a flat 34% tax rate on incomes from $335,000 to $10,000,000, gradually increasing to a flat rate of 35% on incomes above $18,333,333. retrieved from www.taxpolicycenter.org/taxfacts/Content/PDF/corporate_rates.pdf
Other Federal Taxes
An excise tax is a tax on the manufacture or sale of certain items such as gasoline and liquor. The U.S. Constitution has permitted excise taxes since its ratification. Taxes are found various everyday items such as:
 Excise Tax Examples
The excise tax is considered to be "regressive" because lower income families tend to spend larger portions of their income on these types of goods, and therefore find it to be more of a burden than families with higher incomes. Congress enacted and then retreated on the 1991 excise tax, also known as a "luxury tax". The tax was unpopular and did not raise the revenues the Congress projected so it was phased out in 2002. To read more about this, visit the website --- http://www.wsj.com/articles/SB1041807729976794664
Another example of a federal tax is the estate tax. This tax is one that is placed on a transfer of property when a person dies. Estates that are worth less than the state maximum, does not require the person inheriting the property to pay a tax. In addition, a gift tax is a tax on donations of money or wealth from one person to another. This tax is to be paid by the person giving the gift of money. The reason this tax was instituted was to prevent wealthy people from avoiding taxes by giving away their wealth or estates before their deaths. Of all the current taxes, the estate and gift tax are the smallest percentage collected by the government Customs duties are a federal tax paid by people or companies that bring in goods from another country. The US Constitution gives Congress the ability to decide which foreign products to tax and how much the tax will be on those products. While the taxes range from very low to 50%, they are today a very small percentage of taxes compared to one hundred years ago. Miscellaneous fees, or user fees, are charged for the use of a good such as the national parks. Beginning during the Regan administration Congress used these fees to raise a fairly large amount of revenue. The term "user fees" was instituted so that park users would not associate it with a "tax".
Video: Calculating Federal Taxes and Take Home Pay
Key Takeaways
The marginal tax rate is the rate paid on an additional dollar of income, and the average tax rate is the ratio of taxes paid to income.
When the marginal tax rate is increasing in income, then the tax system redistributes from richer households to poorer households. In this case, after-tax income is more equal than income before taxes are paid.
 Answer the self check questions below to monitor your understanding of the concepts in this section.
Self Check Questions
- What is the 16th Amendment?
- Why does the federal government levy a tax?
- What is the payroll withholding system?
- Explain the concept of a "tax return."
- What is FICA?
- What is a corporate income tax?
- List other federal taxes.