
2.13 Graphs of Rational Functions by Hand
- Page ID
- 13718
\( \newcommand{\vecs}[1]{\overset { \scriptstyle \rightharpoonup} {\mathbf{#1}} } \)
\( \newcommand{\vecd}[1]{\overset{-\!-\!\rightharpoonup}{\vphantom{a}\smash {#1}}} \)
\( \newcommand{\id}{\mathrm{id}}\) \( \newcommand{\Span}{\mathrm{span}}\)
( \newcommand{\kernel}{\mathrm{null}\,}\) \( \newcommand{\range}{\mathrm{range}\,}\)
\( \newcommand{\RealPart}{\mathrm{Re}}\) \( \newcommand{\ImaginaryPart}{\mathrm{Im}}\)
\( \newcommand{\Argument}{\mathrm{Arg}}\) \( \newcommand{\norm}[1]{\| #1 \|}\)
\( \newcommand{\inner}[2]{\langle #1, #2 \rangle}\)
\( \newcommand{\Span}{\mathrm{span}}\)
\( \newcommand{\id}{\mathrm{id}}\)
\( \newcommand{\Span}{\mathrm{span}}\)
\( \newcommand{\kernel}{\mathrm{null}\,}\)
\( \newcommand{\range}{\mathrm{range}\,}\)
\( \newcommand{\RealPart}{\mathrm{Re}}\)
\( \newcommand{\ImaginaryPart}{\mathrm{Im}}\)
\( \newcommand{\Argument}{\mathrm{Arg}}\)
\( \newcommand{\norm}[1]{\| #1 \|}\)
\( \newcommand{\inner}[2]{\langle #1, #2 \rangle}\)
\( \newcommand{\Span}{\mathrm{span}}\) \( \newcommand{\AA}{\unicode[.8,0]{x212B}}\)
\( \newcommand{\vectorA}[1]{\vec{#1}} % arrow\)
\( \newcommand{\vectorAt}[1]{\vec{\text{#1}}} % arrow\)
\( \newcommand{\vectorB}[1]{\overset { \scriptstyle \rightharpoonup} {\mathbf{#1}} } \)
\( \newcommand{\vectorC}[1]{\textbf{#1}} \)
\( \newcommand{\vectorD}[1]{\overrightarrow{#1}} \)
\( \newcommand{\vectorDt}[1]{\overrightarrow{\text{#1}}} \)
\( \newcommand{\vectE}[1]{\overset{-\!-\!\rightharpoonup}{\vphantom{a}\smash{\mathbf {#1}}}} \)
\( \newcommand{\vecs}[1]{\overset { \scriptstyle \rightharpoonup} {\mathbf{#1}} } \)
\( \newcommand{\vecd}[1]{\overset{-\!-\!\rightharpoonup}{\vphantom{a}\smash {#1}}} \)
\(\newcommand{\avec}{\mathbf a}\) \(\newcommand{\bvec}{\mathbf b}\) \(\newcommand{\cvec}{\mathbf c}\) \(\newcommand{\dvec}{\mathbf d}\) \(\newcommand{\dtil}{\widetilde{\mathbf d}}\) \(\newcommand{\evec}{\mathbf e}\) \(\newcommand{\fvec}{\mathbf f}\) \(\newcommand{\nvec}{\mathbf n}\) \(\newcommand{\pvec}{\mathbf p}\) \(\newcommand{\qvec}{\mathbf q}\) \(\newcommand{\svec}{\mathbf s}\) \(\newcommand{\tvec}{\mathbf t}\) \(\newcommand{\uvec}{\mathbf u}\) \(\newcommand{\vvec}{\mathbf v}\) \(\newcommand{\wvec}{\mathbf w}\) \(\newcommand{\xvec}{\mathbf x}\) \(\newcommand{\yvec}{\mathbf y}\) \(\newcommand{\zvec}{\mathbf z}\) \(\newcommand{\rvec}{\mathbf r}\) \(\newcommand{\mvec}{\mathbf m}\) \(\newcommand{\zerovec}{\mathbf 0}\) \(\newcommand{\onevec}{\mathbf 1}\) \(\newcommand{\real}{\mathbb R}\) \(\newcommand{\twovec}[2]{\left[\begin{array}{r}#1 \\ #2 \end{array}\right]}\) \(\newcommand{\ctwovec}[2]{\left[\begin{array}{c}#1 \\ #2 \end{array}\right]}\) \(\newcommand{\threevec}[3]{\left[\begin{array}{r}#1 \\ #2 \\ #3 \end{array}\right]}\) \(\newcommand{\cthreevec}[3]{\left[\begin{array}{c}#1 \\ #2 \\ #3 \end{array}\right]}\) \(\newcommand{\fourvec}[4]{\left[\begin{array}{r}#1 \\ #2 \\ #3 \\ #4 \end{array}\right]}\) \(\newcommand{\cfourvec}[4]{\left[\begin{array}{c}#1 \\ #2 \\ #3 \\ #4 \end{array}\right]}\) \(\newcommand{\fivevec}[5]{\left[\begin{array}{r}#1 \\ #2 \\ #3 \\ #4 \\ #5 \\ \end{array}\right]}\) \(\newcommand{\cfivevec}[5]{\left[\begin{array}{c}#1 \\ #2 \\ #3 \\ #4 \\ #5 \\ \end{array}\right]}\) \(\newcommand{\mattwo}[4]{\left[\begin{array}{rr}#1 \amp #2 \\ #3 \amp #4 \\ \end{array}\right]}\) \(\newcommand{\laspan}[1]{\text{Span}\{#1\}}\) \(\newcommand{\bcal}{\cal B}\) \(\newcommand{\ccal}{\cal C}\) \(\newcommand{\scal}{\cal S}\) \(\newcommand{\wcal}{\cal W}\) \(\newcommand{\ecal}{\cal E}\) \(\newcommand{\coords}[2]{\left\{#1\right\}_{#2}}\) \(\newcommand{\gray}[1]{\color{gray}{#1}}\) \(\newcommand{\lgray}[1]{\color{lightgray}{#1}}\) \(\newcommand{\rank}{\operatorname{rank}}\) \(\newcommand{\row}{\text{Row}}\) \(\newcommand{\col}{\text{Col}}\) \(\renewcommand{\row}{\text{Row}}\) \(\newcommand{\nul}{\text{Nul}}\) \(\newcommand{\var}{\text{Var}}\) \(\newcommand{\corr}{\text{corr}}\) \(\newcommand{\len}[1]{\left|#1\right|}\) \(\newcommand{\bbar}{\overline{\bvec}}\) \(\newcommand{\bhat}{\widehat{\bvec}}\) \(\newcommand{\bperp}{\bvec^\perp}\) \(\newcommand{\xhat}{\widehat{\xvec}}\) \(\newcommand{\vhat}{\widehat{\vvec}}\) \(\newcommand{\uhat}{\widehat{\uvec}}\) \(\newcommand{\what}{\widehat{\wvec}}\) \(\newcommand{\Sighat}{\widehat{\Sigma}}\) \(\newcommand{\lt}{<}\) \(\newcommand{\gt}{>}\) \(\newcommand{\amp}{&}\) \(\definecolor{fillinmathshade}{gray}{0.9}\)Sketching rational functions by hand is a mental workout because it combines so many different specific skills to produce a single coherent image. It will require you to closely examine the equation of the function in a variety of different ways in order to find clues as to the shape of the overall function. Since computers can graph these complicated functions much more accurately than people can, why is sketching by hand important?
Graphing Rational Functions
While there is no strict procedure for graphing rational functions by hand there is a flow of clues to look for in the function. In general, it will make sense to identify different pieces of information in this order and record them on a sketch.
Steps for Graphing Rational Functions By Hand
- Examine the denominator of the rational function to determine the domain of the function. Distinguish between holes which are factors that can be canceled and vertical asymptotes that cannot. Plot the vertical asymptotes.
- Identify the end behavior of the function by comparing the degrees of the numerator and denominator and determine if there exists a horizontal or oblique asymptote. Plot the horizontal or oblique asymptotes.
- Identify the holes of the function and plot them.
- Identify the zeroes and intercepts of the function and plot them.
- Use the sign test to determine the behavior of the function near the vertical asymptotes.
- Connect everything as best you can.
Now, apply those steps in graphing the following function:
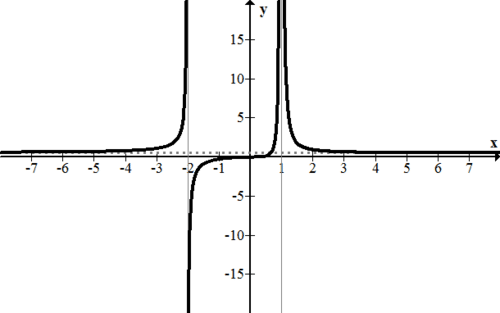
\(f(x)=\frac{4 x^{3}-2 x^{2}+3 x-1}{8(x-1)^{2}(x+2)}\)
After attempting to factor the numerator you may realize that both \(x=1\) and \(x=-2\) are vertical asymptotes rather than holes. The horizontal asymptote is \(y=\frac{1}{2} .\) There are no holes. The \(y\) intercept is:
\(f(0)=-\frac{1}{8 \cdot 2}=\frac{1}{16}\)
The numerator is not factorable, but there is a zero between 0 and 1. You know this because there are no holes or asymptotes between 0 and 1 and the function switches from negative to positive in this region.
\(4(0)^{3}-2(0)^{2}+3(0)-1=-1\)
\(4(1)^{3}-2(1)^{2}+3(1)-1=4\)
Putting all of this together in a sketch:
Examples
Earlier, you were asked why sketching graphs by hand is important. Computers can graph rational functions more accurately than people. However, computers may not be able to explain why a function behaves in certain ways. By being a detective and looking for clues in the equation of a function, you are applying high level analytical skills and powers of deduction. These analytical skills are vastly more important and transferable than the specific techniques involved with rational functions.
Completely plot the following rational function.
\(f(x)=\frac{(x-3)^{2}(x-2)^{3}(x-1)(x+2)}{300(x+1)^{2}(x-2) x}\)
since this function is already factored, much of the work is already done. There is a hole at (2,0) . There are two vertical asymptotes at \(x=-1,0\). There are no horizontal or oblique asymptotes because the degree of the numerator is much bigger than the degree of the denominator. As \(x\) gets large this function grows without bound. As \(x\) get very small, this function decreases without bound. The function has no \(y\) intercept because that is where a vertical asymptote is. Besides the hole at ( 2 , 0), there are zeroes at (-2,0),(1,0) and \((3,0) .\) This is what the graph ends up looking like.
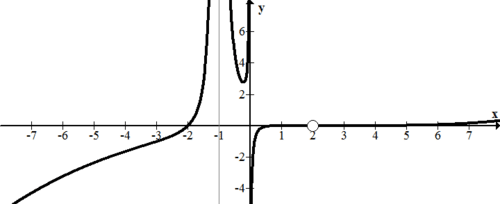
Notice on the right portion of the graph the curve seems to stay on the \(x\)-axis. In fact it does go slightly above and below \(x\)-axis, crossing through it at (1, 0), (2, 0) and (3, 0) before starting to increase.
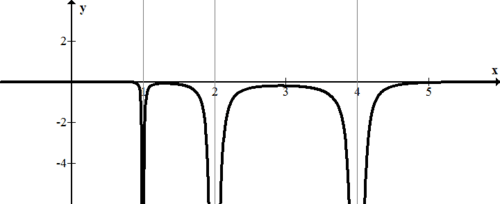
Estimate a function that would have the following graphical characteristics:
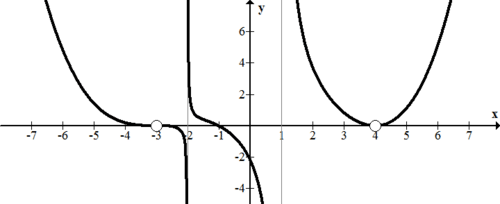
First think about the vertical asymptotes and how they affect the equation of the function. Then consider zeroes and holes, and the way the graph looks at these places. Finally, use the \(y\) -intercept to refine your equation.
- The function has two vertical asymptotes at \(x=-2,1\) so the denominator must have the factors \((x+2)(x-1)\)
- There is one zero at \(x=-1,\) so the numerator must have a factor of \((x+1)\)
- There are two holes that appear to override zeroes which means the numerator and denominator must have the factors \((x+3)\) and \((x-4)\)
- Because the graph goes from above the \(x\) -axis to below the \(x\) -axis at \(x=-3\), the degree of the exponent of the \((x+3)\) factor must be ultimately odd.
- Because the graph stays above the \(x\) -axis before and after \(x=4,\) the degree of the \((x-4)\) factor must be ultimately even.
A good estimate for the function is:
\(f(x)=\frac{(x+1)(x+3)^{4}(x-4)^{3}}{(x+2)(x-1)(x+3)(x-4)}\)
This function has all the basic characteristics, however it isn't scaled properly. When \(x=0\) this function has a \(y\) -intercept of -216 when it should be about \(-2 .\) Thus you must divide by 108 so that the \(y\) intercept matches. Here is a better estimate for the function:
\(f(x)=\frac{(x+1)(x+3)^{4}(x-4)^{3}}{108(x+2)(x-1)(x+3)(x-4)}\)
Graph the following rational function:
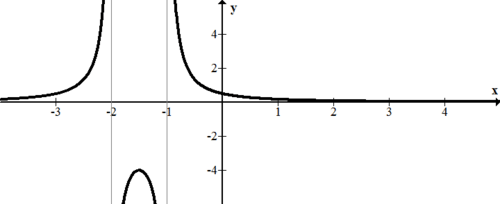
\(f(x)=\frac{1}{x^{2}+3 x+2}\)
Here is the graph:
Graph the following rational function:
\(f(x)=\frac{-x^{4}}{10(x-1)^{2}(x-2)^{2}(x-4)^{2}}\)
Here is the graph:
Review
Use the function below for 1-7.
\(f(x)=\frac{2(x+4)(x-3)(x+1)}{8(x-1)^{2}(x+2)}\)
1. Identify the vertical asymptotes and holes for the function.
2. What values will you use the sign test with in order to accurately sketch around the vertical asymptotes? Complete the sign test for these values.
3. Identify any horizontal or oblique asymptotes for the function.
4. Describe the end behavior of the function.
5. Find the zeroes of the function.
6. Find the \(y\) -intercept of the function.
7. Use the information from \(1-6\) to sketch the function.
Use the function below for \(8-14\).
\(g(x)=\frac{\left(x^{2}-9\right)\left(x^{2}-4\right)}{5(x-2)^{2}(x+1)^{2}}\)
8. Identify the vertical asymptotes and holes for the function.
9. What values will you use the sign test with in order to accurately sketch around the vertical asymptotes? Complete the sign test for these values.
10. Identify any horizontal or oblique asymptotes for the function.
11. Describe the end behavior of the function.
12. Find the zeroes of the function.
13. Find the \(y\) -intercept of the function.
14. Use the information from 8-13 to sketch the function.
15. Graph the function below by hand.
\(h(x)=\frac{x^{3}+5 x^{2}+2 x-8}{x^{2}-3 x-10}\)