
2.5.2: Bar Graphs, Frequency Tables, and Histograms
- Page ID
- 5762
\( \newcommand{\vecs}[1]{\overset { \scriptstyle \rightharpoonup} {\mathbf{#1}} } \)
\( \newcommand{\vecd}[1]{\overset{-\!-\!\rightharpoonup}{\vphantom{a}\smash {#1}}} \)
\( \newcommand{\id}{\mathrm{id}}\) \( \newcommand{\Span}{\mathrm{span}}\)
( \newcommand{\kernel}{\mathrm{null}\,}\) \( \newcommand{\range}{\mathrm{range}\,}\)
\( \newcommand{\RealPart}{\mathrm{Re}}\) \( \newcommand{\ImaginaryPart}{\mathrm{Im}}\)
\( \newcommand{\Argument}{\mathrm{Arg}}\) \( \newcommand{\norm}[1]{\| #1 \|}\)
\( \newcommand{\inner}[2]{\langle #1, #2 \rangle}\)
\( \newcommand{\Span}{\mathrm{span}}\)
\( \newcommand{\id}{\mathrm{id}}\)
\( \newcommand{\Span}{\mathrm{span}}\)
\( \newcommand{\kernel}{\mathrm{null}\,}\)
\( \newcommand{\range}{\mathrm{range}\,}\)
\( \newcommand{\RealPart}{\mathrm{Re}}\)
\( \newcommand{\ImaginaryPart}{\mathrm{Im}}\)
\( \newcommand{\Argument}{\mathrm{Arg}}\)
\( \newcommand{\norm}[1]{\| #1 \|}\)
\( \newcommand{\inner}[2]{\langle #1, #2 \rangle}\)
\( \newcommand{\Span}{\mathrm{span}}\) \( \newcommand{\AA}{\unicode[.8,0]{x212B}}\)
\( \newcommand{\vectorA}[1]{\vec{#1}} % arrow\)
\( \newcommand{\vectorAt}[1]{\vec{\text{#1}}} % arrow\)
\( \newcommand{\vectorB}[1]{\overset { \scriptstyle \rightharpoonup} {\mathbf{#1}} } \)
\( \newcommand{\vectorC}[1]{\textbf{#1}} \)
\( \newcommand{\vectorD}[1]{\overrightarrow{#1}} \)
\( \newcommand{\vectorDt}[1]{\overrightarrow{\text{#1}}} \)
\( \newcommand{\vectE}[1]{\overset{-\!-\!\rightharpoonup}{\vphantom{a}\smash{\mathbf {#1}}}} \)
\( \newcommand{\vecs}[1]{\overset { \scriptstyle \rightharpoonup} {\mathbf{#1}} } \)
\( \newcommand{\vecd}[1]{\overset{-\!-\!\rightharpoonup}{\vphantom{a}\smash {#1}}} \)
\(\newcommand{\avec}{\mathbf a}\) \(\newcommand{\bvec}{\mathbf b}\) \(\newcommand{\cvec}{\mathbf c}\) \(\newcommand{\dvec}{\mathbf d}\) \(\newcommand{\dtil}{\widetilde{\mathbf d}}\) \(\newcommand{\evec}{\mathbf e}\) \(\newcommand{\fvec}{\mathbf f}\) \(\newcommand{\nvec}{\mathbf n}\) \(\newcommand{\pvec}{\mathbf p}\) \(\newcommand{\qvec}{\mathbf q}\) \(\newcommand{\svec}{\mathbf s}\) \(\newcommand{\tvec}{\mathbf t}\) \(\newcommand{\uvec}{\mathbf u}\) \(\newcommand{\vvec}{\mathbf v}\) \(\newcommand{\wvec}{\mathbf w}\) \(\newcommand{\xvec}{\mathbf x}\) \(\newcommand{\yvec}{\mathbf y}\) \(\newcommand{\zvec}{\mathbf z}\) \(\newcommand{\rvec}{\mathbf r}\) \(\newcommand{\mvec}{\mathbf m}\) \(\newcommand{\zerovec}{\mathbf 0}\) \(\newcommand{\onevec}{\mathbf 1}\) \(\newcommand{\real}{\mathbb R}\) \(\newcommand{\twovec}[2]{\left[\begin{array}{r}#1 \\ #2 \end{array}\right]}\) \(\newcommand{\ctwovec}[2]{\left[\begin{array}{c}#1 \\ #2 \end{array}\right]}\) \(\newcommand{\threevec}[3]{\left[\begin{array}{r}#1 \\ #2 \\ #3 \end{array}\right]}\) \(\newcommand{\cthreevec}[3]{\left[\begin{array}{c}#1 \\ #2 \\ #3 \end{array}\right]}\) \(\newcommand{\fourvec}[4]{\left[\begin{array}{r}#1 \\ #2 \\ #3 \\ #4 \end{array}\right]}\) \(\newcommand{\cfourvec}[4]{\left[\begin{array}{c}#1 \\ #2 \\ #3 \\ #4 \end{array}\right]}\) \(\newcommand{\fivevec}[5]{\left[\begin{array}{r}#1 \\ #2 \\ #3 \\ #4 \\ #5 \\ \end{array}\right]}\) \(\newcommand{\cfivevec}[5]{\left[\begin{array}{c}#1 \\ #2 \\ #3 \\ #4 \\ #5 \\ \end{array}\right]}\) \(\newcommand{\mattwo}[4]{\left[\begin{array}{rr}#1 \amp #2 \\ #3 \amp #4 \\ \end{array}\right]}\) \(\newcommand{\laspan}[1]{\text{Span}\{#1\}}\) \(\newcommand{\bcal}{\cal B}\) \(\newcommand{\ccal}{\cal C}\) \(\newcommand{\scal}{\cal S}\) \(\newcommand{\wcal}{\cal W}\) \(\newcommand{\ecal}{\cal E}\) \(\newcommand{\coords}[2]{\left\{#1\right\}_{#2}}\) \(\newcommand{\gray}[1]{\color{gray}{#1}}\) \(\newcommand{\lgray}[1]{\color{lightgray}{#1}}\) \(\newcommand{\rank}{\operatorname{rank}}\) \(\newcommand{\row}{\text{Row}}\) \(\newcommand{\col}{\text{Col}}\) \(\renewcommand{\row}{\text{Row}}\) \(\newcommand{\nul}{\text{Nul}}\) \(\newcommand{\var}{\text{Var}}\) \(\newcommand{\corr}{\text{corr}}\) \(\newcommand{\len}[1]{\left|#1\right|}\) \(\newcommand{\bbar}{\overline{\bvec}}\) \(\newcommand{\bhat}{\widehat{\bvec}}\) \(\newcommand{\bperp}{\bvec^\perp}\) \(\newcommand{\xhat}{\widehat{\xvec}}\) \(\newcommand{\vhat}{\widehat{\vvec}}\) \(\newcommand{\uhat}{\widehat{\uvec}}\) \(\newcommand{\what}{\widehat{\wvec}}\) \(\newcommand{\Sighat}{\widehat{\Sigma}}\) \(\newcommand{\lt}{<}\) \(\newcommand{\gt}{>}\) \(\newcommand{\amp}{&}\) \(\definecolor{fillinmathshade}{gray}{0.9}\)Represent Real-World Problems Using Bar Graphs, Frequency Tables, and Histograms
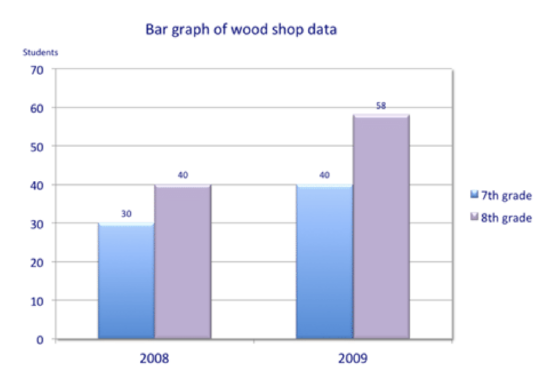
Andrei’s school has announced that they will be cancelling wood shop because not enough students are interested. Over the next few weeks, Andrei and his friends gathered data about wood shop. They learned that in 2008, there were 30 out of 100 seventh graders and 40 out of 100 eighth graders who had participated in wood shop. Then in 2009, the numbers had increased. There were 40 seventh graders and 58 eighth graders who had participated. Andrei and his friends believe the data suggests that wood shop is increasing in popularity and should not be cancelled. How can the students clearly show the information they have gathered on a chart?
In this concept, you will learn how to draw different types of graphs to display data.
Bar Graphs, Frequency Tables and Histograms
Real-world data can be easily and accurately represented by using bar graphs, frequency tables and histograms. Although the actual data values are lost when data is shown using one of the displays mentioned here, what the data represents is visual and clear to an observer.
The data table below depicts the ages of twenty of our nation’s presidents at the time of their Inauguration. Create a bar graph, frequency table, and histogram to display the data.
| President | Age |
| George Washington | 57 |
| John Adams | 61 |
| Thomas Jefferson | 57 |
| James Madison | 57 |
| James Monroe | 58 |
| Jon Quincy Adams | 57 |
| Andrew Jackson | 61 |
| Martin Van Buren | 54 |
| William Henry Harrison | 68 |
| John Tyler | 51 |
| Dwight D. Eisenhower | 62 |
| John F. Kennedy | 43 |
| Lyndon B. Johnson | 55 |
| Richard Nixon | 56 |
| Gerald Ford | 61 |
| Jimmy Carter | 52 |
| Ronald Regan | 69 |
| George W. Bush (1989 - 1993) | 64 |
| Bill Clinton | 46 |
| George W. Bush (2001 - 2008) | 50 |
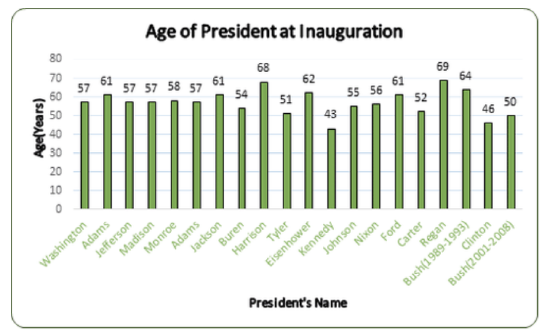
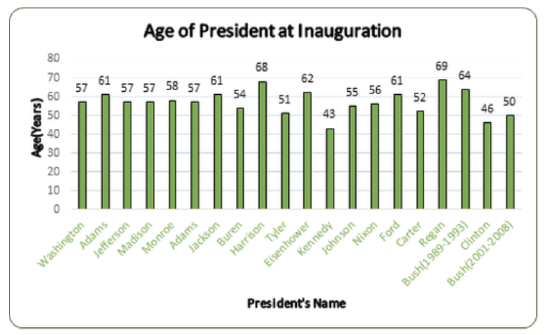
A bar graph consists of rectangular bars and a corresponding category. The above table of the ages can be used to create the bar graph.
To create the bar graph:
First, draw the horizontal (x) axis and the vertical (y) axis.
Next, label the horizontal axis (President’s Name) with their last names.
Next, label the vertical axis in increments of 10 with the Age (Years).
Next, draw a vertical column with a height corresponding to the president’s age above each of the names.
Then, enter the data value (age of the president) above each of the bars.
Your bar graph should display the information shown below:
Bob n Renee - https://www.flickr.com/photos/bobnrenee/93886281/in/photolist-9ic7Z-dKMNCw-9ic8Y-9ic8o-8prkC2-2EEWYK-8Q5Bki-8Q5URS-8Q1HBU-8PWmeF-8PZbcW-8Q6qnW-8QaSps-8Q7fxp-8Q9FmY-8Q6wfJ-8Q4xbN-8Q7KQg-8QaQBG-8QaPL9-8QaNK1-8Q7G9t-8QaLRL-8QaKVJ-8QaJco-8Q7BuR-8Q7ABP-8Q7zJ8-8Q7z1M-8QaDZW-8Q7xqX-8Q7wBT-8QaBvQ-8QazR9-8Q7tk2-8Qay8d-8Q7rD4-8QawqU-8Q7pFB-8QauFs-8Q7nV2-8Q7mZF-8Qas6d-8Q7kh8-8Qaqvs-8Q7iKr-8Q7hQR-8Qao2L-8QaniY-8QakCY;https://www.flickr.com/photos/bobnrenee/93886304/in/photolist-9ic8Y-9ic8o-8prkC2-2EEWYK-8Q5Bki-8Q5URS-8Q1HBU-8PWmeF-8PZbcW-8Q6qnW-8QaSps-8Q7fxp-8Q9FmY-8Q6wfJ-8Q4xbN-8Q7KQg-8QaQBG-8QaPL9-8QaNK1-8Q7G9t-8QaLRL-8QaKVJ-8QaJco-8Q7BuR-8Q7ABP-8Q7zJ8-8Q7z1M-8QaDZW-8Q7xqX-8Q7wBT-8QaBvQ-8QazR9-8Q7tk2-8Qay8d-8Q7rD4-8QawqU-8Q7pFB-8QauFs-8Q7nV2-8Q7mZF-8Qas6d-8Q7kh8-8Qaqvs-8Q7iKr-8Q7hQR-8Qao2L-8QaniY-8QakCY-8Q7dNp-8Qaj2d/
Now that you have created a bar graph, you can create a histogram to represent the data. To create a histogram the data must be displayed in a frequency table. Remember to include the three columns in your frequency table- Interval, Tally and Frequency.
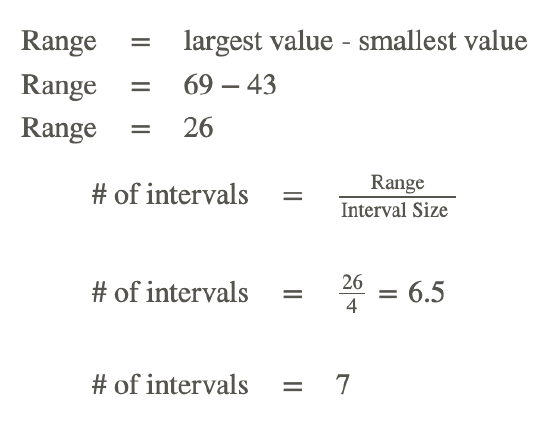
First, calculate the number of intervals you need for your table. Determine the range of the data by subtracting the smallest value from the largest value. Then divide the range by the interval size. For this table use an interval of size 4.
Next, draw and label the frequency table.
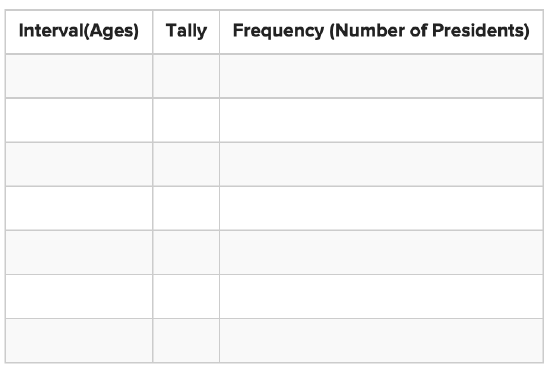
Next, fill in the table with the correct information.
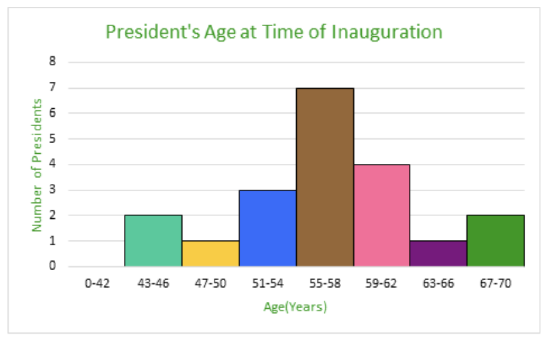
| Interval(Ages) | Tally | Frequency (Number of Presidents) |
| 0-42 | 0 | |
| 43-46 | || | 2 |
| 47-50 | | | 1 |
| 51-54 | ||| | 3 |
| 55-58 | 7 | |
| 59-62 | |||| | 4 |
| 63-66 | | | 1 |
| 67-70 | || | 2 |
Then, use the interval and frequency columns to draw the histogram.
First, draw a horizontal (x) and vertical (y) axis.
Next, label the horizontal axis with the intervals displayed on the frequency table.
Next, add a title to the horizontal axis.
Next, label the vertical axis by ones.
Next, add a title to the vertical axis.
Next, draw a vertical column to the appropriate value for each interval on the horizontal axis.
Then, add a title to the histogram.
Bob n Renee - https://www.flickr.com/photos/bobnrenee/93886281/in/photolist-9ic7Z-dKMNCw-9ic8Y-9ic8o-8prkC2-2EEWYK-8Q5Bki-8Q5URS-8Q1HBU-8PWmeF-8PZbcW-8Q6qnW-8QaSps-8Q7fxp-8Q9FmY-8Q6wfJ-8Q4xbN-8Q7KQg-8QaQBG-8QaPL9-8QaNK1-8Q7G9t-8QaLRL-8QaKVJ-8QaJco-8Q7BuR-8Q7ABP-8Q7zJ8-8Q7z1M-8QaDZW-8Q7xqX-8Q7wBT-8QaBvQ-8QazR9-8Q7tk2-8Qay8d-8Q7rD4-8QawqU-8Q7pFB-8QauFs-8Q7nV2-8Q7mZF-8Qas6d-8Q7kh8-8Qaqvs-8Q7iKr-8Q7hQR-8Qao2L-8QaniY-8QakCY;https://www.flickr.com/photos/bobnrenee/93886304/in/photolist-9ic8Y-9ic8o-8prkC2-2EEWYK-8Q5Bki-8Q5URS-8Q1HBU-8PWmeF-8PZbcW-8Q6qnW-8QaSps-8Q7fxp-8Q9FmY-8Q6wfJ-8Q4xbN-8Q7KQg-8QaQBG-8QaPL9-8QaNK1-8Q7G9t-8QaLRL-8QaKVJ-8QaJco-8Q7BuR-8Q7ABP-8Q7zJ8-8Q7z1M-8QaDZW-8Q7xqX-8Q7wBT-8QaBvQ-8QazR9-8Q7tk2-8Qay8d-8Q7rD4-8QawqU-8Q7pFB-8QauFs-8Q7nV2-8Q7mZF-8Qas6d-8Q7kh8-8Qaqvs-8Q7iKr-8Q7hQR-8Qao2L-8QaniY-8QakCY-8Q7dNp-8Qaj2d/
Displaying data using bar graphs, histograms and frequency tables can help us to understand information in a visual way. For people who are visual learners, a picture is worth a thousand words.
Now let’s practice interpreting a histogram to answer questions with respect to the histogram “Age of President at Inauguration.”
Bob n Renee - https://www.flickr.com/photos/bobnrenee/93886281/in/photolist-9ic7Z-dKMNCw-9ic8Y-9ic8o-8prkC2-2EEWYK-8Q5Bki-8Q5URS-8Q1HBU-8PWmeF-8PZbcW-8Q6qnW-8QaSps-8Q7fxp-8Q9FmY-8Q6wfJ-8Q4xbN-8Q7KQg-8QaQBG-8QaPL9-8QaNK1-8Q7G9t-8QaLRL-8QaKVJ-8QaJco-8Q7BuR-8Q7ABP-8Q7zJ8-8Q7z1M-8QaDZW-8Q7xqX-8Q7wBT-8QaBvQ-8QazR9-8Q7tk2-8Qay8d-8Q7rD4-8QawqU-8Q7pFB-8QauFs-8Q7nV2-8Q7mZF-8Qas6d-8Q7kh8-8Qaqvs-8Q7iKr-8Q7hQR-8Qao2L-8QaniY-8QakCY;https://www.flickr.com/photos/bobnrenee/93886304/in/photolist-9ic8Y-9ic8o-8prkC2-2EEWYK-8Q5Bki-8Q5URS-8Q1HBU-8PWmeF-8PZbcW-8Q6qnW-8QaSps-8Q7fxp-8Q9FmY-8Q6wfJ-8Q4xbN-8Q7KQg-8QaQBG-8QaPL9-8QaNK1-8Q7G9t-8QaLRL-8QaKVJ-8QaJco-8Q7BuR-8Q7ABP-8Q7zJ8-8Q7z1M-8QaDZW-8Q7xqX-8Q7wBT-8QaBvQ-8QazR9-8Q7tk2-8Qay8d-8Q7rD4-8QawqU-8Q7pFB-8QauFs-8Q7nV2-8Q7mZF-8Qas6d-8Q7kh8-8Qaqvs-8Q7iKr-8Q7hQR-8Qao2L-8QaniY-8QakCY-8Q7dNp-8Qaj2d/
How many of the presidents were sixty-one years of age or older at the time of Inauguration?
First, locate the age of each president displayed at the top of each vertical bar.
Next, record the data values that are greater than or equal to sixty-one.
61, 61, 68, 62, 61, 69, 64
Then, count the number of values you have recorded.
The answer is 7.
What was the most popular age for a president at the time of inauguration?
First, locate the age of each president displayed at the top of each vertical bar.
Next, record the data values that appear more than once.
57, 57, 57, 57, 61, 61, 61
Then, count the number of each value you have recorded.
The answer is 57.
What was the age of the youngest president? Who was it?
First, locate the age of each president displayed at the top of each vertical bar.
Next, find the shortest vertical bar displayed on the graph.
43
Then, record the number at the top of the bar.
The answer is 43.
Then, look below this vertical bar and record the last name of the president that corresponds with the shortest bar.
The answer is President Kennedy.
Examples
Example 1
Earlier, you were given a problem about the students trying to save wood shop.
Andrei and his friends need to clearly show the data they collected. In 2008, 30 out of 100 seventh graders and 40 out of 100 eighth graders participated in wood shop. In 2009, 40 out of 100 seventh graders and 58 out of 100 eighth graders participated.
First, draw the horizontal axis and the vertical axis.
Next, label the horizontal axis with the years 2008 and 2009.
Next, label the vertical axis with a scale to represent the number of students. Since there are 100 students in grade seven and 100 in grade eight use increments of 10 for your scale.
Next, label the bar graph with a suitable title that tells what the bar graph represents.
Next, include a legend with your bar graph showing the color of the bar for 7th grade and the color of the bar for 8th grade.
Then, draw the bar graph such that each year has two bars displayed above it.
Bob n Renee - https://www.flickr.com/photos/bobnrenee/93886281/in/photolist-9ic7Z-dKMNCw-9ic8Y-9ic8o-8prkC2-2EEWYK-8Q5Bki-8Q5URS-8Q1HBU-8PWmeF-8PZbcW-8Q6qnW-8QaSps-8Q7fxp-8Q9FmY-8Q6wfJ-8Q4xbN-8Q7KQg-8QaQBG-8QaPL9-8QaNK1-8Q7G9t-8QaLRL-8QaKVJ-8QaJco-8Q7BuR-8Q7ABP-8Q7zJ8-8Q7z1M-8QaDZW-8Q7xqX-8Q7wBT-8QaBvQ-8QazR9-8Q7tk2-8Qay8d-8Q7rD4-8QawqU-8Q7pFB-8QauFs-8Q7nV2-8Q7mZF-8Qas6d-8Q7kh8-8Qaqvs-8Q7iKr-8Q7hQR-8Qao2L-8QaniY-8QakCY;https://www.flickr.com/photos/bobnrenee/93886304/in/photolist-9ic8Y-9ic8o-8prkC2-2EEWYK-8Q5Bki-8Q5URS-8Q1HBU-8PWmeF-8PZbcW-8Q6qnW-8QaSps-8Q7fxp-8Q9FmY-8Q6wfJ-8Q4xbN-8Q7KQg-8QaQBG-8QaPL9-8QaNK1-8Q7G9t-8QaLRL-8QaKVJ-8QaJco-8Q7BuR-8Q7ABP-8Q7zJ8-8Q7z1M-8QaDZW-8Q7xqX-8Q7wBT-8QaBvQ-8QazR9-8Q7tk2-8Qay8d-8Q7rD4-8QawqU-8Q7pFB-8QauFs-8Q7nV2-8Q7mZF-8Qas6d-8Q7kh8-8Qaqvs-8Q7iKr-8Q7hQR-8Qao2L-8QaniY-8QakCY-8Q7dNp-8Qaj2d/
This bar graph will show the administration that the student interest in wood shop is increasing each year.
Example 2
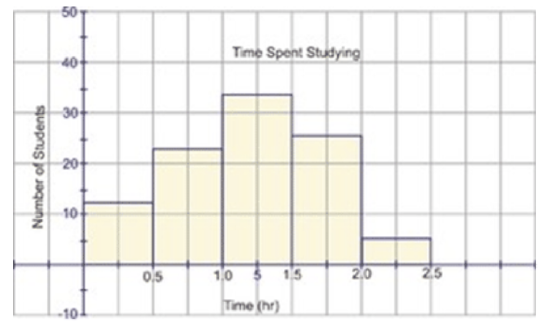
The following histogram shows the data obtained in a survey regarding the time in hours that students spend studying each day.

Bob n Renee - https://www.flickr.com/photos/bobnrenee/93886281/in/photolist-9ic7Z-dKMNCw-9ic8Y-9ic8o-8prkC2-2EEWYK-8Q5Bki-8Q5URS-8Q1HBU-8PWmeF-8PZbcW-8Q6qnW-8QaSps-8Q7fxp-8Q9FmY-8Q6wfJ-8Q4xbN-8Q7KQg-8QaQBG-8QaPL9-8QaNK1-8Q7G9t-8QaLRL-8QaKVJ-8QaJco-8Q7BuR-8Q7ABP-8Q7zJ8-8Q7z1M-8QaDZW-8Q7xqX-8Q7wBT-8QaBvQ-8QazR9-8Q7tk2-8Qay8d-8Q7rD4-8QawqU-8Q7pFB-8QauFs-8Q7nV2-8Q7mZF-8Qas6d-8Q7kh8-8Qaqvs-8Q7iKr-8Q7hQR-8Qao2L-8QaniY-8QakCY;https://www.flickr.com/photos/bobnrenee/93886304/in/photolist-9ic8Y-9ic8o-8prkC2-2EEWYK-8Q5Bki-8Q5URS-8Q1HBU-8PWmeF-8PZbcW-8Q6qnW-8QaSps-8Q7fxp-8Q9FmY-8Q6wfJ-8Q4xbN-8Q7KQg-8QaQBG-8QaPL9-8QaNK1-8Q7G9t-8QaLRL-8QaKVJ-8QaJco-8Q7BuR-8Q7ABP-8Q7zJ8-8Q7z1M-8QaDZW-8Q7xqX-8Q7wBT-8QaBvQ-8QazR9-8Q7tk2-8Qay8d-8Q7rD4-8QawqU-8Q7pFB-8QauFs-8Q7nV2-8Q7mZF-8Qas6d-8Q7kh8-8Qaqvs-8Q7iKr-8Q7hQR-8Qao2L-8QaniY-8QakCY-8Q7dNp-8Qaj2d/
Use the information displayed on the histogram to determine how many students spend between one hour and one and one-half hours each day studying.
First, look at the horizontal axis to determine the increments of time used to display the hours spent studying.
Next, look at the vertical axis to determine the increments used to display the number of students.
Next, locate the interval on the horizontal axis from 1.0 – 1.5 hours.
Then, move to the top of the bar above this interval and look to the vertical axis to determine the value that corresponds with the top of this vertical bar.
The answer is 35.
Example 3
A company is considering advertising in local movie theatres. In order to determine if this is a worthwhile endeavor, the company collected the following data:
|
Movies Attended in Past Two Years |
0-4 | 5-9 | 10-14 | 15-19 | 20-24 | 25-29 | 30-34 | 35-39 | 40+ |
| Number of People | 51 | 87 | 131 | 96 | 68 | 37 | 19 | 8 | 3 |
Using the information displayed in the frequency table, create a histogram to display the data.
First, draw a horizontal (x) and vertical (y) axis.
Next, label the horizontal axis with the intervals displayed on the frequency table.
Next, add a title to the horizontal axis.
Next, label the vertical axis by ones.
Next, add a title to the vertical axis.
Next, draw a vertical column to the appropriate value for each interval on the horizontal axis.
Then, add a title to the histogram.
Bob n Renee - https://www.flickr.com/photos/bobnrenee/93886281/in/photolist-9ic7Z-dKMNCw-9ic8Y-9ic8o-8prkC2-2EEWYK-8Q5Bki-8Q5URS-8Q1HBU-8PWmeF-8PZbcW-8Q6qnW-8QaSps-8Q7fxp-8Q9FmY-8Q6wfJ-8Q4xbN-8Q7KQg-8QaQBG-8QaPL9-8QaNK1-8Q7G9t-8QaLRL-8QaKVJ-8QaJco-8Q7BuR-8Q7ABP-8Q7zJ8-8Q7z1M-8QaDZW-8Q7xqX-8Q7wBT-8QaBvQ-8QazR9-8Q7tk2-8Qay8d-8Q7rD4-8QawqU-8Q7pFB-8QauFs-8Q7nV2-8Q7mZF-8Qas6d-8Q7kh8-8Qaqvs-8Q7iKr-8Q7hQR-8Qao2L-8QaniY-8QakCY;https://www.flickr.com/photos/bobnrenee/93886304/in/photolist-9ic8Y-9ic8o-8prkC2-2EEWYK-8Q5Bki-8Q5URS-8Q1HBU-8PWmeF-8PZbcW-8Q6qnW-8QaSps-8Q7fxp-8Q9FmY-8Q6wfJ-8Q4xbN-8Q7KQg-8QaQBG-8QaPL9-8QaNK1-8Q7G9t-8QaLRL-8QaKVJ-8QaJco-8Q7BuR-8Q7ABP-8Q7zJ8-8Q7z1M-8QaDZW-8Q7xqX-8Q7wBT-8QaBvQ-8QazR9-8Q7tk2-8Qay8d-8Q7rD4-8QawqU-8Q7pFB-8QauFs-8Q7nV2-8Q7mZF-8Qas6d-8Q7kh8-8Qaqvs-8Q7iKr-8Q7hQR-8Qao2L-8QaniY-8QakCY-8Q7dNp-8Qaj2d/
Example 4
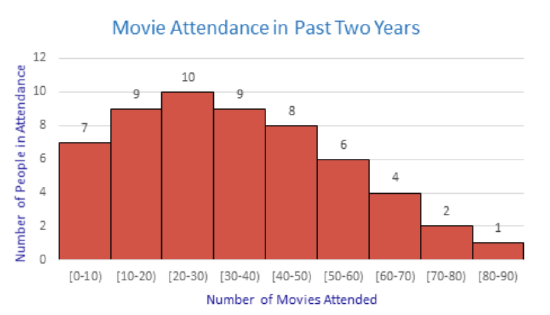
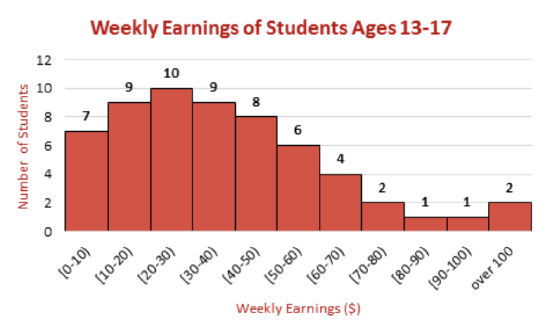
The histogram below shows the weekly earnings of students ages 13 – 17 who have part-time jobs. Use the histogram to answer the questions presented below the graph.
Bob n Renee - https://www.flickr.com/photos/bobnrenee/93886281/in/photolist-9ic7Z-dKMNCw-9ic8Y-9ic8o-8prkC2-2EEWYK-8Q5Bki-8Q5URS-8Q1HBU-8PWmeF-8PZbcW-8Q6qnW-8QaSps-8Q7fxp-8Q9FmY-8Q6wfJ-8Q4xbN-8Q7KQg-8QaQBG-8QaPL9-8QaNK1-8Q7G9t-8QaLRL-8QaKVJ-8QaJco-8Q7BuR-8Q7ABP-8Q7zJ8-8Q7z1M-8QaDZW-8Q7xqX-8Q7wBT-8QaBvQ-8QazR9-8Q7tk2-8Qay8d-8Q7rD4-8QawqU-8Q7pFB-8QauFs-8Q7nV2-8Q7mZF-8Qas6d-8Q7kh8-8Qaqvs-8Q7iKr-8Q7hQR-8Qao2L-8QaniY-8QakCY;https://www.flickr.com/photos/bobnrenee/93886304/in/photolist-9ic8Y-9ic8o-8prkC2-2EEWYK-8Q5Bki-8Q5URS-8Q1HBU-8PWmeF-8PZbcW-8Q6qnW-8QaSps-8Q7fxp-8Q9FmY-8Q6wfJ-8Q4xbN-8Q7KQg-8QaQBG-8QaPL9-8QaNK1-8Q7G9t-8QaLRL-8QaKVJ-8QaJco-8Q7BuR-8Q7ABP-8Q7zJ8-8Q7z1M-8QaDZW-8Q7xqX-8Q7wBT-8QaBvQ-8QazR9-8Q7tk2-8Qay8d-8Q7rD4-8QawqU-8Q7pFB-8QauFs-8Q7nV2-8Q7mZF-8Qas6d-8Q7kh8-8Qaqvs-8Q7iKr-8Q7hQR-8Qao2L-8QaniY-8QakCY-8Q7dNp-8Qaj2d/
How many students earned $50 - $60?
First, find the interval [50-60) on the horizontal axis labelled Weekly Earnings.
Next, go to the top of the vertical bar above this interval and record the number.
The answer is 6.
How many students had part-time jobs?
First, look at the top of each of the vertical bars. These numbers represent the number of students with earnings in the corresponding intervals.
Next, record the numbers at the top of each bar.
7, 9, 10, 9, 8, 6, 4, 2, 1, 1, 2
Then, add the recorded numbers.
7+9+10+9+8+6+4+2+1+1+2=59
The answer is 59.
Review
Use this histogram from the Guided Practice to answer the questions presented below.
Bob n Renee - https://www.flickr.com/photos/bobnrenee/93886281/in/photolist-9ic7Z-dKMNCw-9ic8Y-9ic8o-8prkC2-2EEWYK-8Q5Bki-8Q5URS-8Q1HBU-8PWmeF-8PZbcW-8Q6qnW-8QaSps-8Q7fxp-8Q9FmY-8Q6wfJ-8Q4xbN-8Q7KQg-8QaQBG-8QaPL9-8QaNK1-8Q7G9t-8QaLRL-8QaKVJ-8QaJco-8Q7BuR-8Q7ABP-8Q7zJ8-8Q7z1M-8QaDZW-8Q7xqX-8Q7wBT-8QaBvQ-8QazR9-8Q7tk2-8Qay8d-8Q7rD4-8QawqU-8Q7pFB-8QauFs-8Q7nV2-8Q7mZF-8Qas6d-8Q7kh8-8Qaqvs-8Q7iKr-8Q7hQR-8Qao2L-8QaniY-8QakCY;https://www.flickr.com/photos/bobnrenee/93886304/in/photolist-9ic8Y-9ic8o-8prkC2-2EEWYK-8Q5Bki-8Q5URS-8Q1HBU-8PWmeF-8PZbcW-8Q6qnW-8QaSps-8Q7fxp-8Q9FmY-8Q6wfJ-8Q4xbN-8Q7KQg-8QaQBG-8QaPL9-8QaNK1-8Q7G9t-8QaLRL-8QaKVJ-8QaJco-8Q7BuR-8Q7ABP-8Q7zJ8-8Q7z1M-8QaDZW-8Q7xqX-8Q7wBT-8QaBvQ-8QazR9-8Q7tk2-8Qay8d-8Q7rD4-8QawqU-8Q7pFB-8QauFs-8Q7nV2-8Q7mZF-8Qas6d-8Q7kh8-8Qaqvs-8Q7iKr-8Q7hQR-8Qao2L-8QaniY-8QakCY-8Q7dNp-8Qaj2d/
1. How many students spend less than 30 minutes studying?
2. How many students spend greater than 60 minutes studying?
3. How many students spend greater than 90 minutes studying?
4. How many students spend between 2 and 212hours studying?
5. If this histogram is the result of a survey, was the number of students surveyed greater than 100?
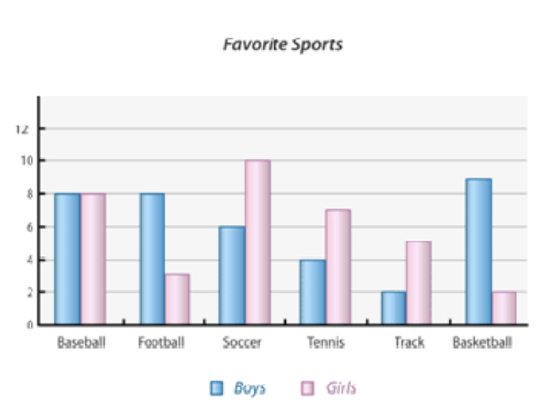
The recreation director in a small community asked children between the ages of 13 to 16 to name their favorite sport from a list of six choices. The results of the survey are displayed on the following bar graph according to the selections made by boys and girls.
Use the information shown on the graph to answer the questions presented below.
Bob n Renee - https://www.flickr.com/photos/bobnrenee/93886281/in/photolist-9ic7Z-dKMNCw-9ic8Y-9ic8o-8prkC2-2EEWYK-8Q5Bki-8Q5URS-8Q1HBU-8PWmeF-8PZbcW-8Q6qnW-8QaSps-8Q7fxp-8Q9FmY-8Q6wfJ-8Q4xbN-8Q7KQg-8QaQBG-8QaPL9-8QaNK1-8Q7G9t-8QaLRL-8QaKVJ-8QaJco-8Q7BuR-8Q7ABP-8Q7zJ8-8Q7z1M-8QaDZW-8Q7xqX-8Q7wBT-8QaBvQ-8QazR9-8Q7tk2-8Qay8d-8Q7rD4-8QawqU-8Q7pFB-8QauFs-8Q7nV2-8Q7mZF-8Qas6d-8Q7kh8-8Qaqvs-8Q7iKr-8Q7hQR-8Qao2L-8QaniY-8QakCY;https://www.flickr.com/photos/bobnrenee/93886304/in/photolist-9ic8Y-9ic8o-8prkC2-2EEWYK-8Q5Bki-8Q5URS-8Q1HBU-8PWmeF-8PZbcW-8Q6qnW-8QaSps-8Q7fxp-8Q9FmY-8Q6wfJ-8Q4xbN-8Q7KQg-8QaQBG-8QaPL9-8QaNK1-8Q7G9t-8QaLRL-8QaKVJ-8QaJco-8Q7BuR-8Q7ABP-8Q7zJ8-8Q7z1M-8QaDZW-8Q7xqX-8Q7wBT-8QaBvQ-8QazR9-8Q7tk2-8Qay8d-8Q7rD4-8QawqU-8Q7pFB-8QauFs-8Q7nV2-8Q7mZF-8Qas6d-8Q7kh8-8Qaqvs-8Q7iKr-8Q7hQR-8Qao2L-8QaniY-8QakCY-8Q7dNp-8Qaj2d/
6. If each girl could only vote once, what was the total number of girls surveyed?
7. If each boy could only vote once, how many boys were surveyed?
8. What fraction of the girls surveyed chose track as their favorite sport?
9. What fraction of the girls surveyed chose soccer as their favorite sport?
10. What percentage of the girls surveyed chose track and soccer as their favorite sport? You may round to the nearest whole percent.
11. What fraction of the boys chose football as their favorite sport?
12. How many boys and girls were surveyed in all?
13. True or false. Basketball is the least popular sport among girls.
14. True or false. It is also the least popular among boys.
15. What is the most popular sport among girls?
16. What is the least popular sport among boys?
Additional Resources
PLIX: Play, Learn, Interact, eXplore - Comparing Heights
Vide: Histograms
Practice: Bar Graphs, Frequency Tables, and Histograms
Real World: Keeping it Clean