
2.7.2: Linear Regression Equations
- Page ID
- 5771
\( \newcommand{\vecs}[1]{\overset { \scriptstyle \rightharpoonup} {\mathbf{#1}} } \)
\( \newcommand{\vecd}[1]{\overset{-\!-\!\rightharpoonup}{\vphantom{a}\smash {#1}}} \)
\( \newcommand{\id}{\mathrm{id}}\) \( \newcommand{\Span}{\mathrm{span}}\)
( \newcommand{\kernel}{\mathrm{null}\,}\) \( \newcommand{\range}{\mathrm{range}\,}\)
\( \newcommand{\RealPart}{\mathrm{Re}}\) \( \newcommand{\ImaginaryPart}{\mathrm{Im}}\)
\( \newcommand{\Argument}{\mathrm{Arg}}\) \( \newcommand{\norm}[1]{\| #1 \|}\)
\( \newcommand{\inner}[2]{\langle #1, #2 \rangle}\)
\( \newcommand{\Span}{\mathrm{span}}\)
\( \newcommand{\id}{\mathrm{id}}\)
\( \newcommand{\Span}{\mathrm{span}}\)
\( \newcommand{\kernel}{\mathrm{null}\,}\)
\( \newcommand{\range}{\mathrm{range}\,}\)
\( \newcommand{\RealPart}{\mathrm{Re}}\)
\( \newcommand{\ImaginaryPart}{\mathrm{Im}}\)
\( \newcommand{\Argument}{\mathrm{Arg}}\)
\( \newcommand{\norm}[1]{\| #1 \|}\)
\( \newcommand{\inner}[2]{\langle #1, #2 \rangle}\)
\( \newcommand{\Span}{\mathrm{span}}\) \( \newcommand{\AA}{\unicode[.8,0]{x212B}}\)
\( \newcommand{\vectorA}[1]{\vec{#1}} % arrow\)
\( \newcommand{\vectorAt}[1]{\vec{\text{#1}}} % arrow\)
\( \newcommand{\vectorB}[1]{\overset { \scriptstyle \rightharpoonup} {\mathbf{#1}} } \)
\( \newcommand{\vectorC}[1]{\textbf{#1}} \)
\( \newcommand{\vectorD}[1]{\overrightarrow{#1}} \)
\( \newcommand{\vectorDt}[1]{\overrightarrow{\text{#1}}} \)
\( \newcommand{\vectE}[1]{\overset{-\!-\!\rightharpoonup}{\vphantom{a}\smash{\mathbf {#1}}}} \)
\( \newcommand{\vecs}[1]{\overset { \scriptstyle \rightharpoonup} {\mathbf{#1}} } \)
\( \newcommand{\vecd}[1]{\overset{-\!-\!\rightharpoonup}{\vphantom{a}\smash {#1}}} \)
\(\newcommand{\avec}{\mathbf a}\) \(\newcommand{\bvec}{\mathbf b}\) \(\newcommand{\cvec}{\mathbf c}\) \(\newcommand{\dvec}{\mathbf d}\) \(\newcommand{\dtil}{\widetilde{\mathbf d}}\) \(\newcommand{\evec}{\mathbf e}\) \(\newcommand{\fvec}{\mathbf f}\) \(\newcommand{\nvec}{\mathbf n}\) \(\newcommand{\pvec}{\mathbf p}\) \(\newcommand{\qvec}{\mathbf q}\) \(\newcommand{\svec}{\mathbf s}\) \(\newcommand{\tvec}{\mathbf t}\) \(\newcommand{\uvec}{\mathbf u}\) \(\newcommand{\vvec}{\mathbf v}\) \(\newcommand{\wvec}{\mathbf w}\) \(\newcommand{\xvec}{\mathbf x}\) \(\newcommand{\yvec}{\mathbf y}\) \(\newcommand{\zvec}{\mathbf z}\) \(\newcommand{\rvec}{\mathbf r}\) \(\newcommand{\mvec}{\mathbf m}\) \(\newcommand{\zerovec}{\mathbf 0}\) \(\newcommand{\onevec}{\mathbf 1}\) \(\newcommand{\real}{\mathbb R}\) \(\newcommand{\twovec}[2]{\left[\begin{array}{r}#1 \\ #2 \end{array}\right]}\) \(\newcommand{\ctwovec}[2]{\left[\begin{array}{c}#1 \\ #2 \end{array}\right]}\) \(\newcommand{\threevec}[3]{\left[\begin{array}{r}#1 \\ #2 \\ #3 \end{array}\right]}\) \(\newcommand{\cthreevec}[3]{\left[\begin{array}{c}#1 \\ #2 \\ #3 \end{array}\right]}\) \(\newcommand{\fourvec}[4]{\left[\begin{array}{r}#1 \\ #2 \\ #3 \\ #4 \end{array}\right]}\) \(\newcommand{\cfourvec}[4]{\left[\begin{array}{c}#1 \\ #2 \\ #3 \\ #4 \end{array}\right]}\) \(\newcommand{\fivevec}[5]{\left[\begin{array}{r}#1 \\ #2 \\ #3 \\ #4 \\ #5 \\ \end{array}\right]}\) \(\newcommand{\cfivevec}[5]{\left[\begin{array}{c}#1 \\ #2 \\ #3 \\ #4 \\ #5 \\ \end{array}\right]}\) \(\newcommand{\mattwo}[4]{\left[\begin{array}{rr}#1 \amp #2 \\ #3 \amp #4 \\ \end{array}\right]}\) \(\newcommand{\laspan}[1]{\text{Span}\{#1\}}\) \(\newcommand{\bcal}{\cal B}\) \(\newcommand{\ccal}{\cal C}\) \(\newcommand{\scal}{\cal S}\) \(\newcommand{\wcal}{\cal W}\) \(\newcommand{\ecal}{\cal E}\) \(\newcommand{\coords}[2]{\left\{#1\right\}_{#2}}\) \(\newcommand{\gray}[1]{\color{gray}{#1}}\) \(\newcommand{\lgray}[1]{\color{lightgray}{#1}}\) \(\newcommand{\rank}{\operatorname{rank}}\) \(\newcommand{\row}{\text{Row}}\) \(\newcommand{\col}{\text{Col}}\) \(\renewcommand{\row}{\text{Row}}\) \(\newcommand{\nul}{\text{Nul}}\) \(\newcommand{\var}{\text{Var}}\) \(\newcommand{\corr}{\text{corr}}\) \(\newcommand{\len}[1]{\left|#1\right|}\) \(\newcommand{\bbar}{\overline{\bvec}}\) \(\newcommand{\bhat}{\widehat{\bvec}}\) \(\newcommand{\bperp}{\bvec^\perp}\) \(\newcommand{\xhat}{\widehat{\xvec}}\) \(\newcommand{\vhat}{\widehat{\vvec}}\) \(\newcommand{\uhat}{\widehat{\uvec}}\) \(\newcommand{\what}{\widehat{\wvec}}\) \(\newcommand{\Sighat}{\widehat{\Sigma}}\) \(\newcommand{\lt}{<}\) \(\newcommand{\gt}{>}\) \(\newcommand{\amp}{&}\) \(\definecolor{fillinmathshade}{gray}{0.9}\)Linear Regression Equations
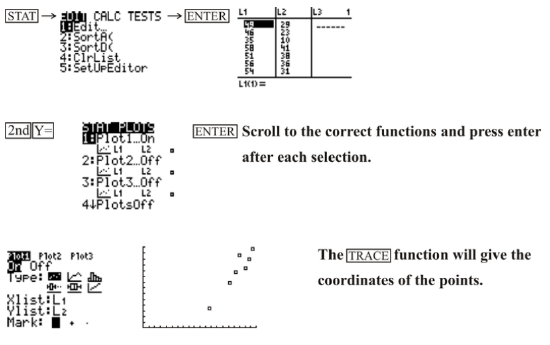
Scatter plots and lines of best fit can also be drawn by using technology. The TI-83 is capable of graphing both a scatter plot and of inserting the line of best fit onto the scatter plot. The calculator is also able to find the correlation coefficient (r) and the coefficient of determination (r2) for the linear regression equation.
The correlation coefficient will have a value between −1 and 1. The closer the correlation coefficient is to −1 or 1, the stronger the correlation. If the correlation coefficient is negative, this implies a negative correlation, and if the correlation coefficient is positive, this implies a positive correlation. The coefficient of determination is just the correlation coefficient squared, and, therefore, it is always positive. The closer the coefficient of determination is to 1, the stronger the correlation.
Creating a Scatter plot Using a Calculator
The following table consists of the marks achieved by 9 students on chemistry and math tests. Create a scatter plot for the data with your calculator.
| Student | A | B | C | D | E | F | G | H | I |
|---|---|---|---|---|---|---|---|---|---|
| Chemistry Marks | 49 | 46 | 35 | 58 | 51 | 56 | 54 | 46 | 53 |
| Math Marks | 29 | 23 | 10 | 41 | 38 | 36 | 31 | 24 | ? |
Drawing a Line of Best Fit
Draw a line of best fit for the data that you plotted in the previous example. Use the line of best fit to calculate the predicted value for Student I's math test mark.
The calculator can now be used to determine a linear regression equation for the given values. The equation can be entered into the calculator, and the line will be plotted on the scatter plot.
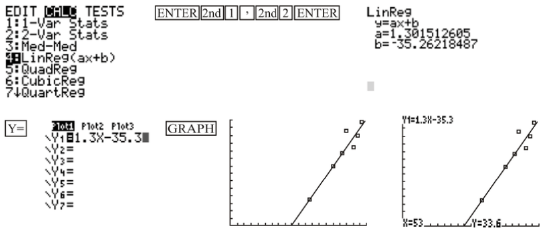
From the line of best fit, the calculated value for Student I's math test mark is 33.6.
Determining the Correlation Coefficient and the Coefficient of Determination
Determine the correlation coefficient and the coefficient of determination for the linear regression equation that you found in Example B. Is the linear regression equation a good fit for the data?
The correlation coefficient and the coefficient of determination for the linear regression equation are found the same way that the linear regression equation is found. In other words, to find the correlation coefficient and the coefficient of determination, after entering the data into your calculator, press STAT, go to the CALC menu, and choose LinReg(ax + b). After pressing ENTER to choose LinReg(ax + b), press ENTER again, and you should see the following screen:
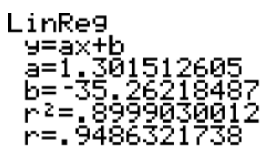
You can see that r, or the correlation coefficient, is equal to 0.9486321738, while r2, or the coefficient of determination, is equal to 0.8999030012. This means that the linear regression equation is a moderately good fit, but not a great fit, for the data.
Examples
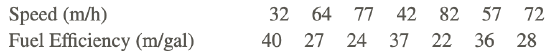
The data below gives the fuel efficiency of cars with the same-sized engines when driven at various speeds.

Example 1
Draw a scatter plot and a line of best fit using technology. What is the equation of the line of best fit?
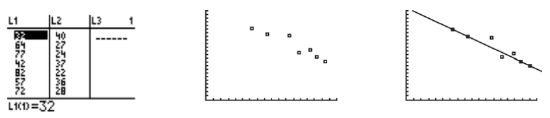
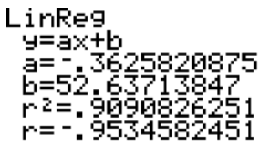
From the following screen, the equation of the line of best fit is approximately y=−0.36x+52.6.
Example 2
What is the correlation coefficient and the coefficient of determination of the linear regression equation? Is the linear regression equation a good fit for the data?
As can be seen in the screen in the answer to part a, the correlation coefficient is 0.9534582451, while the coefficient of determination is 0.9090826251. This means that the linear regression equation is a moderately good fit, but not a great fit, for the data.
Example 3
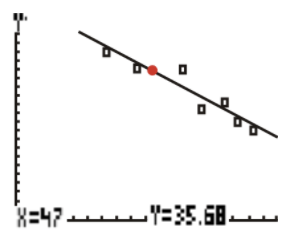
If a car were traveling at a speed of 47 m/h, estimate the fuel efficiency of the car.
Using the TI-83 to calculate the value, the fuel efficiency of a car traveling at a speed of 47 m/h would be approximately 35 m\gal.
Example 4
If a car has a fuel efficiency of 29 m/gal, estimate the speed of the car.
From the calculator, the equation of the line of best fit is approximately y=−0.36x+52.6, where y represents the fuel efficiency of the car and x represents the speed of the car.
Using this equation:
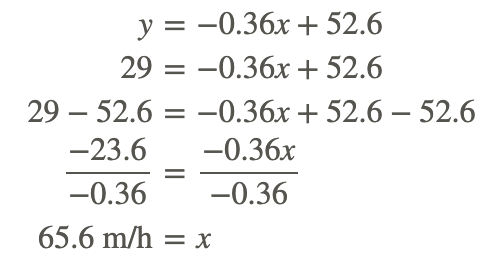
The speed of the car would be approximately 65.6 miles per hour.
Review
- Which of the following calculations will create the line of best fit on the TI-83?
- quadratic regression
- cubic regression
- exponential regression
- linear regression (ax+b)
The linear regression below was performed on a data set with a TI calculator. Use the information shown on the screen to answer the following questions:
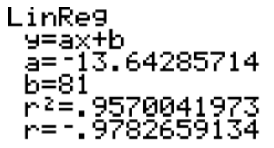
- What is the linear regression equation?
- What is the correlation coefficient and the coefficient of determination? Is the linear regression equation a good fit for the data?
- According to the linear regression equation, what would be the approximate value of y when x = 3?
The linear regression below was performed on a data set with a TI calculator. Use the information shown on the screen to answer the following questions:
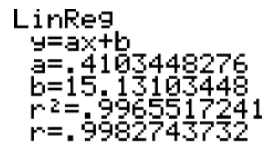
- What is the linear regression equation?
- What is the correlation coefficient and the coefficient of determination? Is the linear regression equation a good fit for the data?
- According to the linear regression equation, what would be the approximate value of x when y = 8?
Vocabulary
| Term | Definition |
|---|---|
| correlation coefficient (r) | and the coefficient of determination (r2) are both standard quantitative measures of best fit. The correlation coefficient has values from −1 to 1, and the closer the value is to −1 or 1, the better the fit. If the correlation coefficient is negative, the correlation is negative, and if it is positive, the correlation is positive. The coefficient of determination is the correlation coefficient squared and has values from 0 to 1. The closer the value is to 1, the better the fit. |
| coefficient of determination | The coefficient of determination is the square of the correlation coefficient and therefore has values from 0 to 1. |
| correlation coefficient | The correlation coefficient is a standard quantitative measure of best fit of a line. It has the symbol r and has values from -1 to +1. |
Additional Resources
Video: Solving Word Problems Involving Scatter Plots - Example 2
Activities: Linear Regression Equations Discussion Questions
Lesson Plans: Calculating a Linear Regression Line Equation with Technology
Practice: Linear Regression Equations
Real World: Linear Regression Equations