
3.3: Surveys and Samples
- Page ID
- 5707
\( \newcommand{\vecs}[1]{\overset { \scriptstyle \rightharpoonup} {\mathbf{#1}} } \)
\( \newcommand{\vecd}[1]{\overset{-\!-\!\rightharpoonup}{\vphantom{a}\smash {#1}}} \)
\( \newcommand{\id}{\mathrm{id}}\) \( \newcommand{\Span}{\mathrm{span}}\)
( \newcommand{\kernel}{\mathrm{null}\,}\) \( \newcommand{\range}{\mathrm{range}\,}\)
\( \newcommand{\RealPart}{\mathrm{Re}}\) \( \newcommand{\ImaginaryPart}{\mathrm{Im}}\)
\( \newcommand{\Argument}{\mathrm{Arg}}\) \( \newcommand{\norm}[1]{\| #1 \|}\)
\( \newcommand{\inner}[2]{\langle #1, #2 \rangle}\)
\( \newcommand{\Span}{\mathrm{span}}\)
\( \newcommand{\id}{\mathrm{id}}\)
\( \newcommand{\Span}{\mathrm{span}}\)
\( \newcommand{\kernel}{\mathrm{null}\,}\)
\( \newcommand{\range}{\mathrm{range}\,}\)
\( \newcommand{\RealPart}{\mathrm{Re}}\)
\( \newcommand{\ImaginaryPart}{\mathrm{Im}}\)
\( \newcommand{\Argument}{\mathrm{Arg}}\)
\( \newcommand{\norm}[1]{\| #1 \|}\)
\( \newcommand{\inner}[2]{\langle #1, #2 \rangle}\)
\( \newcommand{\Span}{\mathrm{span}}\) \( \newcommand{\AA}{\unicode[.8,0]{x212B}}\)
\( \newcommand{\vectorA}[1]{\vec{#1}} % arrow\)
\( \newcommand{\vectorAt}[1]{\vec{\text{#1}}} % arrow\)
\( \newcommand{\vectorB}[1]{\overset { \scriptstyle \rightharpoonup} {\mathbf{#1}} } \)
\( \newcommand{\vectorC}[1]{\textbf{#1}} \)
\( \newcommand{\vectorD}[1]{\overrightarrow{#1}} \)
\( \newcommand{\vectorDt}[1]{\overrightarrow{\text{#1}}} \)
\( \newcommand{\vectE}[1]{\overset{-\!-\!\rightharpoonup}{\vphantom{a}\smash{\mathbf {#1}}}} \)
\( \newcommand{\vecs}[1]{\overset { \scriptstyle \rightharpoonup} {\mathbf{#1}} } \)
\( \newcommand{\vecd}[1]{\overset{-\!-\!\rightharpoonup}{\vphantom{a}\smash {#1}}} \)
\(\newcommand{\avec}{\mathbf a}\) \(\newcommand{\bvec}{\mathbf b}\) \(\newcommand{\cvec}{\mathbf c}\) \(\newcommand{\dvec}{\mathbf d}\) \(\newcommand{\dtil}{\widetilde{\mathbf d}}\) \(\newcommand{\evec}{\mathbf e}\) \(\newcommand{\fvec}{\mathbf f}\) \(\newcommand{\nvec}{\mathbf n}\) \(\newcommand{\pvec}{\mathbf p}\) \(\newcommand{\qvec}{\mathbf q}\) \(\newcommand{\svec}{\mathbf s}\) \(\newcommand{\tvec}{\mathbf t}\) \(\newcommand{\uvec}{\mathbf u}\) \(\newcommand{\vvec}{\mathbf v}\) \(\newcommand{\wvec}{\mathbf w}\) \(\newcommand{\xvec}{\mathbf x}\) \(\newcommand{\yvec}{\mathbf y}\) \(\newcommand{\zvec}{\mathbf z}\) \(\newcommand{\rvec}{\mathbf r}\) \(\newcommand{\mvec}{\mathbf m}\) \(\newcommand{\zerovec}{\mathbf 0}\) \(\newcommand{\onevec}{\mathbf 1}\) \(\newcommand{\real}{\mathbb R}\) \(\newcommand{\twovec}[2]{\left[\begin{array}{r}#1 \\ #2 \end{array}\right]}\) \(\newcommand{\ctwovec}[2]{\left[\begin{array}{c}#1 \\ #2 \end{array}\right]}\) \(\newcommand{\threevec}[3]{\left[\begin{array}{r}#1 \\ #2 \\ #3 \end{array}\right]}\) \(\newcommand{\cthreevec}[3]{\left[\begin{array}{c}#1 \\ #2 \\ #3 \end{array}\right]}\) \(\newcommand{\fourvec}[4]{\left[\begin{array}{r}#1 \\ #2 \\ #3 \\ #4 \end{array}\right]}\) \(\newcommand{\cfourvec}[4]{\left[\begin{array}{c}#1 \\ #2 \\ #3 \\ #4 \end{array}\right]}\) \(\newcommand{\fivevec}[5]{\left[\begin{array}{r}#1 \\ #2 \\ #3 \\ #4 \\ #5 \\ \end{array}\right]}\) \(\newcommand{\cfivevec}[5]{\left[\begin{array}{c}#1 \\ #2 \\ #3 \\ #4 \\ #5 \\ \end{array}\right]}\) \(\newcommand{\mattwo}[4]{\left[\begin{array}{rr}#1 \amp #2 \\ #3 \amp #4 \\ \end{array}\right]}\) \(\newcommand{\laspan}[1]{\text{Span}\{#1\}}\) \(\newcommand{\bcal}{\cal B}\) \(\newcommand{\ccal}{\cal C}\) \(\newcommand{\scal}{\cal S}\) \(\newcommand{\wcal}{\cal W}\) \(\newcommand{\ecal}{\cal E}\) \(\newcommand{\coords}[2]{\left\{#1\right\}_{#2}}\) \(\newcommand{\gray}[1]{\color{gray}{#1}}\) \(\newcommand{\lgray}[1]{\color{lightgray}{#1}}\) \(\newcommand{\rank}{\operatorname{rank}}\) \(\newcommand{\row}{\text{Row}}\) \(\newcommand{\col}{\text{Col}}\) \(\renewcommand{\row}{\text{Row}}\) \(\newcommand{\nul}{\text{Nul}}\) \(\newcommand{\var}{\text{Var}}\) \(\newcommand{\corr}{\text{corr}}\) \(\newcommand{\len}[1]{\left|#1\right|}\) \(\newcommand{\bbar}{\overline{\bvec}}\) \(\newcommand{\bhat}{\widehat{\bvec}}\) \(\newcommand{\bperp}{\bvec^\perp}\) \(\newcommand{\xhat}{\widehat{\xvec}}\) \(\newcommand{\vhat}{\widehat{\vvec}}\) \(\newcommand{\uhat}{\widehat{\uvec}}\) \(\newcommand{\what}{\widehat{\wvec}}\) \(\newcommand{\Sighat}{\widehat{\Sigma}}\) \(\newcommand{\lt}{<}\) \(\newcommand{\gt}{>}\) \(\newcommand{\amp}{&}\) \(\definecolor{fillinmathshade}{gray}{0.9}\)Surveys and Samples
What if you wanted to know the percentage of the people in your town who eat breakfast at least 5 times per week? Your town is too big to ask each person individually, so what would you do? How could you ensure that the information you find out is accurate?
Surveys and Samples
One of the most important applications of statistics is collecting information. Statistical studies are done for many purposes:
- To find out more about animal behaviors;
- To determine which presidential candidate is favored;
- To figure out what type of chip product is most popular;
- To determine the gas consumption of cars.
In most cases, it is not possible to survey everyone in a given population. So a sample is taken. It is essential that the sample is a representative sample of the population being studied. For example, if we are trying to determine the effect of a drug on teenage girls, it would make no sense to include males in our sample population, nor would it make sense to include women that are not teenagers.
Sampling Methods
The two types of sampling methods we will cover are:
- Random Sampling
- Stratified Sampling
Random sampling is a method in which people are chosen “out of the blue.” In a true random sample, everyone in the population must have the same chance of being chosen. It is important that each person in the population has a chance of being picked.
Stratified sampling is a method actively seeking to poll people from many different backgrounds. The population is first divided into different categories (or strata) and the number of members in each category is determined. In order to lessen the chance of a biased result, the sample size must be large enough. The larger the sample size is, the more precise the estimate is. However, the larger the sample size, the more expensive and time-consuming the statistical study becomes.
For the following problem, let's choose the best sampling method:
For a class assignment you have been asked to find if students in your school are planning to attend university after graduating high school. Students can respond with “yes,” “no,” or “undecided.” How will you choose those you wish to interview if you want your results to be reliable?
The stratified sampling method would be the best option. By randomly picking a certain number of students in each grade, you will get the most accurate results.
Biased Samples
If the sample ends up with one or more sub-groups that are either over-represented or under-represented, then we say the sample is biased. We would not expect the results of a biased sample to represent the entire population, so it is important to avoid selecting a biased sample.
Some samples may deliberately seek a biased sample in order to obtain a particular viewpoint. For example, if a group of students were trying to petition the school to allow eating candy in the classroom, they might only survey students immediately before lunchtime when students are hungry. The practice of polling only those who you believe will support your cause is sometimes referred to as cherry picking.
Many surveys may have a non-response bias. In this case, a survey that is simply handed out gains few responses when compared to the number of surveys given out. People who are either too busy or simply not interested will be excluded from the results. Non-response bias may be reduced by conducting face-to-face interviews.
Self-selected respondents who tend to have stronger opinions on subjects than others and are more motivated to respond may also cause bias. For this reason phone-in and online polls also tend to be poor representations of the overall population. Even though it appears that both sides are responding, the poll may disproportionately represent extreme viewpoints from both sides, while ignoring more moderate opinions that may, in fact, be the majority view. Self-selected polls are generally regarded as unscientific.
Now, let's take a look at determining bias:
Determine whether the following survey is biased. Explain your reasoning.
“Asking people shopping at a farmer’s market if they think locally grown fruit and vegetables are healthier than supermarket fruits and vegetables”
This would be a biased sample because people shopping at a farmer’s market are generally interested in buying fresher fruits and vegetables than a regular supermarket provides. The study can be improved by interviewing an equal number of people coming out of a supermarket, or by interviewing people in a more neutral environment such as the post office.
Biased Questions
Although your sample may be a good representation of the population, the way questions are worded in the survey can still provoke a biased result. There are several ways to identify biased questions.
- They may use polarizing language, words, and phrases that people associate with emotions.
- How much of your time do you waste on TV every week?
- They may refer to a majority or to a supposed authority.
- Would you agree with the American Heart and Lung Association that smoking is bad for your health?
- They may be phrased so as to suggest the person asking the question already knows the answer to be true, or to be false.
- You wouldn’t want criminals free to roam the streets, would you?
- They may be phrased in an ambiguous way (often with double negatives), which may confuse people.
- Do you disagree with people who oppose the ban on smoking in public places?
Design and Conduct a Survey
The method in which you design and conduct the survey is crucial to its accuracy. Surveys are a set of questions in which the sample answers. The data is compiled to form results, or findings. When designing a survey, be aware of the following recommendations.
- Determine the goal of your survey. What question do you want to answer?
- Identify the sample population. Who will you interview?
- Choose an interviewing method, face-to-face interview, phone interview, or self-administered paper survey or internet survey.
- Conduct the interview and collect the information.
- Analyze the results by making graphs and drawing conclusions.
Surveys can be conducted in several ways.
Face-to-face interviews
✓ Fewer misunderstood questions
✓ High response rate
✓ Additional information can be collected from respondents
- Time-consuming
- Expensive
- Can be biased based upon the attitude or appearance of the surveyor
Self-administered surveys
✓ Respondent can complete on his or her free time
✓ Less expensive than face-to-face interviews
✓ Anonymity causes more honest results
- Lower response rate
Let's take a look at the steps involved in constructing a survey.
Martha wants to construct a survey that shows which sports students at her school like to play the most.
- List the goal of the survey.
The goal of the survey is to find the answer to the question: “Which sports do students at Martha’s school like to play the most?”
- What population sample should she interview?
A sample of the population would include a random sample of the student population in Martha’s school. A good strategy would be to randomly select students (using dice or a random number generator) as they walk into an all-school assembly.
- How should she administer the survey?
Face-to-face interviews are a good choice in this case since the survey consists of only one question, which can be quickly answered and recorded.
- Create a data collection sheet that she can use to record her results.
In order to collect the data to this simple survey, Martha can design a data collection sheet such as the one below:
Display, Analyze, and Interpret Survey Data
We have shown you several ways to display data. These graphs are also useful when displaying survey results. Survey data can be displayed as:
- A bar graph
- A histogram
- A pie chart
- A tally sheet
- A box-and-whisker plot
- A stem-and-leaf plot
The method in which you choose to display your data will depend upon your survey results and to whom you plan to present the data.
Examples
Example 1
Earlier, we asked about the percentage of people in your town who eat breakfast at least 5 times per week. Your town is too big to ask each person individually, so what would you do? How could you ensure that the information you find out is accurate?
Because your town is too big to ask each person individually, you could conduct a random sample. In order to ensure that the information you collect is accurate, you can use a non-biased survey question.
Example 2
Raoul wants to construct a survey that shows how many hours per week the average student at his school works.
- List the goal of the survey.
- What population sample will he interview?
- How would he administer the survey?
The goal of the survey is to determine the number of hours the average student at Raoul's school works.
The population to be surveyed is the student body.
Care should be taken to randomly select students, so that variety of student life is represented. Surveying the football team only would not be a good representation of the whole student body. Students can be randomly surveyed, using dice or a random number generator, in a setting where all, or most, students will be, such as an assembly.
Review
- Explain the most common types of sampling methods. If you needed to survey a city about a new road project, which sampling method would you choose? Explain.
- What is a biased survey? How can bias be avoided?
- How are surveys conducted, according to this text? List one advantage and one disadvantage of each. List one additional method that can be used to conduct surveys.
- What are some keys to recognizing biased questions? What could you do if you were presented with a biased question?
- For a class assignment, you have been asked to find out how students get to school. Do they take public transportation, drive themselves, have their parents drive them, use a carpool, or walk/bike? You decide to interview a sample of students. How will you choose those you wish to interview if you want your results to be reliable?
- Comment on the way the following samples have been chosen. For the unsatisfactory cases, suggest a way to improve the sample choice.
- You want to find whether wealthier people have more nutritious diets by interviewing people coming out of a five-star restaurant.
- You want to find if a pedestrian crossing is needed at a certain intersection by interviewing people walking by that intersection.
- You want to find out if women talk more than men by interviewing an equal number of men and women.
- You want to find whether students in your school get too much homework by interviewing a stratified sample of students from each grade level.
- You want to find out whether there should be more public busses running during rush hour by interviewing people getting off the bus.
- You want to find out whether children should be allowed to listen to music while doing their homework by interviewing a stratified sample of male and female students in your school.
- Raoul found that 30% of the students at his school are in 9th grade, 26% of the students are in the 10th grade, 24% of the students are in 11th grade, and 20% of the students are in the 12thgrade. He surveyed a total of 60 students using these proportions as a guide for the number of students he interviewed from each grade. Raoul recorded the following data.
- Construct a stem-and-leaf plot of the collected data.
- Construct a frequency table with a bin size of 5.
- Draw a histogram of the data.
- Find the five-number summary of the data and draw a box-and-whisker plot.
| Grade Level | Record Number of Hours Worked | Total Number of Students |
|---|---|---|
| 9th grade | 0, 5, 4, 0, 0, 10, 5, 6, 0, 0, 2, 4, 0, 8, 0, 5, 7, 0 | 18 |
| 10th grade | 6, 10, 12, 0, 10, 15, 0, 0, 8, 5, 0, 7, 10, 12, 0, 0 | 16 |
| 11th grade | 0, 12, 15, 18, 10, 0, 0, 20, 8, 15, 10, 15, 0, 5 | 14 |
| 12th grade | 22, 15, 12, 15, 10, 0, 18, 20, 10, 0, 12, 16 | 12 |
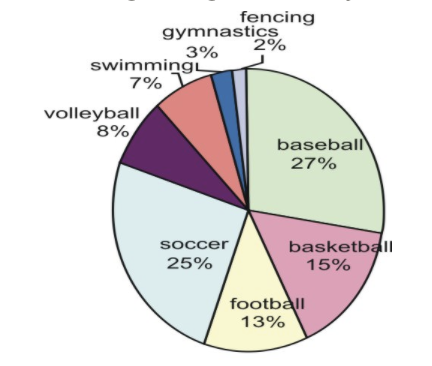
- The following pie chart displays data from a survey asking students the type of sports they enjoyed playing most. Make five conclusions regarding the survey results.
- Melissa conducted a survey to answer the question: “What sport do high school students like to watch on TV the most?” She collected the following information on her data collection sheet.
- Make a pie chart of the results showing the percentage of people in each category.
- Make a bar-graph of the results.
Sport Tally Baseball 32 Basketball 28 Football 24 Soccer 18 Gymnastics 19 Figure Skating 8 Hockey 18 Total 147


- Samuel conducted a survey to answer the following question: “What is the favorite kind of pie of the people living in my town?” By standing in front of his grocery store, he collected the following information on his data collection sheet: #Make a pie chart of the results showing the percentage of people in each category.
- Make a bar graph of the results.
Type of Pie Tally Apple 37 Pumpkin 13 Lemon Meringue 7 Chocolate Mousse 23 Cherry 4 Chicken Pot Pie 31 Other 7 Total 122


- Myra conducted a survey of people at her school to see “In which month does a person’s birthday fall?” She collected the following information in her data collection sheet:
- Make a pie chart of the results showing the percentage of people whose birthday falls in each month.
- Make a bar graph of the results.
Month Tally January 16 February 13 March 12 April 11 May 13 June 12 July 9 August 7 September 9 October 8 November 13 December 13 Total: 136


- Nam-Ling conducted a survey that answers the question: “Which student would you vote for in your school’s elections?” She collected the following information:
- Make a pie chart of the results showing the percentage of people planning to vote for each candidate.
- Make a bar graph of the results.
Candidate 9th graders 10th graders 11th graders 12th graders Total Susan Cho 19 Margarita Martinez 31 Steve Coogan 16 Solomon Duning 26 Juan Rios 28 Total 36 30 30 24 120

- Graham conducted a survey to find how many hours of TV teenagers watch each week in the United States. He collaborated with three friends who lived in different parts of the U.S. and found the following information:
- Make a stem-and-leaf plot of the data.
- Decide on an appropriate bin size and construct a frequency table.
- Make a histogram of the results.
- Find the five-number summary of the data and construct a box-and-whisker plot.
Part of the country Number of hours of TV watched per week Total number of teens West Coast 10, 12, 8, 20, 6, 0, 15, 18, 12, 22, 9, 5, 16, 12, 10, 18, 10, 20, 24, 8 20 Mid West 20, 12, 24, 10, 8, 26, 34, 15, 18, 6, 22, 16, 10, 20, 15, 25, 32, 12, 18, 22 20 New England 16, 9, 12, 0, 6, 10, 15, 24, 20, 30, 15, 10, 12, 8, 28, 32, 24, 12, 10, 10 20 South 24, 22, 12, 32, 30, 20, 25, 15, 10, 14, 10, 12, 24, 28, 32, 38, 20, 25, 15, 12 20
- “What do students in your high school like to spend their money on?”
- Which categories would you include on your data collection sheet?
- Design the data collection sheet that can be used to collect this information.
- Conduct the survey. This activity is best done as a group with each person contributing at least 20 results.
- Make a pie chart of the results showing the percentage of people in each category.
- Make a bar graph of the results.
- “What is the height of students in your class?”
- Design the data collection sheet that can be used to collect this information.
- Conduct the survey. This activity is best done as a group with each person contributing at least 20 results.
- Make a stem-and-leaf plot of the data.
- Decide on an appropriate bin size and construct a frequency table.
- Make a histogram of the results.
- Find the five-number summary of the data and construct a box-and-whisker plot.
- “How much allowance money do students in your school get per week?”
- Design the data collection sheet that can be used to collect this information.
- Conduct the survey. This activity is best done as a group with each person contributing at least 20 results.
- Make a stem-and-leaf plot of the data.
- Decide on an appropriate bin size and construct a frequency table.
- Make a histogram of the results.
- Find the five-number summary of the data and construct a box-and-whisker plot.
- Are the following statements biased?
- You want to find out public opinion on whether teachers get paid a sufficient salary by interviewing the teachers in your school.
- You want to find out if your school needs to improve its communications with parents by sending home a survey written in English.
- “What time do students in your school get up in the morning during the school week?”
- Design the data collection sheet that can be used to collect this information.
- Conduct the survey. This activity is best done as a group with each person contributing at least 20 results.
- Make a stem-and-leaf plot of the data.
- Decide on an appropriate bin size and construct a frequency table.
- Make a histogram of the results.
- Find the five-number summary of the data and construct a box-and-whisker plot.
Mixed Review
- Write the equation containing (8, 1) and (4, –6) in point-slope form.
- What is the equation for the line perpendicular to this containing (0, 0)?
- What is the equation for the line parallel to this containing (4, 0)?
- Classify 641/3 according to the real number hierarchy.
- A ferry traveled to its destination, 22 miles across the harbor. On the first voyage, the ferry took 45 minutes. On the return trip, the ferry encountered a head wind and its trip took one hour, ten minutes. Find the speed of the ferry and the speed of the wind.
- Solve for a: 6a/(a−1) = 7/a+7.
- Simplify 718x2⋅9x14.
- Use long division to simplify: (3w3−6w2−27w+54)/(2w2−4w−30).
- A hot air balloon rises 16 meters every second.
- Is this an example of a linear function, a quadratic function, or an exponential function? Explain.
- At four seconds the balloon is 68.5 meters from the ground. What was its beginning height?
Vocabulary
| Term | Definition |
|---|---|
| bias | If the sample ends up with one or more sub-groups that are either over-represented or under-represented, then we say the sample is biased. |
| cherry picking | The practice of polling only those who you believe will support your cause is sometimes referred to as cherry picking. |
| non-response bias | Many surveys may have a non-response bias. In this case, a survey that is simply handed out gains few responses when compared to the number of surveys given out. People who are either too busy or simply not interested will be excluded from the results. Non-response bias may be reduced by conducting face-to-face interviews. |
| random samples | Random sampling is a method in which people are chosen out of the blue. In a true random sample, everyone in the population must have the same chance of being chosen. It is important that each person in the population has a chance of being picked. |
| sample size | The number of individuals, or objects, that are surveyed or tested in the study. |
| self-selection | Self-selected respondents who tend to have stronger opinions on subjects than others and are more motivated to respond may also cause bias. For this reason phone-in and online polls also tend to be poor representations of the overall population. |
| stratified samples | A method actively seeking to poll people from many different backgrounds. The population is first divided into different categories (or strata) and the number of members in each category is determined. |
| census | A census is an official enumeration of the entire population, with details as to age, sex, occupation, etc. |
| destructive study | A destructive study requires that the sample be ruined for its intended use by the study itself. One example is in the tests to see if cars are safe. |
| enumerate | Enumerate means to catalogue or list members independently. |
Additional Resources
Video: Sampling Techniques - Overview
Activities: Surveys and Samples Discussion Questions
Study Aids: Sampling
Practice: Surveys and Samples
Real World: Survey and Samples