
7.1: Binomial Experiments and Distributions
- Page ID
- 5734
\( \newcommand{\vecs}[1]{\overset { \scriptstyle \rightharpoonup} {\mathbf{#1}} } \)
\( \newcommand{\vecd}[1]{\overset{-\!-\!\rightharpoonup}{\vphantom{a}\smash {#1}}} \)
\( \newcommand{\dsum}{\displaystyle\sum\limits} \)
\( \newcommand{\dint}{\displaystyle\int\limits} \)
\( \newcommand{\dlim}{\displaystyle\lim\limits} \)
\( \newcommand{\id}{\mathrm{id}}\) \( \newcommand{\Span}{\mathrm{span}}\)
( \newcommand{\kernel}{\mathrm{null}\,}\) \( \newcommand{\range}{\mathrm{range}\,}\)
\( \newcommand{\RealPart}{\mathrm{Re}}\) \( \newcommand{\ImaginaryPart}{\mathrm{Im}}\)
\( \newcommand{\Argument}{\mathrm{Arg}}\) \( \newcommand{\norm}[1]{\| #1 \|}\)
\( \newcommand{\inner}[2]{\langle #1, #2 \rangle}\)
\( \newcommand{\Span}{\mathrm{span}}\)
\( \newcommand{\id}{\mathrm{id}}\)
\( \newcommand{\Span}{\mathrm{span}}\)
\( \newcommand{\kernel}{\mathrm{null}\,}\)
\( \newcommand{\range}{\mathrm{range}\,}\)
\( \newcommand{\RealPart}{\mathrm{Re}}\)
\( \newcommand{\ImaginaryPart}{\mathrm{Im}}\)
\( \newcommand{\Argument}{\mathrm{Arg}}\)
\( \newcommand{\norm}[1]{\| #1 \|}\)
\( \newcommand{\inner}[2]{\langle #1, #2 \rangle}\)
\( \newcommand{\Span}{\mathrm{span}}\) \( \newcommand{\AA}{\unicode[.8,0]{x212B}}\)
\( \newcommand{\vectorA}[1]{\vec{#1}} % arrow\)
\( \newcommand{\vectorAt}[1]{\vec{\text{#1}}} % arrow\)
\( \newcommand{\vectorB}[1]{\overset { \scriptstyle \rightharpoonup} {\mathbf{#1}} } \)
\( \newcommand{\vectorC}[1]{\textbf{#1}} \)
\( \newcommand{\vectorD}[1]{\overrightarrow{#1}} \)
\( \newcommand{\vectorDt}[1]{\overrightarrow{\text{#1}}} \)
\( \newcommand{\vectE}[1]{\overset{-\!-\!\rightharpoonup}{\vphantom{a}\smash{\mathbf {#1}}}} \)
\( \newcommand{\vecs}[1]{\overset { \scriptstyle \rightharpoonup} {\mathbf{#1}} } \)
\(\newcommand{\longvect}{\overrightarrow}\)
\( \newcommand{\vecd}[1]{\overset{-\!-\!\rightharpoonup}{\vphantom{a}\smash {#1}}} \)
\(\newcommand{\avec}{\mathbf a}\) \(\newcommand{\bvec}{\mathbf b}\) \(\newcommand{\cvec}{\mathbf c}\) \(\newcommand{\dvec}{\mathbf d}\) \(\newcommand{\dtil}{\widetilde{\mathbf d}}\) \(\newcommand{\evec}{\mathbf e}\) \(\newcommand{\fvec}{\mathbf f}\) \(\newcommand{\nvec}{\mathbf n}\) \(\newcommand{\pvec}{\mathbf p}\) \(\newcommand{\qvec}{\mathbf q}\) \(\newcommand{\svec}{\mathbf s}\) \(\newcommand{\tvec}{\mathbf t}\) \(\newcommand{\uvec}{\mathbf u}\) \(\newcommand{\vvec}{\mathbf v}\) \(\newcommand{\wvec}{\mathbf w}\) \(\newcommand{\xvec}{\mathbf x}\) \(\newcommand{\yvec}{\mathbf y}\) \(\newcommand{\zvec}{\mathbf z}\) \(\newcommand{\rvec}{\mathbf r}\) \(\newcommand{\mvec}{\mathbf m}\) \(\newcommand{\zerovec}{\mathbf 0}\) \(\newcommand{\onevec}{\mathbf 1}\) \(\newcommand{\real}{\mathbb R}\) \(\newcommand{\twovec}[2]{\left[\begin{array}{r}#1 \\ #2 \end{array}\right]}\) \(\newcommand{\ctwovec}[2]{\left[\begin{array}{c}#1 \\ #2 \end{array}\right]}\) \(\newcommand{\threevec}[3]{\left[\begin{array}{r}#1 \\ #2 \\ #3 \end{array}\right]}\) \(\newcommand{\cthreevec}[3]{\left[\begin{array}{c}#1 \\ #2 \\ #3 \end{array}\right]}\) \(\newcommand{\fourvec}[4]{\left[\begin{array}{r}#1 \\ #2 \\ #3 \\ #4 \end{array}\right]}\) \(\newcommand{\cfourvec}[4]{\left[\begin{array}{c}#1 \\ #2 \\ #3 \\ #4 \end{array}\right]}\) \(\newcommand{\fivevec}[5]{\left[\begin{array}{r}#1 \\ #2 \\ #3 \\ #4 \\ #5 \\ \end{array}\right]}\) \(\newcommand{\cfivevec}[5]{\left[\begin{array}{c}#1 \\ #2 \\ #3 \\ #4 \\ #5 \\ \end{array}\right]}\) \(\newcommand{\mattwo}[4]{\left[\begin{array}{rr}#1 \amp #2 \\ #3 \amp #4 \\ \end{array}\right]}\) \(\newcommand{\laspan}[1]{\text{Span}\{#1\}}\) \(\newcommand{\bcal}{\cal B}\) \(\newcommand{\ccal}{\cal C}\) \(\newcommand{\scal}{\cal S}\) \(\newcommand{\wcal}{\cal W}\) \(\newcommand{\ecal}{\cal E}\) \(\newcommand{\coords}[2]{\left\{#1\right\}_{#2}}\) \(\newcommand{\gray}[1]{\color{gray}{#1}}\) \(\newcommand{\lgray}[1]{\color{lightgray}{#1}}\) \(\newcommand{\rank}{\operatorname{rank}}\) \(\newcommand{\row}{\text{Row}}\) \(\newcommand{\col}{\text{Col}}\) \(\renewcommand{\row}{\text{Row}}\) \(\newcommand{\nul}{\text{Nul}}\) \(\newcommand{\var}{\text{Var}}\) \(\newcommand{\corr}{\text{corr}}\) \(\newcommand{\len}[1]{\left|#1\right|}\) \(\newcommand{\bbar}{\overline{\bvec}}\) \(\newcommand{\bhat}{\widehat{\bvec}}\) \(\newcommand{\bperp}{\bvec^\perp}\) \(\newcommand{\xhat}{\widehat{\xvec}}\) \(\newcommand{\vhat}{\widehat{\vvec}}\) \(\newcommand{\uhat}{\widehat{\uvec}}\) \(\newcommand{\what}{\widehat{\wvec}}\) \(\newcommand{\Sighat}{\widehat{\Sigma}}\) \(\newcommand{\lt}{<}\) \(\newcommand{\gt}{>}\) \(\newcommand{\amp}{&}\) \(\definecolor{fillinmathshade}{gray}{0.9}\)Binomial Distributions
In previous concepts, you learned to calculate the probability of an event occurring in a binomial experiment. For example:
- What is the probability of flipping exactly two heads when a coin is flipped ten times?
- What is the probability of rolling a 2 exactly twice in 15 rolls of a fair die?
There are a few important characteristics of a binomial experiment. First, there must be only two possible outcomes of each trial. The probability of success in each trial must be the same. The results of each trial must be independent of one another.
Flipping a coin has only two outcomes (heads and not heads). Each outcome has a 50% chance of success. Each coin flip is independent of previous coin flips. If I observe 4 heads in a row, the probability of the next flip resulting in a heads is still 50%.
Verifying these three conditions is important for helping us identify binomial experiments. Once we have a binomial experiment and we can identify a few pieces of information (like n, a, p and q), then we can use the general formula for finding the probability of each possible outcome.
There are several reasons why we want to calculate each possible outcome. We can chart the probabilities of the different outcomes in a distribution. This will allow us to identify patterns and compare the different probabilities visually. This helps with making predictions about the outcomes of future experiments and gives additional information about how many trials would be necessary to draw useful conclusions.
In previous Concepts, you did a little work generating the formula used to calculate probabilities for binomial experiments. Here is the general formula for finding the probability of a binomial experiment.
The probability of getting X successes in n trials is given by:
P(X=a)=nCa×pa×q(n−a)
where:
- a is the number of successes from the trials.
- p is the probability of success.
- q is the probability of failure.
One of the reasons why we study binomial distributions is because they use discrete data to approximate a normal distribution which focuses on continuous data. The more trials there are in the experiment, the better this approximation is.
Calculating Probability
1. What is the probability of rolling a 2 exactly four times when rolling a fair die 10 times?
2. Owen flips a coin 3 times. Find the probability of flipping exactly 0, 1, 2 and 3 heads.
First, verify that this is a binomial experiment. Each coin flip is heads or not heads. The probability of getting heads is always 50%. The probability of getting heads is not impacted by the previous coin flip.
Second, calculate the probability for each of the four cases.
There are 3 trials so n=3. A success is getting a heads, so a is the number of heads. We will have to use the formula four times with a=0, a=1, a=2 and a=3 to calculate all the different probabilities. The probability of success is 1/2 so p=1/2. The probability of failure is 1−1/2=1/2 so q=1/2.
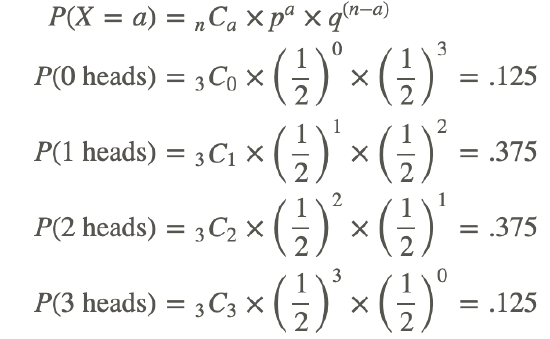
Notes: The probabilities add up to 1. In this case they are symmetrical like the famous bell curve known as the normal distribution.
3. Mark is taking a multiple choice quiz that he did not study for. There are 10 questions on the quiz and each question has 4 possible answer choices. What is the probability that Mark will pass the quiz with a score of 6 or better if he guesses randomly on each question?
First, verify that this is a binomial experiment. Each question is either right or wrong. The probability of guessing right on each question is the same at 25%. Guessing one question right does not impact guessing the next right or wrong (the trials are independent).
Second, calculate the probability for each possible outcome.
n=10
p=0.25
q=0.75
a=is the score being calculated
| X (Mark's Score) | Probability |
|---|---|
| 0 | 10C0×.250×.7510=.056 |
| 1 | 10C1×.251×.759=.188 |
| 2 | 10C2×.252×.758=.282 |
| 3 | 10C3×.253×.757=.250 |
| 4 | 10C4×.254×.756=.146 |
| 5 | 10C5×.255×.755=.058 |
| 6 | 10C6×.256×.754=.016 |
| 7 | 10C7×.257×.753=.003 |
| 8 | 10C8×.258×.752=.000 |
| 9 | 10C9×.259×.751=.000 |
| 10 | 10C10×.2510×.750=.000 |
Note: The probabilities for Mark scoring an 8, 9 or 10 are written as .000 because, while possible, each probability is so small that when rounded to 3 decimal places it becomes 0.
Now we can plot a probability distribution and see that Mark is likely to get a few questions right, but he probably will not pass.
The probability of Mark passing will be P(X=6)+P(X=7)+P(X=8)+P(X=9)+P(X=10)=.019.
Example
Example 1
A coin is tossed 5 times. Find the probability of getting exactly 3 heads.
There are 5 trials, so n=5.
A success is getting a head. We are interested in exactly 3 successes. Therefore, a=3.
The probability of a success is 0.5, and, thus, p=0.5.
Therefore, the probability of a failure is 1−0.5, or 0.5. From this, you know that q=0.5.
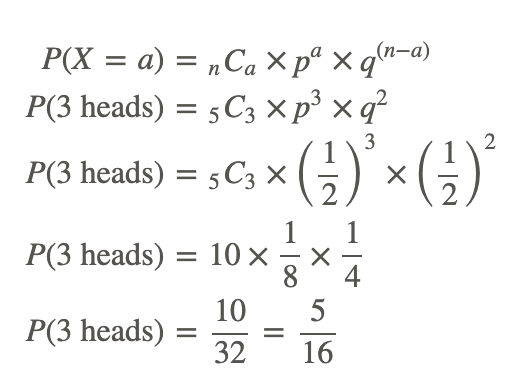
Therefore, the probability of seeing exactly 3 heads in 5 tosses is 5/16, or 31.25%.
Explore More
- Look at the following graphs and indicate whether they could be binomial distributions. Explain how you know.
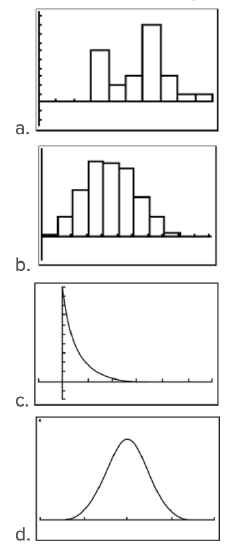
2. In question 1, suppose that the graphs that could be binomial distributions actually are binomial distributions. Which of these binomial distributions most closely approximates a normal distribution?
3. Look at the following graphs and indicate whether they could be binomial distributions. Explain how you know.
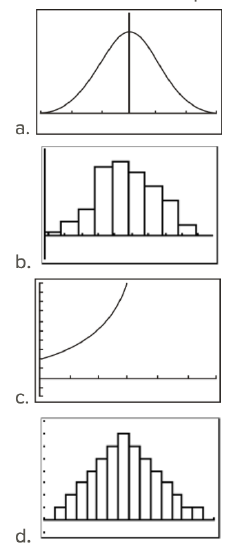
4. In question 3, suppose that the graphs that could be binomial distributions actually are binomial distributions. Which of these binomial distributions most closely approximates a normal distribution?
5. A coin is tossed 7 times. What is the probability of getting exactly 4 heads?
6. A coin is tossed 9 times. What is the probability of getting exactly 3 tails?
7. A coin is tossed 8 times. What is the probability of getting exactly 6 heads?
8. A coin is tossed 6 times. What is the probability of getting exactly 2 tails?
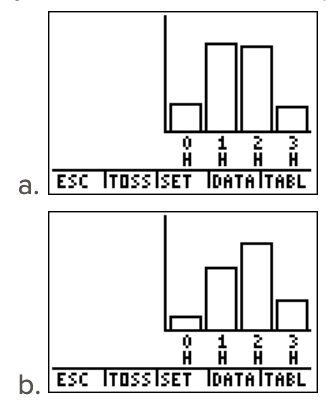
9. Each citizen in the town of North Liberty flipped a coin 3 times and recorded the number of heads, as did each resident in the town of South Hampton. North Liberty has 25 residents, while South Hampton has 750 residents. If the frequencies of the numbers of heads were graphed for each town, which town's graph would more likely approximate a normal distribution? Explain your answer.
10. The coin flips for North Liberty and South Hampton in question 9 were simulated with the TI-84 calculator as shown below. Which graph is most likely the one for North Liberty? Which graph is most likely the one for South Hampton? Explain your answer.
Vocabulary
| Term | Definition |
|---|---|
| binomial experiments | Binomial experiments are experiments that include only two choices, with distributions that involve a discrete number of trials of these two possible outcomes. |
| binomial random variable | A binomial random variable is a type of random variable that can only be used to count whether a certain event occurs or does not occur. |
Additional Resources
Video: Binomial Distributions Principles
Activities: Binomial Distributions Discussion Questions
Study Aids: Binomial Probability Distribution Study Guide
Lesson Plans: Binomial Distributions Lesson Plan
Practice: Binomial Experiments and Distributions
Real World: Binomial Distributions