
8.3: Margin of Error
- Page ID
- 5745
\( \newcommand{\vecs}[1]{\overset { \scriptstyle \rightharpoonup} {\mathbf{#1}} } \)
\( \newcommand{\vecd}[1]{\overset{-\!-\!\rightharpoonup}{\vphantom{a}\smash {#1}}} \)
\( \newcommand{\dsum}{\displaystyle\sum\limits} \)
\( \newcommand{\dint}{\displaystyle\int\limits} \)
\( \newcommand{\dlim}{\displaystyle\lim\limits} \)
\( \newcommand{\id}{\mathrm{id}}\) \( \newcommand{\Span}{\mathrm{span}}\)
( \newcommand{\kernel}{\mathrm{null}\,}\) \( \newcommand{\range}{\mathrm{range}\,}\)
\( \newcommand{\RealPart}{\mathrm{Re}}\) \( \newcommand{\ImaginaryPart}{\mathrm{Im}}\)
\( \newcommand{\Argument}{\mathrm{Arg}}\) \( \newcommand{\norm}[1]{\| #1 \|}\)
\( \newcommand{\inner}[2]{\langle #1, #2 \rangle}\)
\( \newcommand{\Span}{\mathrm{span}}\)
\( \newcommand{\id}{\mathrm{id}}\)
\( \newcommand{\Span}{\mathrm{span}}\)
\( \newcommand{\kernel}{\mathrm{null}\,}\)
\( \newcommand{\range}{\mathrm{range}\,}\)
\( \newcommand{\RealPart}{\mathrm{Re}}\)
\( \newcommand{\ImaginaryPart}{\mathrm{Im}}\)
\( \newcommand{\Argument}{\mathrm{Arg}}\)
\( \newcommand{\norm}[1]{\| #1 \|}\)
\( \newcommand{\inner}[2]{\langle #1, #2 \rangle}\)
\( \newcommand{\Span}{\mathrm{span}}\) \( \newcommand{\AA}{\unicode[.8,0]{x212B}}\)
\( \newcommand{\vectorA}[1]{\vec{#1}} % arrow\)
\( \newcommand{\vectorAt}[1]{\vec{\text{#1}}} % arrow\)
\( \newcommand{\vectorB}[1]{\overset { \scriptstyle \rightharpoonup} {\mathbf{#1}} } \)
\( \newcommand{\vectorC}[1]{\textbf{#1}} \)
\( \newcommand{\vectorD}[1]{\overrightarrow{#1}} \)
\( \newcommand{\vectorDt}[1]{\overrightarrow{\text{#1}}} \)
\( \newcommand{\vectE}[1]{\overset{-\!-\!\rightharpoonup}{\vphantom{a}\smash{\mathbf {#1}}}} \)
\( \newcommand{\vecs}[1]{\overset { \scriptstyle \rightharpoonup} {\mathbf{#1}} } \)
\(\newcommand{\longvect}{\overrightarrow}\)
\( \newcommand{\vecd}[1]{\overset{-\!-\!\rightharpoonup}{\vphantom{a}\smash {#1}}} \)
\(\newcommand{\avec}{\mathbf a}\) \(\newcommand{\bvec}{\mathbf b}\) \(\newcommand{\cvec}{\mathbf c}\) \(\newcommand{\dvec}{\mathbf d}\) \(\newcommand{\dtil}{\widetilde{\mathbf d}}\) \(\newcommand{\evec}{\mathbf e}\) \(\newcommand{\fvec}{\mathbf f}\) \(\newcommand{\nvec}{\mathbf n}\) \(\newcommand{\pvec}{\mathbf p}\) \(\newcommand{\qvec}{\mathbf q}\) \(\newcommand{\svec}{\mathbf s}\) \(\newcommand{\tvec}{\mathbf t}\) \(\newcommand{\uvec}{\mathbf u}\) \(\newcommand{\vvec}{\mathbf v}\) \(\newcommand{\wvec}{\mathbf w}\) \(\newcommand{\xvec}{\mathbf x}\) \(\newcommand{\yvec}{\mathbf y}\) \(\newcommand{\zvec}{\mathbf z}\) \(\newcommand{\rvec}{\mathbf r}\) \(\newcommand{\mvec}{\mathbf m}\) \(\newcommand{\zerovec}{\mathbf 0}\) \(\newcommand{\onevec}{\mathbf 1}\) \(\newcommand{\real}{\mathbb R}\) \(\newcommand{\twovec}[2]{\left[\begin{array}{r}#1 \\ #2 \end{array}\right]}\) \(\newcommand{\ctwovec}[2]{\left[\begin{array}{c}#1 \\ #2 \end{array}\right]}\) \(\newcommand{\threevec}[3]{\left[\begin{array}{r}#1 \\ #2 \\ #3 \end{array}\right]}\) \(\newcommand{\cthreevec}[3]{\left[\begin{array}{c}#1 \\ #2 \\ #3 \end{array}\right]}\) \(\newcommand{\fourvec}[4]{\left[\begin{array}{r}#1 \\ #2 \\ #3 \\ #4 \end{array}\right]}\) \(\newcommand{\cfourvec}[4]{\left[\begin{array}{c}#1 \\ #2 \\ #3 \\ #4 \end{array}\right]}\) \(\newcommand{\fivevec}[5]{\left[\begin{array}{r}#1 \\ #2 \\ #3 \\ #4 \\ #5 \\ \end{array}\right]}\) \(\newcommand{\cfivevec}[5]{\left[\begin{array}{c}#1 \\ #2 \\ #3 \\ #4 \\ #5 \\ \end{array}\right]}\) \(\newcommand{\mattwo}[4]{\left[\begin{array}{rr}#1 \amp #2 \\ #3 \amp #4 \\ \end{array}\right]}\) \(\newcommand{\laspan}[1]{\text{Span}\{#1\}}\) \(\newcommand{\bcal}{\cal B}\) \(\newcommand{\ccal}{\cal C}\) \(\newcommand{\scal}{\cal S}\) \(\newcommand{\wcal}{\cal W}\) \(\newcommand{\ecal}{\cal E}\) \(\newcommand{\coords}[2]{\left\{#1\right\}_{#2}}\) \(\newcommand{\gray}[1]{\color{gray}{#1}}\) \(\newcommand{\lgray}[1]{\color{lightgray}{#1}}\) \(\newcommand{\rank}{\operatorname{rank}}\) \(\newcommand{\row}{\text{Row}}\) \(\newcommand{\col}{\text{Col}}\) \(\renewcommand{\row}{\text{Row}}\) \(\newcommand{\nul}{\text{Nul}}\) \(\newcommand{\var}{\text{Var}}\) \(\newcommand{\corr}{\text{corr}}\) \(\newcommand{\len}[1]{\left|#1\right|}\) \(\newcommand{\bbar}{\overline{\bvec}}\) \(\newcommand{\bhat}{\widehat{\bvec}}\) \(\newcommand{\bperp}{\bvec^\perp}\) \(\newcommand{\xhat}{\widehat{\xvec}}\) \(\newcommand{\vhat}{\widehat{\vvec}}\) \(\newcommand{\uhat}{\widehat{\uvec}}\) \(\newcommand{\what}{\widehat{\wvec}}\) \(\newcommand{\Sighat}{\widehat{\Sigma}}\) \(\newcommand{\lt}{<}\) \(\newcommand{\gt}{>}\) \(\newcommand{\amp}{&}\) \(\definecolor{fillinmathshade}{gray}{0.9}\)
“Wow! A large donation was made to the school! It says more than half is going to the new track. That’s awesome!” Sam said at breakfast as he read the newspaper over his Dad’s shoulder.
“Well, I don’t want to disappoint you Sam, but it’s 53% with a 5% margin of error,” his Dad explained.
“What does that have to do with anything?” Sam asked.
“A margin of error can mean that the survey results aren’t completely accurate. You could say that you can’t take them at face value,” his Dad said.
Sam is perplexed. 53% is 53%, or is it?
In this concept, you will learn to interpret data.
Data
Drawing conclusions based on data is a major goal in gathering data. Some data can be misleading and some conclusions can be doubtful. For that reason, it is important to keep an eye open for public information that may not be entirely based on data. You must be critical about where information comes from because biases may occur in the sampling methods, survey questions, display methods, and conclusions. Nevertheless, good science and math can lead to valuable information.
Let’s look at how you can make predictions based on survey data.
A cellular phone company conducts a random survey in their service area regarding the problems encountered with phone service. They surveyed 700 people with cellular phones in a population of 125,000 people. They find the following results.
Too expensive: 39%
Poor Signal: 33%
Not enough features: 16%
Lack of support: 12%
Based on their survey, they can extrapolate the data to the entire population. In other words, when the survey was carried out in a proper manner, they can assume that the survey is accurate for the entire population. If there are 125,000 people in the population, they can assume that the same results found in the survey will be true for all of the 125,000 people. So, how many people will find the phones too expensive? Signal quality poor? Too few features?
First, calculate the percent found in the data of the entire population.
Too expensive: 39%
39/100×125000=48750
Therefore, 48,750 people from the entire population would consider the phone service was too expensive.
Poor Signal: 33%
33/100×125000=41250
Therefore, 41,250 people from the entire population would consider the phone service had a poor signal.
Not enough features: 16%
16/100×125000=20000
Therefore, 20,000 people from the entire population would consider the phone service had too few features.
Lack of support: 12%
12/100×125000=15000
Therefore, 15,000 people from the entire population would consider the phone service did not provide enough support.
Let’s think about margin of error. Margin of error is a range of values above and below a statistic.
There will always be a margin of error, or a percentage by which the true numbers for the entire population may differ.
For example, a survey company may calculate a margin of error of ± 3%. This means that the measurements for the entire population may vary either up or down by 3%.
As you know, the method of choosing samples is important to find data you can trust. The better the sampling method is the better the data collected. When data is gathered well, its results will be truer for the entire population. Nevertheless, most research companies and survey takers understand that it is actually quite difficult to find a perfect sample.
Let’s look at an example.
A survey company reports that 51% of people surveyed said they will vote for Candidate X (with a margin of error of ±3%). What range of voter percentage does this represent?
First, calculate the lower limit.
51−3=48
The lower limit is 48%.
Next, calculate the upper limit.
51+3=54
The upper limit is 54%.
The answer is that 51% ±3% gives a range of 48% to 54% that will vote for Candidate X .
In modern media, particularly newspapers and magazines, it is common to find reports based on survey results. Often times a margin of error is mentioned.
Let’s look at another example.
A local newspaper article entitled “More Beets than Meats” discusses more people switching over to vegetarianism. The article says, “In a hundred people surveyed in 1998, 8% reported being a vegetarian. In a similar survey taken in 2000, that number grew by 50% to 12% (margin of error in surveys ±3%). It’s a great time to invest in produce companies because that number will just keep on growing!”
First, calculate the lower limit for the years 1998 and 2000.
1998
8−3=5
2000
12−3=9
Next, calculate the upper limit for the years 1998 and 2000.
1998
8+3=11
2000
12+3=15
Then, examine the article itself. This article reports that the number of vegetarians grew by 50%. However, it also reports a margin of error of ±3%. This means that the actual results may have been as high as 11% vegetarians in 1998 and as low as 9% vegetarians in 2000. It is possible that the number of vegetarians actually declined.
Also, even if the number of vegetarians did increase by 50% during those two years, it does not mean that the number will continue to increase at that rate.
Finally, there is no mention of the sampling method. The method they used may not have been representative of the entire population.
Examples
Example 1
Earlier, you were given a problem about Sam and his Dad talking about the donation made to the school.
Sam’s Dad had explained that 53% of the donation with a margin of error of 5% was allotted for the new track. Sam does not understand. You need to explain it to him.
First, calculate the lower limit.
53−5=48
The lower limit is 48%.
Next, calculate the upper limit.
53+5=58
The upper limit is 58%.
The answer is that 53% ± 5% gives a range of 48% to 58% of the money donated will be allotted for the new track.
Example 2
A high school conducts a survey for their foreign language program. They need to know how many sections of each class they need. There are 3,400 students in the high school and each class can have a maximum of 35 students in it. Of 200 students surveyed, they find the following number of student responses.
Spanish: 85
French: 35
German: 39
Chinese: 23
None: 18
How many classes for each language should the school offer?
First, find the percentage of the respondents for each language class.
Spanish
85/200×100=42.5%
French
35/200×100=17.5%
German
39/200×100=19.5%
Chinese
23/200×100=11.5%
None
18/200×100=9%
Next, calculate the number of students in the entire student population that will want to take these language courses. Remember there are 3400 students in the school.
Spanish
42.5/100×3400=1445
French
17.5/100×3400=595
German
19.5/100×3400=663
Chinese
11.5/100×3400=391
None
9/100×3400=306
Then, calculate the number of classes for each language. Remember that a class can have a maximum of 35 students.
Spanish
1445/35=41.3
French
595/35=17
German
663/35=18.9
Chinese
391/35=11.2
None
306/35=8.7
The answers are 41.3, 17, 18.9, 11.2, and 8.7. Therefore, the answers are the school needs 42 Spanish language classes, 17 French language classes, 19 German language classes, 12 Chinese language classes, and 9 classes remain that do not offer a second language.
Because 35 is the maximum number of students, the number of classes must be rounded up to the next whole number. Classes cannot go over 35 and fractional classes cannot be offered.
All 450 students in the graduating class at Springstead High School were surveyed about homework. 27% said they wanted more homework, while 73% said they wanted less homework.
Example 3
If the margin of error was 3%, how would this impact the percentages?
First, calculate the lower limit for those who want more homework and those who do not.
Want more homework
27−3=24
Want less homework
73−3=70
Next, calculate the upper limit for those who want more homework and those who do not.
Want more homework
27+3=30
Want less homework
73+3=76
The upper limit is 54%.
The answer is that 51%±3% gives a range of 48% to 54% that will vote for Candidate X .
The answer is 24% to 30% of the students want more homework and 70% to 76% of the students want less homework.
Example 4
How many students wanted more homework?
First, calculate the number of students for the lower limit. Remember there are 450 students in the school.
24/100×450=108
Next, calculate the number of students for the upper limit.
30/100×450=135
The answers are 108 and 135. Therefore between 108 and 135 of the 450 students want more homework.
Example 5
How many students wanted less homework?
First, calculate the number of students for the lower limit. Remember there are 450 students in the school.
70/100×450=315
Next, calculate the number of students for the upper limit.
76/100×450=342
The answers are 315 and 342. Therefore between 315 and 342 of the 450 students want less homework.
Review
A job satisfaction survey is taken of 500 people who work in the auto industry. The results are shown in the table below:
| Very Dissatisfied | Dissatisfied | Satisfied | Very Satisfied |
| 16% | 21% | 41% | 22% |
1. Based on the margin of error, find the percent range of responses in each category.
2. Assuming that there are 340,000 people in the industry, how many people are dissatisfied?
3. Assuming that there are 340,000 people in the industry, how many people are satisfied?
4. Assuming that there are 340,000 people in the industry, how many people are very satisfied?
5. Assuming that there are 340,000 people in the industry, how many people are very dissatisfied?
6. What conclusions can you draw based upon this data?
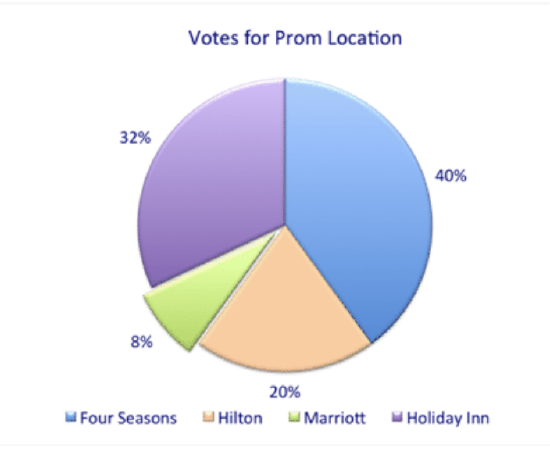
Look at the chart regarding the Prom Location. Assume a margin of error of ±5%.
Moyan Brenn;Roman Boed -https://www.flickr.com/photos/aigle_dore/7052753377/in/photolist-bKecSa-ciyUUy-dEpG5A-86KxQn-pB92Sx-EtgMZ-rudfcp-7NXXqY-qDeQMY-fyydD5-q6UuCd-dRU16M-8oHs4W-7jbxt-d2kVuo-9W9cqP-qGUz4M-ey5CVs-7ajhf-71UN8-dxCp68-pnbZdd-7ajhh-AJf9t-6kFRLu-9o1UN2-xuAkG-4zPqEY-cFT8B7-m73hZe-63DndZ-fkHdYj-5jGvWA-nsnByK-7SypUW-hZyg6F-eeB1Ct-aUtviX-aZJ99z-6WrH1u-6y2YrT-dVLedP-nybqqq-hcbejM-bBDTvV-qmrBHo-4M8vHT-c2qha-rz9KVV-qy3FkZ;https://www.flickr.com/photos/romanboed/8842824530/in/photolist-etpMDU-etpnQm-mFobLp-etmHWc-n7K1sM-n7LxQ6-n7M4Vf-etmzHp-etkYyM-etpYtW-etpq9N-etmdnM-n7KWZV-etmgBk-etpJtG-etmwDH-etpHY5-etpU2w-etpXrj-etpdkS-etptHq-etm6Wz-n7MzbD-n7LRxP-etpG7w-etmBDZ-qrD8jQ-ebh8fR-qdfw4z-qTmDcL-82jAok-qk7fZT-bvUX5j-povzX8-qf7vrs-qZFuZK-qtKskg-pMUVCr-qcnrUf-eaCRqa-qd37Xj-qsLDiC-rxeJYQ-rueZW9-pMFMvG-quofy1-qduPwo-qcmEhm-qJFTfD-qHR3JT
7. If the school has 420 students planning to attend, what is the percent range of students who will prefer each of the locations?
8. How many students want the Holiday Inn?
9. How many students want the Hilton?
10. How many students want the Marriott?
11. How many students want the Four Seasons?
12. What conclusions can you draw from the data A college newspaper reports the following:
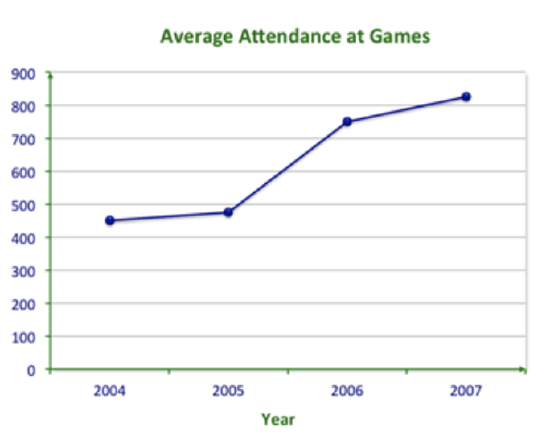
“Ever since the new volleyball stadium was built at the end of 2005, the interest in the Women’s Volleyball Team has grown. In turn, that has made the team go nearly perfect this year. Their current record is 14 wins and 3 losses. Last year at this time, they were only 13 and 4. Come and see the new stadium and encourage the college to build the new football stadium, too!”
Moyan Brenn;Roman Boed - https://www.flickr.com/photos/aigle_dore/7052753377/in/photolist-bKecSa-ciyUUy-dEpG5A-86KxQn-pB92Sx-EtgMZ-rudfcp-7NXXqY-qDeQMY-fyydD5-q6UuCd-dRU16M-8oHs4W-7jbxt-d2kVuo-9W9cqP-qGUz4M-ey5CVs-7ajhf-71UN8-dxCp68-pnbZdd-7ajhh-AJf9t-6kFRLu-9o1UN2-xuAkG-4zPqEY-cFT8B7-m73hZe-63DndZ-fkHdYj-5jGvWA-nsnByK-7SypUW-hZyg6F-eeB1Ct-aUtviX-aZJ99z-6WrH1u-6y2YrT-dVLedP-nybqqq-hcbejM-bBDTvV-qmrBHo-4M8vHT-c2qha-rz9KVV-qy3FkZ;https://www.flickr.com/photos/romanboed/8842824530/in/photolist-etpMDU-etpnQm-mFobLp-etmHWc-n7K1sM-n7LxQ6-n7M4Vf-etmzHp-etkYyM-etpYtW-etpq9N-etmdnM-n7KWZV-etmgBk-etpJtG-etmwDH-etpHY5-etpU2w-etpXrj-etpdkS-etptHq-etm6Wz-n7MzbD-n7LRxP-etpG7w-etmBDZ-qrD8jQ-ebh8fR-qdfw4z-qTmDcL-82jAok-qk7fZT-bvUX5j-povzX8-qf7vrs-qZFuZK-qtKskg-pMUVCr-qcnrUf-eaCRqa-qd37Xj-qsLDiC-rxeJYQ-rueZW9-pMFMvG-quofy1-qduPwo-qcmEhm-qJFTfD-qHR3JT
13. What conclusions have been drawn by the writer of this article?
14. Do you agree with them? Why or why not?
15. What bias might the writer have had?
Vocabulary
| Term | Definition |
|---|---|
| Margin of Error | A percentage by which the true number for the entire population may differ. |