
9.6: Significance Test for a Mean
- Page ID
- 5788
\( \newcommand{\vecs}[1]{\overset { \scriptstyle \rightharpoonup} {\mathbf{#1}} } \)
\( \newcommand{\vecd}[1]{\overset{-\!-\!\rightharpoonup}{\vphantom{a}\smash {#1}}} \)
\( \newcommand{\dsum}{\displaystyle\sum\limits} \)
\( \newcommand{\dint}{\displaystyle\int\limits} \)
\( \newcommand{\dlim}{\displaystyle\lim\limits} \)
\( \newcommand{\id}{\mathrm{id}}\) \( \newcommand{\Span}{\mathrm{span}}\)
( \newcommand{\kernel}{\mathrm{null}\,}\) \( \newcommand{\range}{\mathrm{range}\,}\)
\( \newcommand{\RealPart}{\mathrm{Re}}\) \( \newcommand{\ImaginaryPart}{\mathrm{Im}}\)
\( \newcommand{\Argument}{\mathrm{Arg}}\) \( \newcommand{\norm}[1]{\| #1 \|}\)
\( \newcommand{\inner}[2]{\langle #1, #2 \rangle}\)
\( \newcommand{\Span}{\mathrm{span}}\)
\( \newcommand{\id}{\mathrm{id}}\)
\( \newcommand{\Span}{\mathrm{span}}\)
\( \newcommand{\kernel}{\mathrm{null}\,}\)
\( \newcommand{\range}{\mathrm{range}\,}\)
\( \newcommand{\RealPart}{\mathrm{Re}}\)
\( \newcommand{\ImaginaryPart}{\mathrm{Im}}\)
\( \newcommand{\Argument}{\mathrm{Arg}}\)
\( \newcommand{\norm}[1]{\| #1 \|}\)
\( \newcommand{\inner}[2]{\langle #1, #2 \rangle}\)
\( \newcommand{\Span}{\mathrm{span}}\) \( \newcommand{\AA}{\unicode[.8,0]{x212B}}\)
\( \newcommand{\vectorA}[1]{\vec{#1}} % arrow\)
\( \newcommand{\vectorAt}[1]{\vec{\text{#1}}} % arrow\)
\( \newcommand{\vectorB}[1]{\overset { \scriptstyle \rightharpoonup} {\mathbf{#1}} } \)
\( \newcommand{\vectorC}[1]{\textbf{#1}} \)
\( \newcommand{\vectorD}[1]{\overrightarrow{#1}} \)
\( \newcommand{\vectorDt}[1]{\overrightarrow{\text{#1}}} \)
\( \newcommand{\vectE}[1]{\overset{-\!-\!\rightharpoonup}{\vphantom{a}\smash{\mathbf {#1}}}} \)
\( \newcommand{\vecs}[1]{\overset { \scriptstyle \rightharpoonup} {\mathbf{#1}} } \)
\(\newcommand{\longvect}{\overrightarrow}\)
\( \newcommand{\vecd}[1]{\overset{-\!-\!\rightharpoonup}{\vphantom{a}\smash {#1}}} \)
\(\newcommand{\avec}{\mathbf a}\) \(\newcommand{\bvec}{\mathbf b}\) \(\newcommand{\cvec}{\mathbf c}\) \(\newcommand{\dvec}{\mathbf d}\) \(\newcommand{\dtil}{\widetilde{\mathbf d}}\) \(\newcommand{\evec}{\mathbf e}\) \(\newcommand{\fvec}{\mathbf f}\) \(\newcommand{\nvec}{\mathbf n}\) \(\newcommand{\pvec}{\mathbf p}\) \(\newcommand{\qvec}{\mathbf q}\) \(\newcommand{\svec}{\mathbf s}\) \(\newcommand{\tvec}{\mathbf t}\) \(\newcommand{\uvec}{\mathbf u}\) \(\newcommand{\vvec}{\mathbf v}\) \(\newcommand{\wvec}{\mathbf w}\) \(\newcommand{\xvec}{\mathbf x}\) \(\newcommand{\yvec}{\mathbf y}\) \(\newcommand{\zvec}{\mathbf z}\) \(\newcommand{\rvec}{\mathbf r}\) \(\newcommand{\mvec}{\mathbf m}\) \(\newcommand{\zerovec}{\mathbf 0}\) \(\newcommand{\onevec}{\mathbf 1}\) \(\newcommand{\real}{\mathbb R}\) \(\newcommand{\twovec}[2]{\left[\begin{array}{r}#1 \\ #2 \end{array}\right]}\) \(\newcommand{\ctwovec}[2]{\left[\begin{array}{c}#1 \\ #2 \end{array}\right]}\) \(\newcommand{\threevec}[3]{\left[\begin{array}{r}#1 \\ #2 \\ #3 \end{array}\right]}\) \(\newcommand{\cthreevec}[3]{\left[\begin{array}{c}#1 \\ #2 \\ #3 \end{array}\right]}\) \(\newcommand{\fourvec}[4]{\left[\begin{array}{r}#1 \\ #2 \\ #3 \\ #4 \end{array}\right]}\) \(\newcommand{\cfourvec}[4]{\left[\begin{array}{c}#1 \\ #2 \\ #3 \\ #4 \end{array}\right]}\) \(\newcommand{\fivevec}[5]{\left[\begin{array}{r}#1 \\ #2 \\ #3 \\ #4 \\ #5 \\ \end{array}\right]}\) \(\newcommand{\cfivevec}[5]{\left[\begin{array}{c}#1 \\ #2 \\ #3 \\ #4 \\ #5 \\ \end{array}\right]}\) \(\newcommand{\mattwo}[4]{\left[\begin{array}{rr}#1 \amp #2 \\ #3 \amp #4 \\ \end{array}\right]}\) \(\newcommand{\laspan}[1]{\text{Span}\{#1\}}\) \(\newcommand{\bcal}{\cal B}\) \(\newcommand{\ccal}{\cal C}\) \(\newcommand{\scal}{\cal S}\) \(\newcommand{\wcal}{\cal W}\) \(\newcommand{\ecal}{\cal E}\) \(\newcommand{\coords}[2]{\left\{#1\right\}_{#2}}\) \(\newcommand{\gray}[1]{\color{gray}{#1}}\) \(\newcommand{\lgray}[1]{\color{lightgray}{#1}}\) \(\newcommand{\rank}{\operatorname{rank}}\) \(\newcommand{\row}{\text{Row}}\) \(\newcommand{\col}{\text{Col}}\) \(\renewcommand{\row}{\text{Row}}\) \(\newcommand{\nul}{\text{Nul}}\) \(\newcommand{\var}{\text{Var}}\) \(\newcommand{\corr}{\text{corr}}\) \(\newcommand{\len}[1]{\left|#1\right|}\) \(\newcommand{\bbar}{\overline{\bvec}}\) \(\newcommand{\bhat}{\widehat{\bvec}}\) \(\newcommand{\bperp}{\bvec^\perp}\) \(\newcommand{\xhat}{\widehat{\xvec}}\) \(\newcommand{\vhat}{\widehat{\vvec}}\) \(\newcommand{\uhat}{\widehat{\uvec}}\) \(\newcommand{\what}{\widehat{\wvec}}\) \(\newcommand{\Sighat}{\widehat{\Sigma}}\) \(\newcommand{\lt}{<}\) \(\newcommand{\gt}{>}\) \(\newcommand{\amp}{&}\) \(\definecolor{fillinmathshade}{gray}{0.9}\)Significance Testing for Means
Evaluating Hypotheses for Population Means using Large Samples
When testing a hypothesis for the mean of a normal distribution, we follow a series of six basic steps:
- State the null and alternative hypotheses.
- Choose an α level
- Set the criterion (critical values) for rejecting the null hypothesis.
- Compute the test statistic.
- Make a decision (reject or fail to reject the null hypothesis)
- Interpret the result
If we reject the null hypothesis we are saying that the difference between the observed sample mean and the hypothesized population mean is too great to be attributed to chance. When we fail to reject the null hypothesis, we are saying that the difference between the observed sample mean and the hypothesized population mean is probable if the null hypothesis is true. Essentially, we are willing to attribute this difference to sampling error.
The school nurse was wondering if the average height of 7th graders has been increasing. Over the last 5 years, the average height of a 7th grader was 145 cm with a standard deviation of 20 cm. The school nurse takes a random sample of 200 students and finds that the average height this year is 147 cm. Conduct a single-tailed hypothesis test using a .05 significance level to evaluate the null and alternative hypotheses.
First, we develop our null and alternative hypotheses:
H0:μHa:μ=145>145
Choose α=.05. The critical value for this one tailed test is 1.64. Any test statistic greater than 1.64 will be in the rejection region.
Next, we calculate the test statistic for the sample of 7th graders.
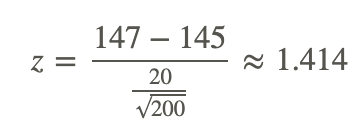
Since the calculated z−score of 1.414 is smaller than 1.64 and thus does not fall in the critical region. Our decision is to fail to reject the null hypothesis and conclude that the probability of obtaining a sample mean equal to 147 if the mean of the population is 145 is likely to have been due to chance.
Testing a Mean Hypothesis Using P-values
We can also test a mean hypothesis using p-values. The following examples show how to do this.
A sample of size 157 is taken from a normal distribution, with a standard deviation of 9. The sample mean is 65.12. Use the 0.01 significance level to test the claim that the population mean is greater than 65.
We always put equality in the null hypothesis, so our claim will be in the alternative hypothesis.
H0:μ=65
HA:μ>65
The test statistic is:
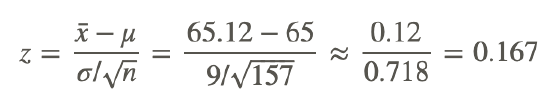
Now we will find the probability of observing a test statistic at least this extreme when assuming the null hypothesis. Since our alternative hypothesis is that the mean is greater, we want to find the probability of z scores that are greater than our test statistics. The p-value we are looking for is:
p-value=P(z>0.17)=1−P(z<0.17)
Using a z-score table:
p-value=P(z>0.0.167)=1−P(z<0.167)=1−0.6064=0.3936>0.01
The probability of observing a test statistic at least as big as the z=0.17 is 0.3936. Since this is greater than our significance level, 0.01, we fail to reject the null hypothesis. This means that the data does not support the claim that the mean is greater than 65.
Testing a Mean Hypothesis When the Population Standard Deviation is Known
We can also use the standard normal distribution, or z-scores, to test a mean hypothesis when the population standard deviation is known. The next two examples, though they have a smaller sample size, have a known population standard deviation.
1. A sample of size 50 is taken from a normal distribution, with a known population standard deviation of 26. The sample mean is 167.02. Use the 0.05 significance level to test the claim that the population mean is greater than 170.
We always put equality in the null hypothesis, so our claim will be in the alternative hypothesis.
H0:μ=170
HA:μ>170
The test statistic is:
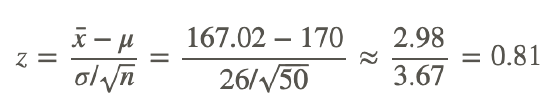
Now we will find the probability of observing a test statistic at least this extreme when assuming the null hypothesis. Since our alternative hypothesis is that the mean is greater, we want to find the probability of z scores that are greater than our test statistics. The p-value we are looking for is:
p-value=P(z>0.811)=1−P(z<0.811)=1−0.791=0.209>0.05
The probability of observing a test statistic at least as big as the z=0.81 is 0.209. Since this is greater than our significance level, 0.05, we fail to reject the null hypothesis. This means that the data does not support the claim that the mean is greater than 170.
2. A sample of size 20 is taken from a normal distribution, with a known population standard deviation of 0.01. The sample mean is 0.194. Use the 0.01 significance level to test the claim that the population mean is equal to 0.22.
We always put equality in the null hypothesis, so our claim will be in the null hypothesis. There is no reason to do a left or right tailed test, so we will do a two tailed test:
H0:μ=0.22
HA:μ≠0.22
The test statistic is:
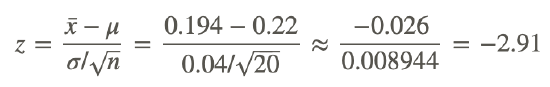
Now we will find the probability of observing a test statistic at least this extreme when assuming the null hypothesis. Since our alternative hypothesis is that the mean is not equal to 0.22, we need to find the probability of being less than -2.91, and we also need to find the probability of being greater than positive 2.91. However, since the normal distribution is symmetric, these probabilities will be the same, so we can find one and multiply it by 2:
p-value=2⋅P(z<−2.91)=2⋅0.0018=0.0036⧸>0.01
The probability of observing a test statistic at least as extreme as z=−2.91 is 0.0036. Since this is less than our significance level, 0.01, we reject the null hypothesis. This means that the data does not support the claim that the mean is equal to 0.22.
Example
Example 1
A sample of size 36 is taken from a normal distribution, with a known population standard deviation of 57. The sample mean is 988.93. Use the 0.05 significance level to test the claim that the population mean is less than 1000.
We always put equality in the null hypothesis, so our claim will be in the alternative hypothesis:
H0:μ=1000
HA:μ<1000
The test statistic is:
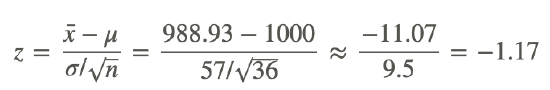
Now we will find the probability of observing a test statistic at least this extreme when assuming the null hypothesis. Since our alternative hypothesis is that the mean is less than 1000, we need to find the probability of z scores less than -1.17:
p-value=P(z<−1.17)=0.1210>0.05
The probability of observing a test statistic at least as extreme as z=−1.17 is 0.1210. Since this is greater than our significance level, 0.05, we fail to reject the null hypothesis. This means that the data does not support the claim that the mean is less than 1000.
Review
- True or False: When we fail to reject the null hypothesis, we are saying that the difference between the observed sample mean and the hypothesized population mean is probable if the null hypothesis is true.
- The dean from UCLA is concerned that the student’s grade point averages have changed dramatically in recent years. The graduating seniors’ mean GPA over the last five years is 2.75. The dean randomly samples 256 seniors from the last graduating class and finds that their mean GPA is 2.85, with a sample standard deviation of 0.65.
- What would the null and alternative hypotheses be for this scenario?
- What would the standard error be for this particular scenario?
- Describe in your own words how you would set the critical regions and what they would be at an alpha level of .05.
- Test the null hypothesis and explain your decision
- For each of the following scenarios, state which one is more likely to lead to the rejection of the null hypothesis?
- A one-tailed or two-tailed test
- .05 or .01 level of significance
- A sample size of n=144 or n=444
- A coal miner claims that the mean number of coal mined per day is more than 30,000 pounds. A random sample of 150 days finds that the mean number of pounds of coal mined is 20,000 pounds with a standard deviation of 1,000. Test the claim at the 5% level of significance.
- A high school teacher claims that the average time a student spends on math homework is less than one hour. A random sample of 250 students is drawn and the mean time spent on math homework in this sample was 45 minutes with a standard deviation of 10. Test the teacher’s claim at the 1% level of significance.
- A student claims that the average time spent studying for a statistics exam is 1.5 hours. A random sample of 200 students is drawn and the sample mean is 150 minutes with a standard deviation of 15. Test the claim at the 10% level of significance.
For problems 7-14 , IQ tests are designed to have a standard deviation of 15 points. They are intended to have a mean of 100 points. For the following data on scores for the new IQ tests, test the claim that their mean is equal to 100. Use 0.05 significance level.
- n=107,x̄=94.77
- n=56,x̄=109.0012
- n=17,x̄=100.13
- n=37,x̄=78.92
- n=72,x̄=98.73
- n=10,x̄=103.34
- n=80,x̄=98.38
- n=150,x̄=108.89
For 15-16, find the p-value. Explain whether you will reject or fail to reject based on the p-value.
- Test the claim that the mean is greater than 27, if n=101,x̄=26.99,σ=5
- Test the claim that the mean is less than 10,000, if n=81,x̄=9941.06,σ=1000
Vocabulary
| Term | Definition |
|---|---|
| p-value | A p-value is the probability of obtaining a test statistic at least as extreme as the one that was observed, assuming that Ho is true. |
Additional Resources
Video: Z Test for Mean
Practice: Significance Test for a Mean
Real World: Paying Attention to Heredity