
10.7: Rank Sum Test and Rank Correlation
- Page ID
- 5803
\( \newcommand{\vecs}[1]{\overset { \scriptstyle \rightharpoonup} {\mathbf{#1}} } \)
\( \newcommand{\vecd}[1]{\overset{-\!-\!\rightharpoonup}{\vphantom{a}\smash {#1}}} \)
\( \newcommand{\dsum}{\displaystyle\sum\limits} \)
\( \newcommand{\dint}{\displaystyle\int\limits} \)
\( \newcommand{\dlim}{\displaystyle\lim\limits} \)
\( \newcommand{\id}{\mathrm{id}}\) \( \newcommand{\Span}{\mathrm{span}}\)
( \newcommand{\kernel}{\mathrm{null}\,}\) \( \newcommand{\range}{\mathrm{range}\,}\)
\( \newcommand{\RealPart}{\mathrm{Re}}\) \( \newcommand{\ImaginaryPart}{\mathrm{Im}}\)
\( \newcommand{\Argument}{\mathrm{Arg}}\) \( \newcommand{\norm}[1]{\| #1 \|}\)
\( \newcommand{\inner}[2]{\langle #1, #2 \rangle}\)
\( \newcommand{\Span}{\mathrm{span}}\)
\( \newcommand{\id}{\mathrm{id}}\)
\( \newcommand{\Span}{\mathrm{span}}\)
\( \newcommand{\kernel}{\mathrm{null}\,}\)
\( \newcommand{\range}{\mathrm{range}\,}\)
\( \newcommand{\RealPart}{\mathrm{Re}}\)
\( \newcommand{\ImaginaryPart}{\mathrm{Im}}\)
\( \newcommand{\Argument}{\mathrm{Arg}}\)
\( \newcommand{\norm}[1]{\| #1 \|}\)
\( \newcommand{\inner}[2]{\langle #1, #2 \rangle}\)
\( \newcommand{\Span}{\mathrm{span}}\) \( \newcommand{\AA}{\unicode[.8,0]{x212B}}\)
\( \newcommand{\vectorA}[1]{\vec{#1}} % arrow\)
\( \newcommand{\vectorAt}[1]{\vec{\text{#1}}} % arrow\)
\( \newcommand{\vectorB}[1]{\overset { \scriptstyle \rightharpoonup} {\mathbf{#1}} } \)
\( \newcommand{\vectorC}[1]{\textbf{#1}} \)
\( \newcommand{\vectorD}[1]{\overrightarrow{#1}} \)
\( \newcommand{\vectorDt}[1]{\overrightarrow{\text{#1}}} \)
\( \newcommand{\vectE}[1]{\overset{-\!-\!\rightharpoonup}{\vphantom{a}\smash{\mathbf {#1}}}} \)
\( \newcommand{\vecs}[1]{\overset { \scriptstyle \rightharpoonup} {\mathbf{#1}} } \)
\(\newcommand{\longvect}{\overrightarrow}\)
\( \newcommand{\vecd}[1]{\overset{-\!-\!\rightharpoonup}{\vphantom{a}\smash {#1}}} \)
\(\newcommand{\avec}{\mathbf a}\) \(\newcommand{\bvec}{\mathbf b}\) \(\newcommand{\cvec}{\mathbf c}\) \(\newcommand{\dvec}{\mathbf d}\) \(\newcommand{\dtil}{\widetilde{\mathbf d}}\) \(\newcommand{\evec}{\mathbf e}\) \(\newcommand{\fvec}{\mathbf f}\) \(\newcommand{\nvec}{\mathbf n}\) \(\newcommand{\pvec}{\mathbf p}\) \(\newcommand{\qvec}{\mathbf q}\) \(\newcommand{\svec}{\mathbf s}\) \(\newcommand{\tvec}{\mathbf t}\) \(\newcommand{\uvec}{\mathbf u}\) \(\newcommand{\vvec}{\mathbf v}\) \(\newcommand{\wvec}{\mathbf w}\) \(\newcommand{\xvec}{\mathbf x}\) \(\newcommand{\yvec}{\mathbf y}\) \(\newcommand{\zvec}{\mathbf z}\) \(\newcommand{\rvec}{\mathbf r}\) \(\newcommand{\mvec}{\mathbf m}\) \(\newcommand{\zerovec}{\mathbf 0}\) \(\newcommand{\onevec}{\mathbf 1}\) \(\newcommand{\real}{\mathbb R}\) \(\newcommand{\twovec}[2]{\left[\begin{array}{r}#1 \\ #2 \end{array}\right]}\) \(\newcommand{\ctwovec}[2]{\left[\begin{array}{c}#1 \\ #2 \end{array}\right]}\) \(\newcommand{\threevec}[3]{\left[\begin{array}{r}#1 \\ #2 \\ #3 \end{array}\right]}\) \(\newcommand{\cthreevec}[3]{\left[\begin{array}{c}#1 \\ #2 \\ #3 \end{array}\right]}\) \(\newcommand{\fourvec}[4]{\left[\begin{array}{r}#1 \\ #2 \\ #3 \\ #4 \end{array}\right]}\) \(\newcommand{\cfourvec}[4]{\left[\begin{array}{c}#1 \\ #2 \\ #3 \\ #4 \end{array}\right]}\) \(\newcommand{\fivevec}[5]{\left[\begin{array}{r}#1 \\ #2 \\ #3 \\ #4 \\ #5 \\ \end{array}\right]}\) \(\newcommand{\cfivevec}[5]{\left[\begin{array}{c}#1 \\ #2 \\ #3 \\ #4 \\ #5 \\ \end{array}\right]}\) \(\newcommand{\mattwo}[4]{\left[\begin{array}{rr}#1 \amp #2 \\ #3 \amp #4 \\ \end{array}\right]}\) \(\newcommand{\laspan}[1]{\text{Span}\{#1\}}\) \(\newcommand{\bcal}{\cal B}\) \(\newcommand{\ccal}{\cal C}\) \(\newcommand{\scal}{\cal S}\) \(\newcommand{\wcal}{\cal W}\) \(\newcommand{\ecal}{\cal E}\) \(\newcommand{\coords}[2]{\left\{#1\right\}_{#2}}\) \(\newcommand{\gray}[1]{\color{gray}{#1}}\) \(\newcommand{\lgray}[1]{\color{lightgray}{#1}}\) \(\newcommand{\rank}{\operatorname{rank}}\) \(\newcommand{\row}{\text{Row}}\) \(\newcommand{\col}{\text{Col}}\) \(\renewcommand{\row}{\text{Row}}\) \(\newcommand{\nul}{\text{Nul}}\) \(\newcommand{\var}{\text{Var}}\) \(\newcommand{\corr}{\text{corr}}\) \(\newcommand{\len}[1]{\left|#1\right|}\) \(\newcommand{\bbar}{\overline{\bvec}}\) \(\newcommand{\bhat}{\widehat{\bvec}}\) \(\newcommand{\bperp}{\bvec^\perp}\) \(\newcommand{\xhat}{\widehat{\xvec}}\) \(\newcommand{\vhat}{\widehat{\vvec}}\) \(\newcommand{\uhat}{\widehat{\uvec}}\) \(\newcommand{\what}{\widehat{\wvec}}\) \(\newcommand{\Sighat}{\widehat{\Sigma}}\) \(\newcommand{\lt}{<}\) \(\newcommand{\gt}{>}\) \(\newcommand{\amp}{&}\) \(\definecolor{fillinmathshade}{gray}{0.9}\)Rank Sum Test and Rank Correlation
We have explored the concept of nonparametric tests. We explored two tests-the sign test and the sign rank test. We use these tests when analyzing matched data pairs or categorical data samples. In both of these tests, our null hypothesis states that there is no difference between the medians of these variables. As mentioned, the sign rank test is a more precise test of this question, but the test statistic can be more difficult to calculate.
But what happens if we want to test if two samples come from the same non-normal distribution? For this type of question, we use the rank sum test (also known as the Mann-Whitney v-test). This test is sensitive to both the median and the distribution of the sample and population.
In this Concept, we will learn how to conduct hypothesis tests using the Mann-Whitney v-test and the situations in which it is appropriate to do so. In addition, we will also explore how to determine the correlation between two variables from non-normal distributions using the rank correlation test for situations that meet the appropriate criteria.
Conditions for Use of the Rank Sum Test to Evaluate Hypotheses about Non-Paired Data
The rank sum test tests the hypothesis that two independent samples are drawn from the same population. Recall that we use this test when we are not sure if the assumptions of normality or homogeneity of variance are met. Essentially, this test compares the medians and the distributions of the two independent samples. This test is considered stronger than other nonparametric tests that simply assess median values.
Performing the Rank Sum Test
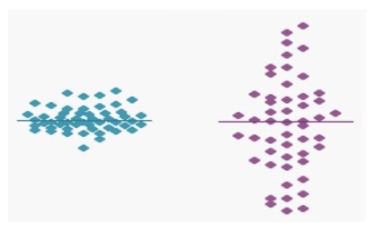
In the image below, we see that the two samples have the same median, but very different distributions. If we were assessing just the median value, we would not realize that these samples actually have distributions that are very distinct.
When performing the rank sum test, there are several different conditions that need to be met. These include the following:
- Although the populations need not be normally distributed or have homogeneity of variance, the observations must be continuously distributed.
- The samples drawn from the population must be independent of one another.
- The samples must have 5 or more observations. The samples do not need to have the same number of observations.
- The observations must be on a numeric or ordinal scale. They cannot be categorical variables.
Since the rank sum test evaluates both the medians and the distributions of two independent samples, we establish two null hypotheses. Our null hypotheses state that the two medians and the two standard deviations of the independent samples are equal. Symbolically, we could say H0:m1=m2 and σ1=σ2. The alternative hypotheses state that there is a difference in the medians and the standard deviations of the samples.
Calculating the Mean and the Standard Deviation of Rank to Calculate a z-Score
When performing the rank sum test, we need to calculate a figure known as the U-statistic. This statistic takes both the median and the total distribution of the two samples into account. The U-statistic actually has its own distribution, which we use when working with small samples. (In this test, a small sample is defined as a sample less than 20 observations.) This distribution is used in the same way that we would use the t-distribution and the chi-square distribution. Similar to the t-distribution, the U-distribution approaches the normal distribution as the sizes of both samples grow. When we have samples of 20 or more, we do not use the U-distribution. Instead, we use the U-statistic to calculate the standard z-score.
To calculate the U-statistic, we must first arrange and rank the data from our two independent samples. First, we must rank all values from both samples from low to high, without regard to which sample each value belongs to. If two values are the same, then they both get the average of the two ranks for which they tie. The smallest number gets a rank of 1, and the largest number gets a rank of n, where n is the total number of values in the two groups. After we arrange and rank the data in each of the samples, we sum the ranks assigned to the observations. We record both the sum of these ranks and the number of observations in each of the samples. After we have this information, we can use the following formulas to determine the U-statistic:
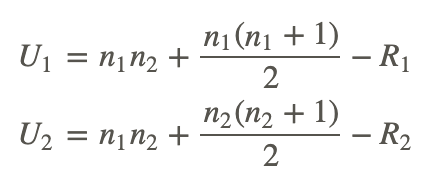
where:
n1 is the number of observations in sample 1.
n2 is the number of observations in sample 2.
R1 is the sum of the ranks assigned to sample 1.
R2 is the sum of the ranks assigned to sample 2.
We use the smaller of the two calculated test statistics (i.e., the lesser of U1 and U2) to evaluate our hypotheses in smaller samples or to calculate the z-score when working with larger samples.
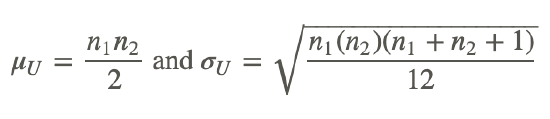
When working with larger samples, we need to calculate two additional pieces of information: the mean of the sampling distribution, μU, and the standard deviation of the sampling distribution, σU. These calculations are relatively straightforward when we know the numbers of observations in each of the samples. To calculate these figures, we use the following formulas:
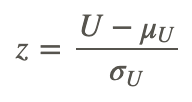
Finally, we use the general formula for the test statistic to test our null hypothesis:
Using a Z-Score to Evaluate Hypotheses
Suppose we are interested in determining the attitudes on the current status of the economy from women who work outside the home and from women who do not work outside the home. We take a sample of 20 women who work outside the home (sample 1) and a sample of 20 women who do not work outside the home (sample 2) and administer a questionnaire that measures their attitudes about the economy. These data are found in the tables below:
| Women Working Outside the Home | Women Working Outside the Home |
|---|---|
| Score | Rank |
| 9 | 1 |
| 12 | 3 |
| 13 | 4 |
| 19 | 8 |
| 21 | 9 |
| 27 | 13 |
| 31 | 16 |
| 33 | 17 |
| 34 | 18 |
| 35 | 19 |
| 39 | 21 |
| 40 | 22 |
| 44 | 25 |
| 46 | 26 |
| 49 | 29 |
| 58 | 33 |
| 61 | 34 |
| 63 | 35 |
| 64 | 36 |
| 70 | 39 |
| R1=408 |
| Women Not Working Outside the Home | Women Not Working Outside the Home |
|---|---|
| Score | Rank |
| 10 | 2 |
| 15 | 5 |
| 17 | 6 |
| 18 | 7 |
| 23 | 10 |
| 24 | 11 |
| 25 | 12 |
| 28 | 14 |
| 30 | 15 |
| 37 | 20 |
| 41 | 23 |
| 42 | 24 |
| 47 | 27 |
| 48 | 28 |
| 52 | 30 |
| 55 | 31 |
| 56 | 32 |
| 65 | 37 |
| 69 | 38 |
| 71 | 40 |
| R2=412 |
Do these two groups of women have significantly different views on the issue?
Since each of our samples has 20 observations, we need to calculate the standard z-score to test the hypothesis that these independent samples came from the same population. To calculate the z-score, we need to first calculate U, μU, and σU. The U-statistic for each of the samples is calculated as follows:
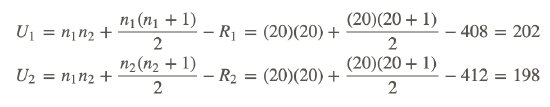
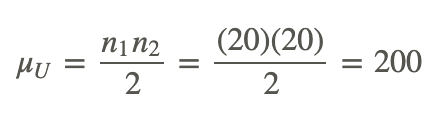
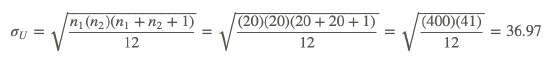
Since we use the smaller of the two U-statistics, we set U=198. When calculating the other two figures, we find the following:
and
Thus, we calculate the z-statistic as shown below:
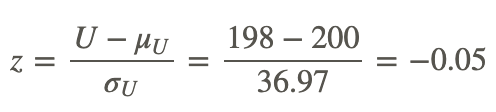
If we set α=0.05, we would find that the calculated test statistic does not exceed the critical value of −1.96. Therefore, we fail to reject the null hypothesis and conclude that these two samples come from the same population.
We can use this z-score to evaluate our hypotheses just like we would with any other hypothesis test. When interpreting the results from the rank sum test, it is important to remember that we are really asking whether or not the populations have the same median and variance. In addition, we are assessing the chance that random sampling would result in medians and variances as far apart (or as close together) as observed in the test. If the z-score is large (meaning that we would have a small P-value), we can reject the idea that the difference is a coincidence. If the z-score is small, like in the example above (meaning that we would have a large P-value), we do not have any reason to conclude that the medians of the populations differ and, therefore, conclude that the samples likely came from the same population.
Determining the Correlation between Two Variables Using the Rank Correlation Test
It is possible to determine the correlation between two variables by calculating the Pearson product-moment correlation coefficient (more commonly known as the linear correlation coefficient, or r). The correlation coefficient helps us determine the strength, magnitude, and direction of the relationship between two variables with normal distributions.
We also use the Spearman rank correlation coefficient (also known simply as the rank correlation coefficient, ρ, or ‘rho’) to measure the strength, magnitude, and direction of the relationship between two variables. This test statistic is the nonparametric alternative to the correlation coefficient, and we use it when the data do not meet the assumptions of normality. The Spearman rank correlation coefficient, used as part of the rank correlation test, can also be used when one or both of the variables consist of ranks. The Spearman rank correlation coefficient is defined by the following formula:
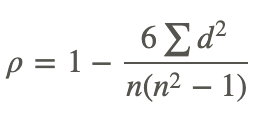
where d is the difference in statistical rank of corresponding observations.
The test works by converting each of the observations to ranks, just like we learned about with the rank sum test. Therefore, if we were doing a rank correlation of scores on a final exam versus SAT scores, the lowest final exam score would get a rank of 1, the second lowest a rank of 2, and so on. Likewise, the lowest SAT score would get a rank of 1, the second lowest a rank of 2, and so on. Similar to the rank sum test, if two observations are equal, the average rank is used for both of the observations. Once the observations are converted to ranks, a correlation analysis is performed on the ranks. (Note: This analysis is not performed on the observations themselves.) The Spearman correlation coefficient is then calculated from the columns of ranks. However, because the distributions are non-normal, a regression line is rarely used, and we do not calculate a non-parametric equivalent of the regression line. It is easy to use a statistical programming package, such as SAS or SPSS, to calculate the Spearman rank correlation coefficient. However, for the purposes of this example, we will perform this test by hand as shown in the example below.
Calculating a Correlation Coefficient using the Spearman Rank Correlation Test
The head of a math department is interested in the correlation between scores on a final math exam and math SAT scores. She took a random sample of 15 students and recorded each student's final exam score and math SAT score. Since SAT scores are designed to be normally distributed, the Spearman rank correlation test may be an especially effective tool for this comparison. Use the Spearman rank correlation test to determine the correlation coefficient. The data for this example are recorded below:
| Math SAT Score | Final Exam Score |
|---|---|
| 595 | 68 |
| 520 | 55 |
| 715 | 65 |
| 405 | 42 |
| 680 | 64 |
| 490 | 45 |
| 565 | 56 |
| 580 | 59 |
| 615 | 56 |
| 435 | 42 |
| 440 | 38 |
| 515 | 50 |
| 380 | 37 |
| 510 | 42 |
| 565 | 53 |
To calculate the Spearman rank correlation coefficient, we determine the ranks of each of the variables in the data set, calculate the difference for each of these ranks, and then calculate the squared difference.
| Math SAT Score (X) | Final Exam Score (Y) | X Rank | Y Rank | d | d2 |
|---|---|---|---|---|---|
| 595 | 68 | 4 | 1 | 3 | 9 |
| 520 | 55 | 8 | 7 | 1 | 1 |
| 715 | 65 | 1 | 2 | −1 | 1 |
| 405 | 42 | 14 | 12 | 2 | 4 |
| 680 | 64 | 2 | 3 | −1 | 1 |
| 490 | 45 | 11 | 10 | 1 | 1 |
| 565 | 56 | 6.5 | 5.5 | 1 | 1 |
| 580 | 59 | 5 | 4 | 1 | 1 |
| 615 | 56 | 3 | 5.5 | −2.5 | 6.25 |
| 435 | 42 | 13 | 12 | 1 | 1 |
| 440 | 38 | 12 | 14 | −2 | 4 |
| 515 | 50 | 9 | 9 | 0 | 0 |
| 380 | 37 | 15 | 15 | 0 | 0 |
| 510 | 42 | 10 | 12 | −2 | 4 |
| 565 | 53 | 6.5 | 8 | −1.5 | 2.25 |
| Sum | 0 | 36.50 |
Using the formula for the Spearman correlation coefficient, we find the following:
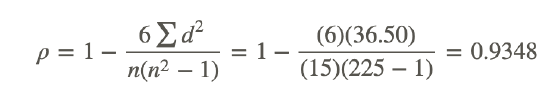
We interpret this rank correlation coefficient in the same way as we interpret the linear correlation coefficient. This coefficient states that there is a strong, positive correlation between the two variables.
Example
Example 1
A sample of 13 children was obtained, 5 girls and 8 boys, and asked to place a set of block in a specific pattern. The time, in seconds, required by each child to arrange the blocks was recorded. Use the rank sum test to determine if there is a difference in dexterity between the boys and the girls.
| Girls | Boys |
|---|---|
| 25 | 39 |
| 20 | 58 |
| 31 | 41 |
| 44 | 36 |
| 23 | 28 |
| 106 | |
| 50 | |
| 27 |
First we make a table of the ranks:
| Girls Data | Girls Rank | Boys Data | Boys Rank |
|---|---|---|---|
| 25 | 3 | 39 | 8 |
| 20 | 1 | 58 | 12 |
| 31 | 6 | 41 | 9 |
| 44 | 10 | 36 | 7 |
| 23 | 2 | 28 | 5 |
| 106 | 13 | ||
| 50 | 11 | ||
| 27 | 4 |
Now we do the calculations:
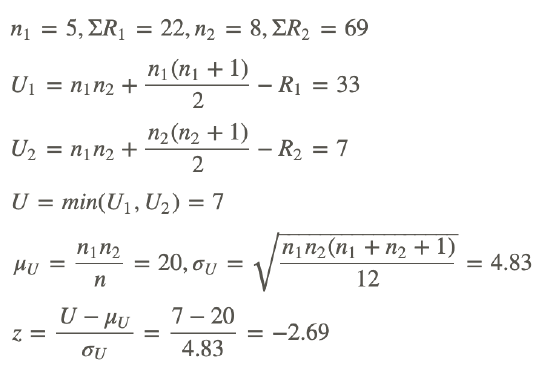
Since this is a two-sided test the p-value is 2P(z<−2.69)=2(0.004)=0.008
This is less than .05 so we reject the null hypothesis and believe there is a difference in dexterity between girls and boys.
Review
- When do you use the rank sum test?
- Suppose the grades on an exam for the male and female students in a class were as indicated below. Use the Wilcoxon rank sum test at the 5% level of significance to test whether males and females did equally well.
| Males | Females |
|---|---|
| 99 | 99 |
| 96 | 94 |
| 88 | 91 |
| 88 | 90 |
| 85 | 88 |
| 83 | 87 |
| 79 | 79 |
| 78 | 78 |
| 78 | 72 |
| 71 | 58 |
| 65 | 51 |
| 58 | 43 |
| 57 | 41 |
| 53 | 31 |
| 49 | 15 |
| 39 | |
| 34 | |
| 23 | |
| 22 | |
| 5 |
- Two students compared two brands of chips, Doritos and Frito Lays, to see which company gives you more for your money. According to the label on each of the bags, each bag contained 35.4 grams. The students looked at 5 bags of each brand. For Doritos, they found the bags contained 37.3 grams, 37.4 grams, 37.8 grams, 37.9 grams, and 35.9 grams. For Frito Lays, they found the bags contained 35.3 grams, 37.8 grams, 38.8 grams, 35.9 grams, and 35.9 grams. Use the Wilcoxon rank sum test to see if there is a significant difference between the amount each brand puts in their bags.
For 4-6, a researcher is interested in knowing if there is a difference between staff, trainees and students in their ability to interpret a particular test that was designed to identify a certain form of mental illness. The test was given to 100 people, half of whom had the mental illness. 15 judges, 5 staff, 5 trainees and 5 students interpreted the test. The table five the number of tests correctly interpreted by each of the 15 judges.
| Staff | Trainees | Students |
|---|---|---|
| 78 | 80 | 65 |
| 76 | 69 | 74 |
| 80 | 75 | 80 |
| 81 | 83 | 82 |
| 88 | 74 | 77 |
- What are the ranks for the observations in the first row?
- What is the highest rank given to any observation?
- If the p-value of the test is small, what is the conclusion?
- What test statistic is used by the Wilcoxon rank sum test?
- How is that test statistic obtained?
- What null hypothesis does the Wilcoxon rank sum test? What are the possible alternative hypotheses?
- What assumptions are made by the Wilcoxon rank sum test?
- Qualitatively, what should happen to the rank sum for sample A if distribution A shifted to the right of distribution B? If it is shifted to the left?
Vocabulary
| Term | Definition |
|---|---|
| Mann Whitney u-test | The Mann-Whitney u-test (also known as the rank sum test) is used to assess whether two samples come from the same distribution. |
| rank sum test | The rank sum test is a nonparametric test (t-test for independence) that compares means of two independent samples |
| Spearman rank correlation coefficient | The Spearman rank correlation coefficient (also known simply as the rank correlation coefficient) to measure the strength, magnitude, and direction of the relationship between two variables from non-normal distributions. |
| u-distribution | The U-distribution is used for samples less than 20 and approaches the normal distribution as the sizes of both samples grow. |
| u-statistic | The u-statistic takes both the median and the total distribution of both samples into account and is derived from the ranks of the observations in both samples. |