
2.6.5: Amplitude, Period, and Frequency
- Page ID
- 14930
\( \newcommand{\vecs}[1]{\overset { \scriptstyle \rightharpoonup} {\mathbf{#1}} } \)
\( \newcommand{\vecd}[1]{\overset{-\!-\!\rightharpoonup}{\vphantom{a}\smash {#1}}} \)
\( \newcommand{\dsum}{\displaystyle\sum\limits} \)
\( \newcommand{\dint}{\displaystyle\int\limits} \)
\( \newcommand{\dlim}{\displaystyle\lim\limits} \)
\( \newcommand{\id}{\mathrm{id}}\) \( \newcommand{\Span}{\mathrm{span}}\)
( \newcommand{\kernel}{\mathrm{null}\,}\) \( \newcommand{\range}{\mathrm{range}\,}\)
\( \newcommand{\RealPart}{\mathrm{Re}}\) \( \newcommand{\ImaginaryPart}{\mathrm{Im}}\)
\( \newcommand{\Argument}{\mathrm{Arg}}\) \( \newcommand{\norm}[1]{\| #1 \|}\)
\( \newcommand{\inner}[2]{\langle #1, #2 \rangle}\)
\( \newcommand{\Span}{\mathrm{span}}\)
\( \newcommand{\id}{\mathrm{id}}\)
\( \newcommand{\Span}{\mathrm{span}}\)
\( \newcommand{\kernel}{\mathrm{null}\,}\)
\( \newcommand{\range}{\mathrm{range}\,}\)
\( \newcommand{\RealPart}{\mathrm{Re}}\)
\( \newcommand{\ImaginaryPart}{\mathrm{Im}}\)
\( \newcommand{\Argument}{\mathrm{Arg}}\)
\( \newcommand{\norm}[1]{\| #1 \|}\)
\( \newcommand{\inner}[2]{\langle #1, #2 \rangle}\)
\( \newcommand{\Span}{\mathrm{span}}\) \( \newcommand{\AA}{\unicode[.8,0]{x212B}}\)
\( \newcommand{\vectorA}[1]{\vec{#1}} % arrow\)
\( \newcommand{\vectorAt}[1]{\vec{\text{#1}}} % arrow\)
\( \newcommand{\vectorB}[1]{\overset { \scriptstyle \rightharpoonup} {\mathbf{#1}} } \)
\( \newcommand{\vectorC}[1]{\textbf{#1}} \)
\( \newcommand{\vectorD}[1]{\overrightarrow{#1}} \)
\( \newcommand{\vectorDt}[1]{\overrightarrow{\text{#1}}} \)
\( \newcommand{\vectE}[1]{\overset{-\!-\!\rightharpoonup}{\vphantom{a}\smash{\mathbf {#1}}}} \)
\( \newcommand{\vecs}[1]{\overset { \scriptstyle \rightharpoonup} {\mathbf{#1}} } \)
\(\newcommand{\longvect}{\overrightarrow}\)
\( \newcommand{\vecd}[1]{\overset{-\!-\!\rightharpoonup}{\vphantom{a}\smash {#1}}} \)
\(\newcommand{\avec}{\mathbf a}\) \(\newcommand{\bvec}{\mathbf b}\) \(\newcommand{\cvec}{\mathbf c}\) \(\newcommand{\dvec}{\mathbf d}\) \(\newcommand{\dtil}{\widetilde{\mathbf d}}\) \(\newcommand{\evec}{\mathbf e}\) \(\newcommand{\fvec}{\mathbf f}\) \(\newcommand{\nvec}{\mathbf n}\) \(\newcommand{\pvec}{\mathbf p}\) \(\newcommand{\qvec}{\mathbf q}\) \(\newcommand{\svec}{\mathbf s}\) \(\newcommand{\tvec}{\mathbf t}\) \(\newcommand{\uvec}{\mathbf u}\) \(\newcommand{\vvec}{\mathbf v}\) \(\newcommand{\wvec}{\mathbf w}\) \(\newcommand{\xvec}{\mathbf x}\) \(\newcommand{\yvec}{\mathbf y}\) \(\newcommand{\zvec}{\mathbf z}\) \(\newcommand{\rvec}{\mathbf r}\) \(\newcommand{\mvec}{\mathbf m}\) \(\newcommand{\zerovec}{\mathbf 0}\) \(\newcommand{\onevec}{\mathbf 1}\) \(\newcommand{\real}{\mathbb R}\) \(\newcommand{\twovec}[2]{\left[\begin{array}{r}#1 \\ #2 \end{array}\right]}\) \(\newcommand{\ctwovec}[2]{\left[\begin{array}{c}#1 \\ #2 \end{array}\right]}\) \(\newcommand{\threevec}[3]{\left[\begin{array}{r}#1 \\ #2 \\ #3 \end{array}\right]}\) \(\newcommand{\cthreevec}[3]{\left[\begin{array}{c}#1 \\ #2 \\ #3 \end{array}\right]}\) \(\newcommand{\fourvec}[4]{\left[\begin{array}{r}#1 \\ #2 \\ #3 \\ #4 \end{array}\right]}\) \(\newcommand{\cfourvec}[4]{\left[\begin{array}{c}#1 \\ #2 \\ #3 \\ #4 \end{array}\right]}\) \(\newcommand{\fivevec}[5]{\left[\begin{array}{r}#1 \\ #2 \\ #3 \\ #4 \\ #5 \\ \end{array}\right]}\) \(\newcommand{\cfivevec}[5]{\left[\begin{array}{c}#1 \\ #2 \\ #3 \\ #4 \\ #5 \\ \end{array}\right]}\) \(\newcommand{\mattwo}[4]{\left[\begin{array}{rr}#1 \amp #2 \\ #3 \amp #4 \\ \end{array}\right]}\) \(\newcommand{\laspan}[1]{\text{Span}\{#1\}}\) \(\newcommand{\bcal}{\cal B}\) \(\newcommand{\ccal}{\cal C}\) \(\newcommand{\scal}{\cal S}\) \(\newcommand{\wcal}{\cal W}\) \(\newcommand{\ecal}{\cal E}\) \(\newcommand{\coords}[2]{\left\{#1\right\}_{#2}}\) \(\newcommand{\gray}[1]{\color{gray}{#1}}\) \(\newcommand{\lgray}[1]{\color{lightgray}{#1}}\) \(\newcommand{\rank}{\operatorname{rank}}\) \(\newcommand{\row}{\text{Row}}\) \(\newcommand{\col}{\text{Col}}\) \(\renewcommand{\row}{\text{Row}}\) \(\newcommand{\nul}{\text{Nul}}\) \(\newcommand{\var}{\text{Var}}\) \(\newcommand{\corr}{\text{corr}}\) \(\newcommand{\len}[1]{\left|#1\right|}\) \(\newcommand{\bbar}{\overline{\bvec}}\) \(\newcommand{\bhat}{\widehat{\bvec}}\) \(\newcommand{\bperp}{\bvec^\perp}\) \(\newcommand{\xhat}{\widehat{\xvec}}\) \(\newcommand{\vhat}{\widehat{\vvec}}\) \(\newcommand{\uhat}{\widehat{\uvec}}\) \(\newcommand{\what}{\widehat{\wvec}}\) \(\newcommand{\Sighat}{\widehat{\Sigma}}\) \(\newcommand{\lt}{<}\) \(\newcommand{\gt}{>}\) \(\newcommand{\amp}{&}\) \(\definecolor{fillinmathshade}{gray}{0.9}\)Vertical and horizontal properties of sine and cosine waves.
You are working in science lab one afternoon when your teacher asks you to do a little more advanced work with her on sound. Excited to help, you readily agree. She gives you a device that graphs sound waves as they come in through a microphone. She then gives you a "baseline" graph of what the sound wave's graph would look like:
She then asks you to plot the sound wave she's about to generate. However, she tells you that the sound wave will be twice as loud and twice as high in pitch as the baseline sound wave she gave you.
Can you determine how large the graph needs to be to plot the new sound wave? What about the spacing of numbers on the "x" axis?
Amplitude and Period
In other lessons you have dealt with how find the amplitude of a wave, or the period of a wave. Here we'll take a few minutes to work problems that involve both the amplitude and period, giving us two variables to work with when thinking about sinusoidal equations.
Finding the Period, Amplitude, and Frequency
1. Find the period, amplitude and frequency of \(y=2\cos \dfrac{1}{2}x\) and sketch a graph from 0 to \(2\pi \).
This is a cosine graph that has been stretched both vertically and horizontally. It will now reach up to 2 and down to -2. The frequency is \(\dfrac{1}{2}\) and to see a complete period we would need to graph the interval \([0, 4\pi ]\). Since we are only going out to \(2\pi \), we will only see half of a wave. A complete cosine wave looks like this:
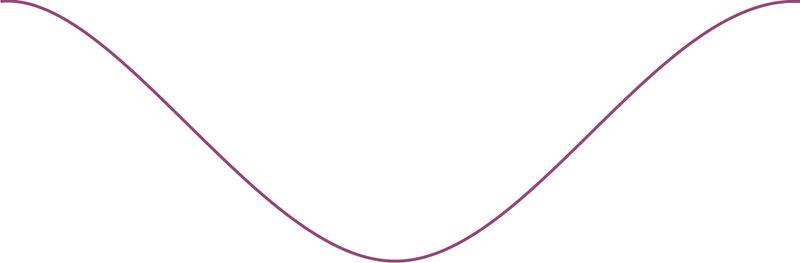
So, half of it is this:
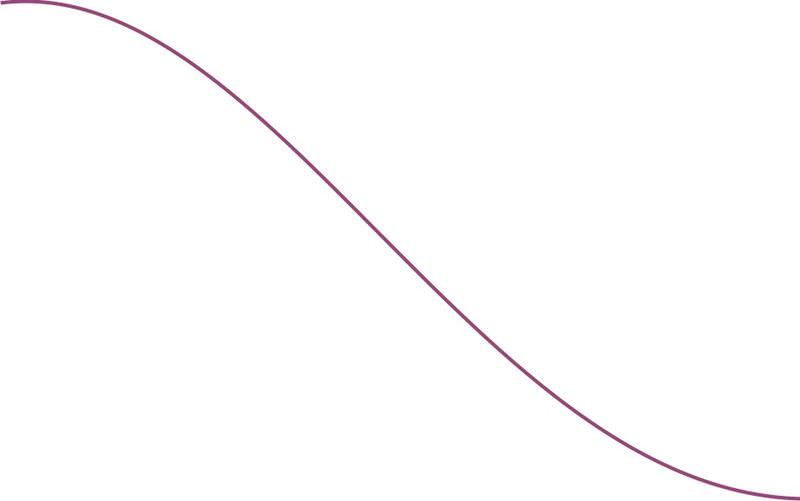
This means that this half needs to be stretched out so it finishes at \(2\pi \), which means that at \(\pi\) the graph should cross the x−axis:
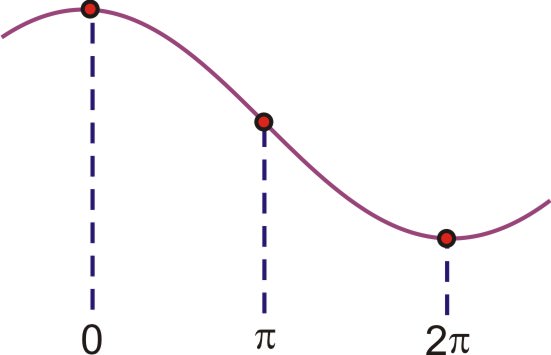
The final sketch would look like this:
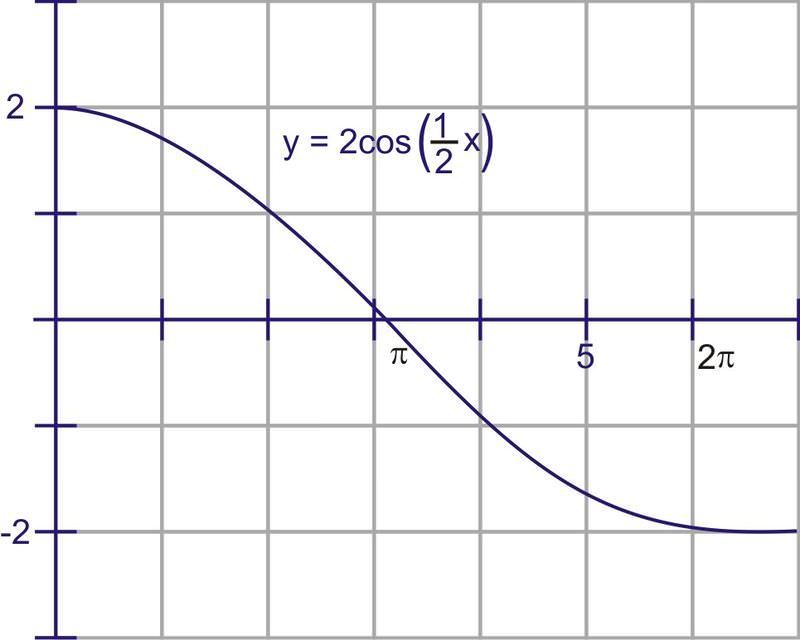
amplitude=2, frequency=\(\dfrac{1}{2}\), period\(=\dfrac{2\pi }{\dfrac{1}{2}}=4\pi\)
2. Identify the period, amplitude, frequency, and equation of the following sinusoid:
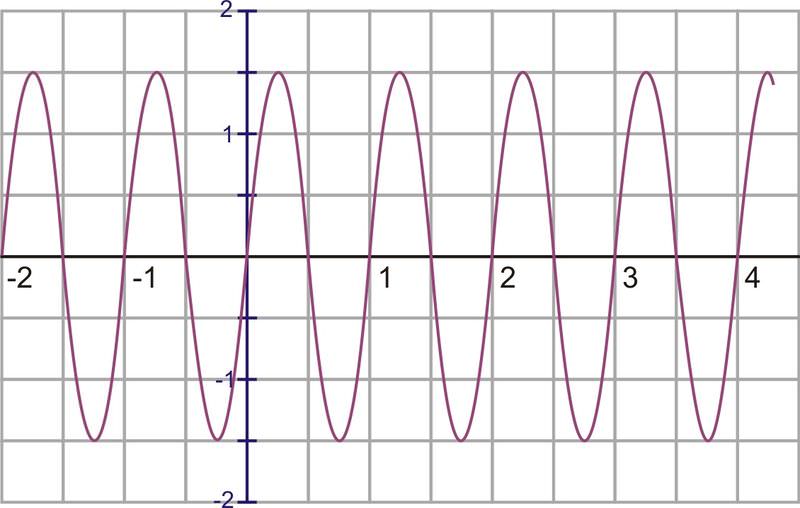
The amplitude is 1.5. Notice that the units on the x−axis are not labeled in terms of \(\pi \). This appears to be a sine wave because the y−intercept is 0.
One wave appears to complete in 1 unit (not \(1\pi\) units!), so the period is 1. If one wave is completed in 1 unit, how many waves will be in \(2\pi \) units? In previous problems, you were given the frequency and asked to find the period using the following relationship:
\(p=\dfrac{2\pi }{B}\)
Where B is the frequency and p is the period. With just a little bit of algebra, we can transform this formula and solve it for B:
\(p=\dfrac{2\pi }{B} \rightarrow Bp=2\pi \rightarrow B=\dfrac{2\pi }{p}\)
Therefore, the frequency is:
\(B=\dfrac{2\pi }{1}=2\pi\)
If we were to graph this out to \(2\pi \) we would see \(2\pi \) (or a little more than 6) complete waves.
Replacing these values in the equation gives: \(f(x)=1.5\sin 2\pi x\).
3. Find the period, amplitude and frequency of \(y=3\sin 2x\) and sketch a graph from 0 to \(6\pi \).
This is a sine graph that has been stretched both vertically and horizontally. It will now reach up to 3 and down to -3. The frequency is 2 and so we will see the wave repeat twice over the interval from 0 to \(2\pi \).
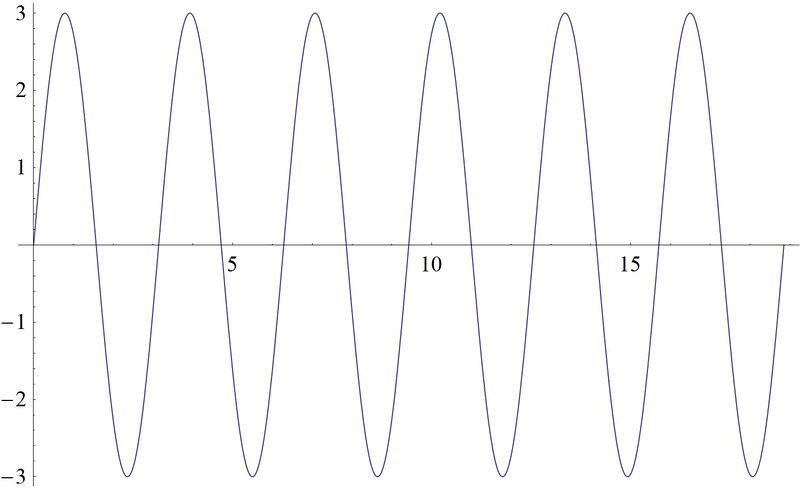
amplitude=3, frequency=2, \(\text{period }=\dfrac{2\pi }{2}=\pi\)
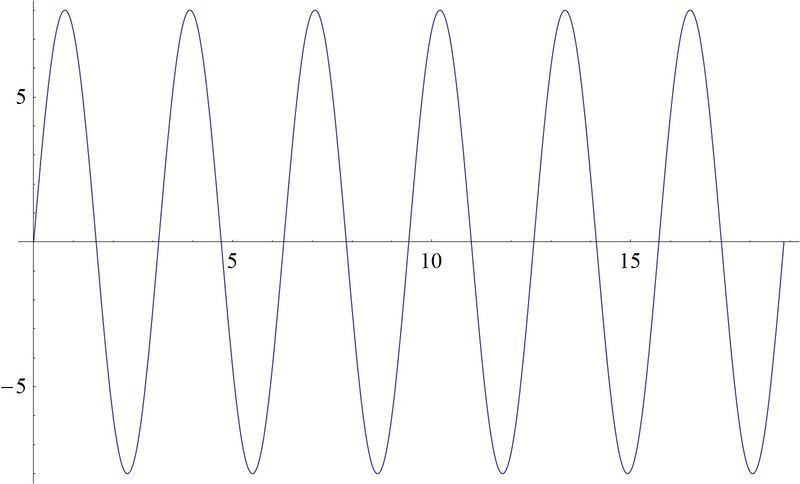
Earlier, you were asked can you determine how large the graphs needs to be to plot the new sound wave.
Solution
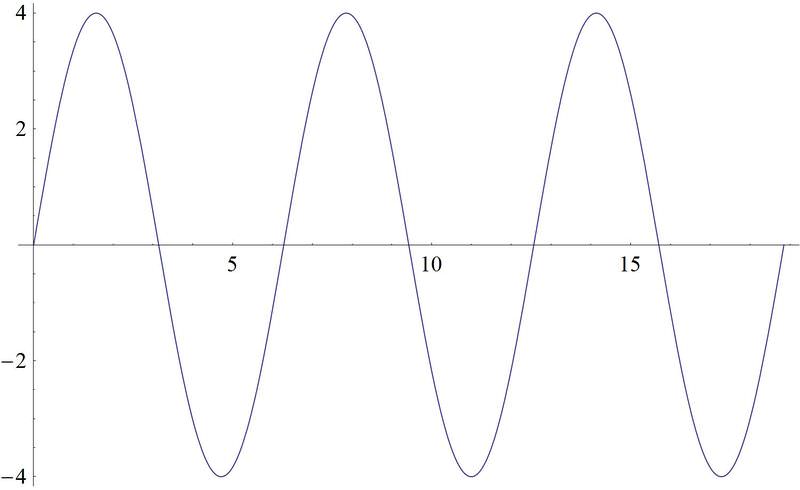
You know that the amplitude of the wave is the maximum height it makes above zero. You also know that the frequency is the number of cycles in a second. The scale of the graph you make should be able to take into account a maximum height of the wave that has been doubled, as well as a frequency that is twice as high. Your graph should look like this:
Identify the amplitude, period, and frequency of \(y=\cos 2x\)
Solution
period: \(\pi \), amplitude: 1, frequency: 2
Identify the amplitude, period, and frequency of \(y=3\sin x\)
Solution
period: \(2\pi \), amplitude: 3, frequency: 1
Identify the amplitude, period, and frequency of \(y=2\sin \pi x \)
Solution
period: 2, amplitude: 2, frequency: \(\pi\)
Review
Find the period, amplitude, and frequency of the following functions.
- \(y=2\sin (3x)\)
- \(y=5\cos \left(\dfrac{3}{4}x\right)\)
- \(y=3\cos (2x)\)
- \(y=−2\sin \left(\dfrac{1}{2}x\right)\)
- \(y=−\sin (2x)\)
- \(y=\dfrac{1}{2}\cos (4x)\)
Identify the equation of each of the following graphs.
-

Figure \(\PageIndex{9}\) -
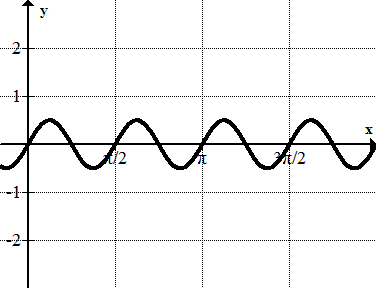
Figure \(\PageIndex{10}\) -
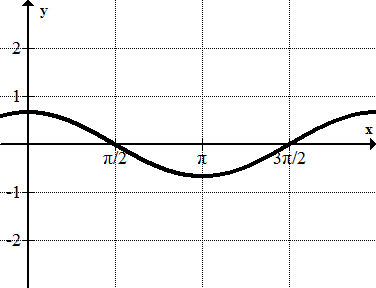
Figure \(\PageIndex{11}\) -
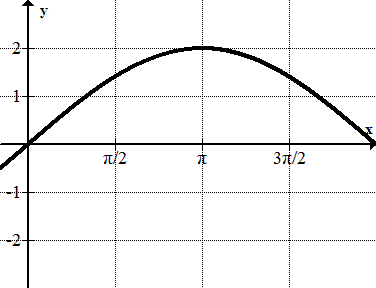
Figure \(\PageIndex{9}\)
Graph each of the following functions from 0 to \(2\pi \).
- \(y=2\cos (4x)\)
- \(y=3\sin \left(\dfrac{5}{4}x\right)\)
- \(y=−\cos (2x)\)
- \(y=−2\sin \left(\dfrac{1}{2}x\right)\)
- \(y=4\sec(3x)\)
- \(y=\dfrac{1}{2}\cos (3x)\)
- \(y=4\tan(3x)\)
- \(y=\dfrac{1}{2}\csc(3x)\)
Review (Answers)
To see the Review answers, open this PDF file and look for section 2.16.