
2.6.9: General Sinusoidal Graphs
- Page ID
- 14935
\( \newcommand{\vecs}[1]{\overset { \scriptstyle \rightharpoonup} {\mathbf{#1}} } \)
\( \newcommand{\vecd}[1]{\overset{-\!-\!\rightharpoonup}{\vphantom{a}\smash {#1}}} \)
\( \newcommand{\id}{\mathrm{id}}\) \( \newcommand{\Span}{\mathrm{span}}\)
( \newcommand{\kernel}{\mathrm{null}\,}\) \( \newcommand{\range}{\mathrm{range}\,}\)
\( \newcommand{\RealPart}{\mathrm{Re}}\) \( \newcommand{\ImaginaryPart}{\mathrm{Im}}\)
\( \newcommand{\Argument}{\mathrm{Arg}}\) \( \newcommand{\norm}[1]{\| #1 \|}\)
\( \newcommand{\inner}[2]{\langle #1, #2 \rangle}\)
\( \newcommand{\Span}{\mathrm{span}}\)
\( \newcommand{\id}{\mathrm{id}}\)
\( \newcommand{\Span}{\mathrm{span}}\)
\( \newcommand{\kernel}{\mathrm{null}\,}\)
\( \newcommand{\range}{\mathrm{range}\,}\)
\( \newcommand{\RealPart}{\mathrm{Re}}\)
\( \newcommand{\ImaginaryPart}{\mathrm{Im}}\)
\( \newcommand{\Argument}{\mathrm{Arg}}\)
\( \newcommand{\norm}[1]{\| #1 \|}\)
\( \newcommand{\inner}[2]{\langle #1, #2 \rangle}\)
\( \newcommand{\Span}{\mathrm{span}}\) \( \newcommand{\AA}{\unicode[.8,0]{x212B}}\)
\( \newcommand{\vectorA}[1]{\vec{#1}} % arrow\)
\( \newcommand{\vectorAt}[1]{\vec{\text{#1}}} % arrow\)
\( \newcommand{\vectorB}[1]{\overset { \scriptstyle \rightharpoonup} {\mathbf{#1}} } \)
\( \newcommand{\vectorC}[1]{\textbf{#1}} \)
\( \newcommand{\vectorD}[1]{\overrightarrow{#1}} \)
\( \newcommand{\vectorDt}[1]{\overrightarrow{\text{#1}}} \)
\( \newcommand{\vectE}[1]{\overset{-\!-\!\rightharpoonup}{\vphantom{a}\smash{\mathbf {#1}}}} \)
\( \newcommand{\vecs}[1]{\overset { \scriptstyle \rightharpoonup} {\mathbf{#1}} } \)
\( \newcommand{\vecd}[1]{\overset{-\!-\!\rightharpoonup}{\vphantom{a}\smash {#1}}} \)
\(\newcommand{\avec}{\mathbf a}\) \(\newcommand{\bvec}{\mathbf b}\) \(\newcommand{\cvec}{\mathbf c}\) \(\newcommand{\dvec}{\mathbf d}\) \(\newcommand{\dtil}{\widetilde{\mathbf d}}\) \(\newcommand{\evec}{\mathbf e}\) \(\newcommand{\fvec}{\mathbf f}\) \(\newcommand{\nvec}{\mathbf n}\) \(\newcommand{\pvec}{\mathbf p}\) \(\newcommand{\qvec}{\mathbf q}\) \(\newcommand{\svec}{\mathbf s}\) \(\newcommand{\tvec}{\mathbf t}\) \(\newcommand{\uvec}{\mathbf u}\) \(\newcommand{\vvec}{\mathbf v}\) \(\newcommand{\wvec}{\mathbf w}\) \(\newcommand{\xvec}{\mathbf x}\) \(\newcommand{\yvec}{\mathbf y}\) \(\newcommand{\zvec}{\mathbf z}\) \(\newcommand{\rvec}{\mathbf r}\) \(\newcommand{\mvec}{\mathbf m}\) \(\newcommand{\zerovec}{\mathbf 0}\) \(\newcommand{\onevec}{\mathbf 1}\) \(\newcommand{\real}{\mathbb R}\) \(\newcommand{\twovec}[2]{\left[\begin{array}{r}#1 \\ #2 \end{array}\right]}\) \(\newcommand{\ctwovec}[2]{\left[\begin{array}{c}#1 \\ #2 \end{array}\right]}\) \(\newcommand{\threevec}[3]{\left[\begin{array}{r}#1 \\ #2 \\ #3 \end{array}\right]}\) \(\newcommand{\cthreevec}[3]{\left[\begin{array}{c}#1 \\ #2 \\ #3 \end{array}\right]}\) \(\newcommand{\fourvec}[4]{\left[\begin{array}{r}#1 \\ #2 \\ #3 \\ #4 \end{array}\right]}\) \(\newcommand{\cfourvec}[4]{\left[\begin{array}{c}#1 \\ #2 \\ #3 \\ #4 \end{array}\right]}\) \(\newcommand{\fivevec}[5]{\left[\begin{array}{r}#1 \\ #2 \\ #3 \\ #4 \\ #5 \\ \end{array}\right]}\) \(\newcommand{\cfivevec}[5]{\left[\begin{array}{c}#1 \\ #2 \\ #3 \\ #4 \\ #5 \\ \end{array}\right]}\) \(\newcommand{\mattwo}[4]{\left[\begin{array}{rr}#1 \amp #2 \\ #3 \amp #4 \\ \end{array}\right]}\) \(\newcommand{\laspan}[1]{\text{Span}\{#1\}}\) \(\newcommand{\bcal}{\cal B}\) \(\newcommand{\ccal}{\cal C}\) \(\newcommand{\scal}{\cal S}\) \(\newcommand{\wcal}{\cal W}\) \(\newcommand{\ecal}{\cal E}\) \(\newcommand{\coords}[2]{\left\{#1\right\}_{#2}}\) \(\newcommand{\gray}[1]{\color{gray}{#1}}\) \(\newcommand{\lgray}[1]{\color{lightgray}{#1}}\) \(\newcommand{\rank}{\operatorname{rank}}\) \(\newcommand{\row}{\text{Row}}\) \(\newcommand{\col}{\text{Col}}\) \(\renewcommand{\row}{\text{Row}}\) \(\newcommand{\nul}{\text{Nul}}\) \(\newcommand{\var}{\text{Var}}\) \(\newcommand{\corr}{\text{corr}}\) \(\newcommand{\len}[1]{\left|#1\right|}\) \(\newcommand{\bbar}{\overline{\bvec}}\) \(\newcommand{\bhat}{\widehat{\bvec}}\) \(\newcommand{\bperp}{\bvec^\perp}\) \(\newcommand{\xhat}{\widehat{\xvec}}\) \(\newcommand{\vhat}{\widehat{\vvec}}\) \(\newcommand{\uhat}{\widehat{\uvec}}\) \(\newcommand{\what}{\widehat{\wvec}}\) \(\newcommand{\Sighat}{\widehat{\Sigma}}\) \(\newcommand{\lt}{<}\) \(\newcommand{\gt}{>}\) \(\newcommand{\amp}{&}\) \(\definecolor{fillinmathshade}{gray}{0.9}\)sine and cosine waves and their relationship to the unit circle.
The cosine function is the x coordinates of the unit circle and the sine function is the y coordinates. since the unit circle has radius one and is centered at the origin, both sine and cosine oscillate between positive and negative one.
What happens when the circle is not centered at the origin and does not have a radius of 1?
Graphs of sinusoidal Functions
The sinusoidal function family refers to either sine or cosine waves since they are the same except for a horizontal shift. This function family is also called the periodic function family because the function repeats after a given period of time.
Consider a Ferris wheel that spins evenly with a radius of 1 unit. It starts at (1, 0) or an angle of 0 radians and spins counterclockwise at a rate of one cycle per \(2\pi \) minutes (so you can use time is equal to radians).
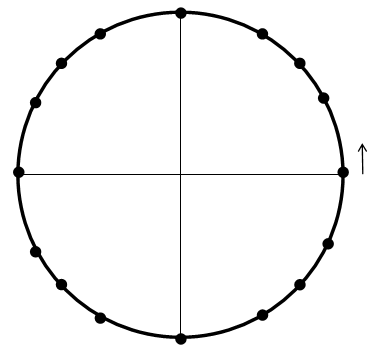
The 16 points around the circle are chosen because they correspond to the key points of the unit circle. Their heights (y-values) and widths (x-values) are already known and can be filled in.
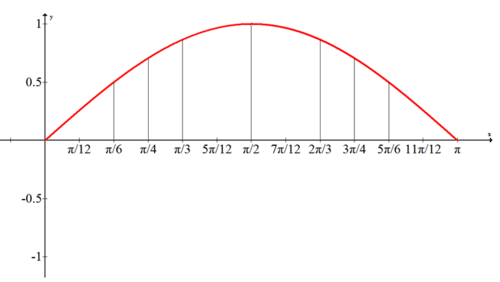
First consider the height at each of the points as you travel around half of the circle from the starting location. Keep track of your work in a table.
| Angle (radians) | Height (units) |
| 0 | 0 |
| \(\dfrac{\pi }{6}\) | \(\dfrac{1}{2}\) |
| \(\dfrac{\pi }{4}\) | \(\dfrac{\sqrt{2}}{2}\approx 0.707\) |
| \(\dfrac{\pi }{3}\) | \(\dfrac{\sqrt{3}}{2}\approx 0.866\) |
| \(\dfrac{\pi}{2}\) | 1 |
| \(\dfrac{2\pi }{3}\) | \(\dfrac{\sqrt{3}}{2}\approx 0.866\) |
| \(\dfrac{3\pi }{4}\) | \(\dfrac{\sqrt{2}}{2}\approx 0.707\) |
| \(\dfrac{5\pi }{6}\) | \(\dfrac{1}{2}\) |
| \(\pi\) | 0 |
Notice the symmetry of the height around \(\dfrac{\pi}{2}\) and see the rest of the table in the examples. Once the table is finished, you can plot these points on a regular coordinate plane where the x axis is the angle and the y axis is the height. This is the first part of the graph of the sine function.
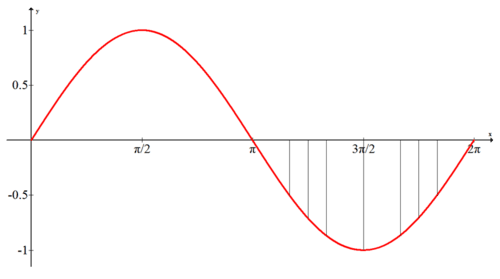
To finish the graph of the sine function, finish the table for heights of the points in quadrants III and IV and draw an entire cycle (known as a period) of the sine function.
| Angle (radians) | Height (units) |
| \(\pi\) | 0 |
| \(\dfrac{7\pi }{6}\) | \(−\dfrac{1}{2}\) |
| \(\dfrac{5\pi }{4}\) | \(−\dfrac{\sqrt{2}}{2}\approx −0.707\) |
| \(\dfrac{4\pi }{3}\) | \(−\dfrac{\sqrt{3}}{2}\approx −0.866\) |
| \(\dfrac{3\pi}{2}\) | -1 |
| \(\dfrac{5\pi }{3}\) | \(−\dfrac{\sqrt{3}}{2}\approx −0.866\) |
| \(\dfrac{7 \pi}{4}\) | \(−\dfrac{\sqrt{2}}{2}\approx −0.707\) |
| \(\dfrac{11 \pi}{6}\) | \(−\dfrac{1}{2}\) |
| \(2\pi\) |
0 |
Similar to sine, you can use your knowledge of the angles 0, \(\dfrac{\pi}{2}\), \(\pi \),\(\dfrac{3\pi}{2}\), \(2\pi \) on the unit circle to get a complete cycle of the cosine graph. While the sine function uses the y-coordinates, the cosine function is the x-coordinates of the unit circle and measures width. By referring to a unit circle or your memory, you can fill out a much shorter table than before.
| Angle (radians) | Width (units) |
| 0 | 1 |
| \(\dfrac{\pi}{2}\) | 0 |
| \(\pi\) | -1 |
| \(\dfrac{3\pi}{2}\) | 0 |
| \(2\pi\) | 1 |
First plot these five points and then connect them with a smooth curve. This will produce the cosine graph.
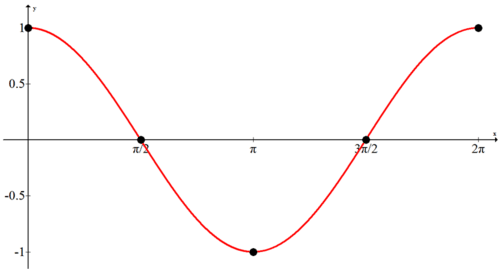
Determining these five main points is the key to graphing sine or cosine graphs even when the graph is shifted or stretched.
Earlier, you were asked what happens when the circle is not centered at the origin and does not have a radius of 1.
Solution
The unit circle produces the parent function sine and cosine graphs. When the unit circle is shifted up or down, made wider or narrower, or spun faster or slower in either direction, then the graphs of the sine and cosine functions will be transformed using basic function transformation rules.
What happens on either side of the sine and cosine graphs? Can you explain why?
Solution
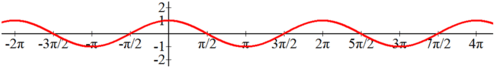
The graphs of the sine (blue) and cosine (red) functions repeat forever in both directions.
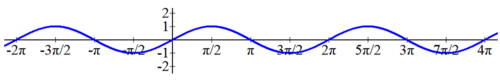
If you think about the example with the Ferris wheel, the ride will keep on spinning and has been spinning forever. This is why the same cycle of the graph repeats over and over.
How are the sine and cosine graphs the same and how are they different?
Solution
The sine graph is the same as the cosine graph offset by \(\dfrac{\pi}{2}\). Besides the shift, both curves are identical due to the perfect symmetry of circles.
Where are two maximums and two minimums of the sine graph?
Solution
One maximum of the sine graph occurs at \(\left(\dfrac{\pi}{2}, 1\right)\). One minimum occurs at \(\left(\dfrac{3\pi}{2}, −1 \right)\). This is one cycle of the sine graph. Since it completes a cycle every \(2\pi \), when you add \(2\pi \) to an x-coordinate you will be on the same point of the cycle giving you another maximum or minimum.
\(\left(\dfrac{5\pi}{2},1\right)\) is another maximum. \(\left(\dfrac{7\pi}{2},−1\right)\) is another minimum.
In the interval \([−2\pi ,4\pi )\) where does cosine have zeroes?
Solution
Observe where the cosine curve has x-coordinates equal to zero. Note that 4\pi is excluded from the interval. The values are \(−\dfrac{3\pi}{2},−\dfrac{\pi}{2},\dfrac{\pi}{2},\dfrac{3\pi}{2},\dfrac{5\pi}{2},\dfrac{7\pi}{2}\).
Review
1. Sketch \(p(x)=\sin x\) from memory.
2. Sketch \(j(x)=\cos x\) from memory.
3. Where do the maximums of the cosine graph occur?
4. Where do the minimums of the cosine graph occur?
5. Find all the zeroes of the sine function on the interval \(\left[−\pi ,\dfrac{5\pi}{2}\right]\).
6. Find all the zeroes of the cosine function on the interval \(\left(−\dfrac{\pi}{2}, \dfrac{7\pi}{2}\right]\).
7. Preview: using your knowledge of function transformations and the cosine graph, predict what the graph of \(f(x)=2\cos x\) will look like.
8. Preview: using your knowledge of function transformations and the cosine graph, predict what the graph \(g(x)=\cos x+2\) of will look like.
9. Preview: using your knowledge of function transformations and the cosine graph, predict what the graph of \(h(x)=\cos (x−\pi )\) will look like.
10. Preview: using your knowledge of function transformations and the cosine graph, predict what the graph of \(k(x)=−\cos x\) will look like.
Review (Answers)
To see the Review answers, open this PDF file and look for section 5.2.
Vocabulary
| Term | Definition |
|---|---|
| cosine | The cosine of an angle in a right triangle is a value found by dividing the length of the side adjacent the given angle by the length of the hypotenuse. |
| sine | The sine of an angle in a right triangle is a value found by dividing the length of the side opposite the given angle by the length of the hypotenuse. |
| sinusoidal function family | The sinusoidal function family refers to either sine or cosine waves since they are the same except for a horizontal shift. This function family is also called the periodic function family because the function repeats after a given period of time. |
| Transformations | Transformations are used to change the graph of a parent function into the graph of a more complex function. |
| unit circle | The unit circle is a circle of radius one, centered at the origin. |
| Zeroes | The zeroes of a function \(f(x)\) are the values of \(x\) that cause \(f(x)\) to be equal to zero. |
Additional Resources
Video: Transformation of Trigonometric Graphs: Amplitude, Period, and Phase Shift
Real World: Banding Together