
2.6.8: Trigonometric Identities and Equations
- Page ID
- 14934
\( \newcommand{\vecs}[1]{\overset { \scriptstyle \rightharpoonup} {\mathbf{#1}} } \)
\( \newcommand{\vecd}[1]{\overset{-\!-\!\rightharpoonup}{\vphantom{a}\smash {#1}}} \)
\( \newcommand{\id}{\mathrm{id}}\) \( \newcommand{\Span}{\mathrm{span}}\)
( \newcommand{\kernel}{\mathrm{null}\,}\) \( \newcommand{\range}{\mathrm{range}\,}\)
\( \newcommand{\RealPart}{\mathrm{Re}}\) \( \newcommand{\ImaginaryPart}{\mathrm{Im}}\)
\( \newcommand{\Argument}{\mathrm{Arg}}\) \( \newcommand{\norm}[1]{\| #1 \|}\)
\( \newcommand{\inner}[2]{\langle #1, #2 \rangle}\)
\( \newcommand{\Span}{\mathrm{span}}\)
\( \newcommand{\id}{\mathrm{id}}\)
\( \newcommand{\Span}{\mathrm{span}}\)
\( \newcommand{\kernel}{\mathrm{null}\,}\)
\( \newcommand{\range}{\mathrm{range}\,}\)
\( \newcommand{\RealPart}{\mathrm{Re}}\)
\( \newcommand{\ImaginaryPart}{\mathrm{Im}}\)
\( \newcommand{\Argument}{\mathrm{Arg}}\)
\( \newcommand{\norm}[1]{\| #1 \|}\)
\( \newcommand{\inner}[2]{\langle #1, #2 \rangle}\)
\( \newcommand{\Span}{\mathrm{span}}\) \( \newcommand{\AA}{\unicode[.8,0]{x212B}}\)
\( \newcommand{\vectorA}[1]{\vec{#1}} % arrow\)
\( \newcommand{\vectorAt}[1]{\vec{\text{#1}}} % arrow\)
\( \newcommand{\vectorB}[1]{\overset { \scriptstyle \rightharpoonup} {\mathbf{#1}} } \)
\( \newcommand{\vectorC}[1]{\textbf{#1}} \)
\( \newcommand{\vectorD}[1]{\overrightarrow{#1}} \)
\( \newcommand{\vectorDt}[1]{\overrightarrow{\text{#1}}} \)
\( \newcommand{\vectE}[1]{\overset{-\!-\!\rightharpoonup}{\vphantom{a}\smash{\mathbf {#1}}}} \)
\( \newcommand{\vecs}[1]{\overset { \scriptstyle \rightharpoonup} {\mathbf{#1}} } \)
\( \newcommand{\vecd}[1]{\overset{-\!-\!\rightharpoonup}{\vphantom{a}\smash {#1}}} \)
\(\newcommand{\avec}{\mathbf a}\) \(\newcommand{\bvec}{\mathbf b}\) \(\newcommand{\cvec}{\mathbf c}\) \(\newcommand{\dvec}{\mathbf d}\) \(\newcommand{\dtil}{\widetilde{\mathbf d}}\) \(\newcommand{\evec}{\mathbf e}\) \(\newcommand{\fvec}{\mathbf f}\) \(\newcommand{\nvec}{\mathbf n}\) \(\newcommand{\pvec}{\mathbf p}\) \(\newcommand{\qvec}{\mathbf q}\) \(\newcommand{\svec}{\mathbf s}\) \(\newcommand{\tvec}{\mathbf t}\) \(\newcommand{\uvec}{\mathbf u}\) \(\newcommand{\vvec}{\mathbf v}\) \(\newcommand{\wvec}{\mathbf w}\) \(\newcommand{\xvec}{\mathbf x}\) \(\newcommand{\yvec}{\mathbf y}\) \(\newcommand{\zvec}{\mathbf z}\) \(\newcommand{\rvec}{\mathbf r}\) \(\newcommand{\mvec}{\mathbf m}\) \(\newcommand{\zerovec}{\mathbf 0}\) \(\newcommand{\onevec}{\mathbf 1}\) \(\newcommand{\real}{\mathbb R}\) \(\newcommand{\twovec}[2]{\left[\begin{array}{r}#1 \\ #2 \end{array}\right]}\) \(\newcommand{\ctwovec}[2]{\left[\begin{array}{c}#1 \\ #2 \end{array}\right]}\) \(\newcommand{\threevec}[3]{\left[\begin{array}{r}#1 \\ #2 \\ #3 \end{array}\right]}\) \(\newcommand{\cthreevec}[3]{\left[\begin{array}{c}#1 \\ #2 \\ #3 \end{array}\right]}\) \(\newcommand{\fourvec}[4]{\left[\begin{array}{r}#1 \\ #2 \\ #3 \\ #4 \end{array}\right]}\) \(\newcommand{\cfourvec}[4]{\left[\begin{array}{c}#1 \\ #2 \\ #3 \\ #4 \end{array}\right]}\) \(\newcommand{\fivevec}[5]{\left[\begin{array}{r}#1 \\ #2 \\ #3 \\ #4 \\ #5 \\ \end{array}\right]}\) \(\newcommand{\cfivevec}[5]{\left[\begin{array}{c}#1 \\ #2 \\ #3 \\ #4 \\ #5 \\ \end{array}\right]}\) \(\newcommand{\mattwo}[4]{\left[\begin{array}{rr}#1 \amp #2 \\ #3 \amp #4 \\ \end{array}\right]}\) \(\newcommand{\laspan}[1]{\text{Span}\{#1\}}\) \(\newcommand{\bcal}{\cal B}\) \(\newcommand{\ccal}{\cal C}\) \(\newcommand{\scal}{\cal S}\) \(\newcommand{\wcal}{\cal W}\) \(\newcommand{\ecal}{\cal E}\) \(\newcommand{\coords}[2]{\left\{#1\right\}_{#2}}\) \(\newcommand{\gray}[1]{\color{gray}{#1}}\) \(\newcommand{\lgray}[1]{\color{lightgray}{#1}}\) \(\newcommand{\rank}{\operatorname{rank}}\) \(\newcommand{\row}{\text{Row}}\) \(\newcommand{\col}{\text{Col}}\) \(\renewcommand{\row}{\text{Row}}\) \(\newcommand{\nul}{\text{Nul}}\) \(\newcommand{\var}{\text{Var}}\) \(\newcommand{\corr}{\text{corr}}\) \(\newcommand{\len}[1]{\left|#1\right|}\) \(\newcommand{\bbar}{\overline{\bvec}}\) \(\newcommand{\bhat}{\widehat{\bvec}}\) \(\newcommand{\bperp}{\bvec^\perp}\) \(\newcommand{\xhat}{\widehat{\xvec}}\) \(\newcommand{\vhat}{\widehat{\vvec}}\) \(\newcommand{\uhat}{\widehat{\uvec}}\) \(\newcommand{\what}{\widehat{\wvec}}\) \(\newcommand{\Sighat}{\widehat{\Sigma}}\) \(\newcommand{\lt}{<}\) \(\newcommand{\gt}{>}\) \(\newcommand{\amp}{&}\) \(\definecolor{fillinmathshade}{gray}{0.9}\)Based on amplitude, frequency, and horizontal and vertical translations.
Your math teacher has decided to give you a quiz to see if you recognize how to combine changes to graphs of sine and cosine functions. You recall that you've learned about shifting graphs, as well as stretching/dilating them. But now your teacher wants to see if you know how to combine both of these effects into one graph. She gives you the equation:
\(f(x)=3+7\sin \left(4\left(x+\dfrac{\pi }{2}\right)\right)\)
and asks you to plot the equation, and then identify what each part of the above equation does to change the graph.
Trigonometric Identities and Equations
The general equations to translate and dilate sine and cosine waves both horizontally and vertically are: \(y=D\pm A\cos (B(x\pm C))\) or \(y=D\pm A\sin (B(x\pm C))\), where A is the amplitude, B is the frequency, C is the horizontal translation, and D is the vertical translation.
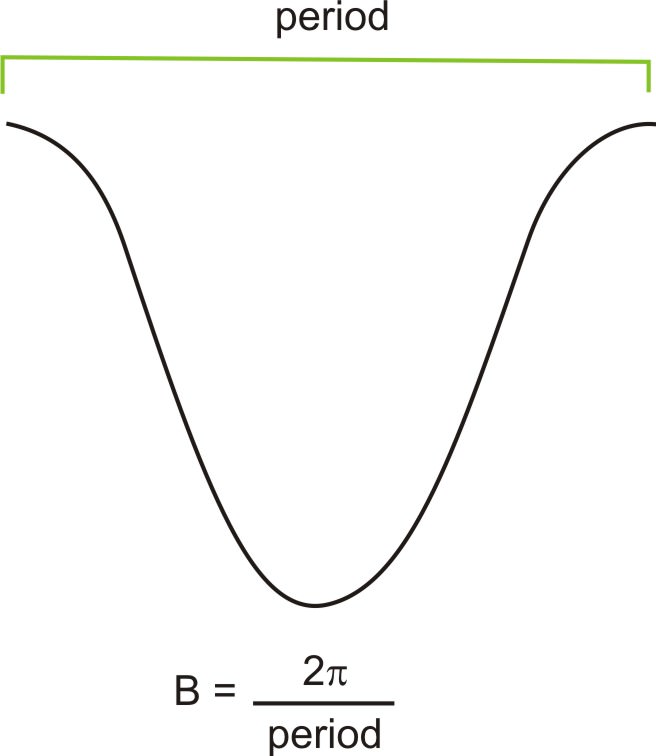
Recall the relationship between period, p, and frequency, B.
\(p=\dfrac{2\pi }{B}\) and \(B=\dfrac{2\pi }{p}\)
With this knowledge, we should be able to sketch any sine or cosine function as well as write an equation given its graph.
Let's take a look at some problems involving trigonometric identities and equations.
1. Given the function: \(f(x)=1+2\sin (2(x+\pi ))\)
a. Identify the period, amplitude, and frequency.
From the equation, the amplitude is 2 and the frequency is also 2. To find the period we use:
\(p=\dfrac{2\pi }{B}\rightarrow p=\dfrac{2\pi }{2}=\pi\)
So, there are two complete waves from \([0,2\pi ]\) and each individual wave requires \(\pi \) radians to complete.
b. Explain any vertical or horizontal translations present in the equation.
\(D=1\) and \(C=−\pi \), so this graph has been translated 1 unit up, and \pi units to the left.
c. Sketch the graph from \(-2 \pi\) to \(2 \pi\).
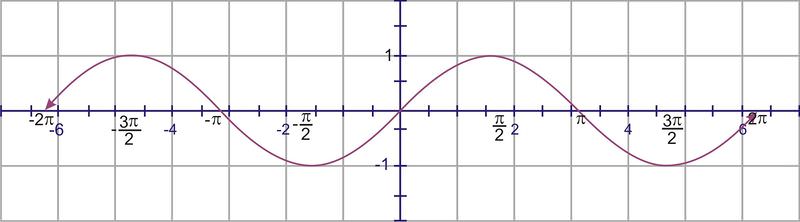
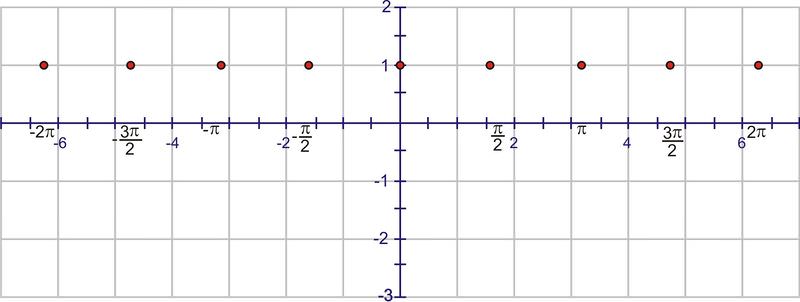
To sketch the graph, start with the graph of \(y=\sin (x)\)
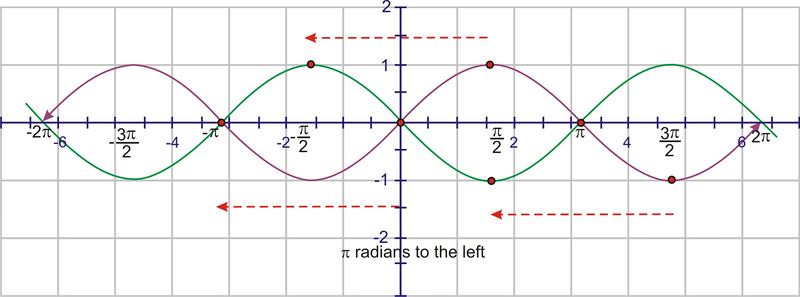
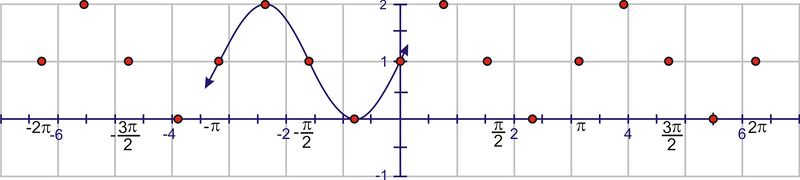
Translate the graph \(\pi \) units to the left (the C value).
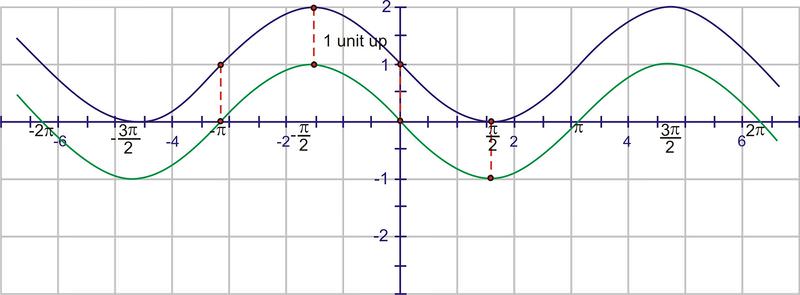
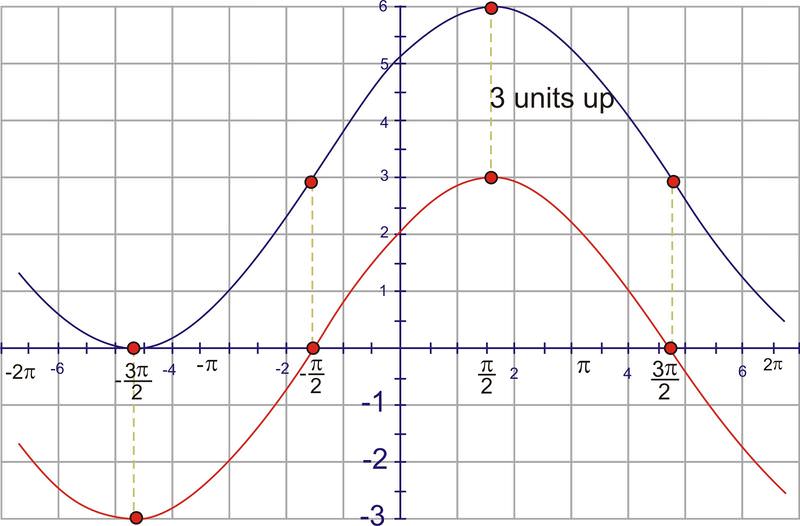
Next, move the graph 1 unit up (D value)
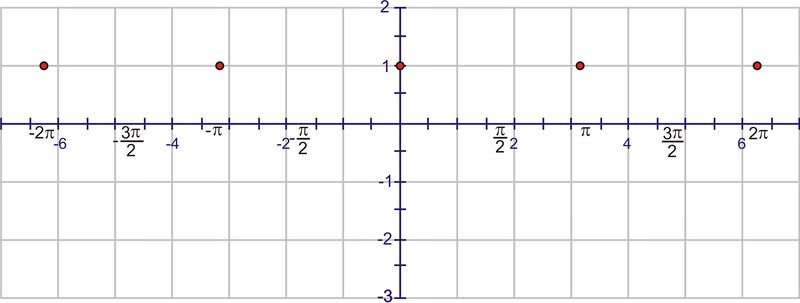
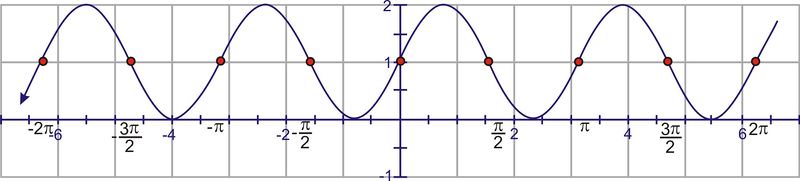
Now we can add the dilations. Remember that the “starting point” of the wave is \(−\pi \) because of the horizontal translation. A normal sine wave takes \(2 \pi\) units to complete a cycle, but this wave completes one cycle in \(\pi \) units. The first wave will complete at 0, then we will see a second wave from 0 to \(\pi \) and a third from \(\pi \) to \(2 \pi\). Start by placing points at these values:
Using symmetry, each interval needs to cross the line \(y=1\) through the center of the wave.
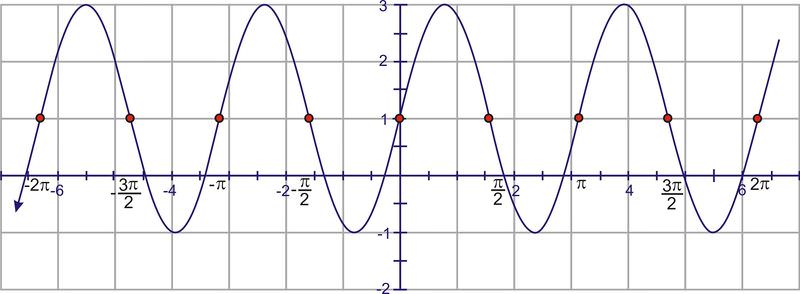
One sine wave contains a “mountain” and a “valley”. The mountain “peak” and the valley low point must occur halfway between the points above.
Extend the curve through the domain.
Finally, extend the minimum and maximum points to match the amplitude of 2.
2. Given the function: \(f(x)=3+3\cos \left(\dfrac{1}{2}\left(x−\dfrac{\pi }{2}\right)\right)\)
a. Identify the period, amplitude, and frequency.
From the equation, the amplitude is 3 and the frequency is \(\dfrac{1}{2}\). To find the period we use:
\(\text{period}=\dfrac{2\pi }{\dfrac{1}{2}}=4\pi\)
So, there is only one half of a cosine curve from 0 to \(2 \pi\) and each individual wave requires \(4\pi \) radians to complete.
b. Explain any vertical or horizontal translations present in the equation.
\(D=3\) and \(C=\dfrac{\pi }{2}\), so this graph has been translated 3 units up, and \(\dfrac{\pi }{2}\) units to the right.
c. Sketch the graph from \(-2 \pi\) to \(2 \pi\).
To sketch the graph, start with the graph of \(y=\cos (x)\)
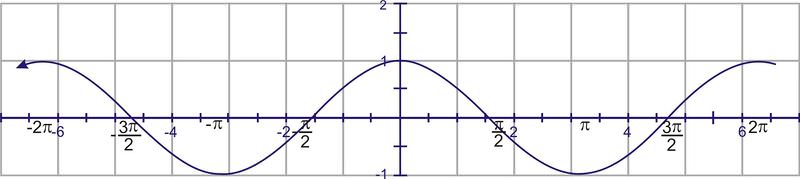
Adjust the amplitude so the cosine wave reaches up to 3 and down to negative three. This affects the maximum points, but the points on the x−axis remain the same. These points are sometimes called nodes.
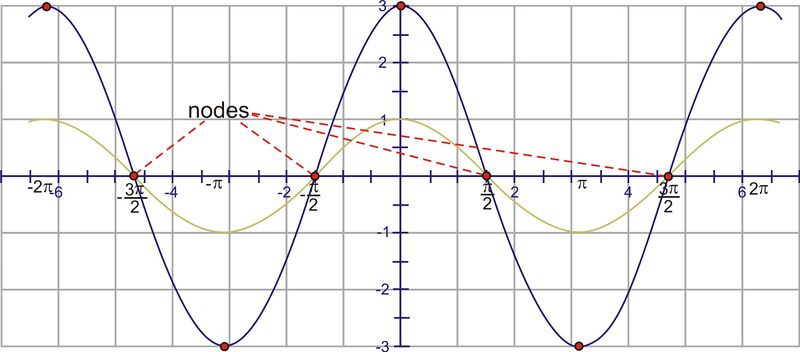
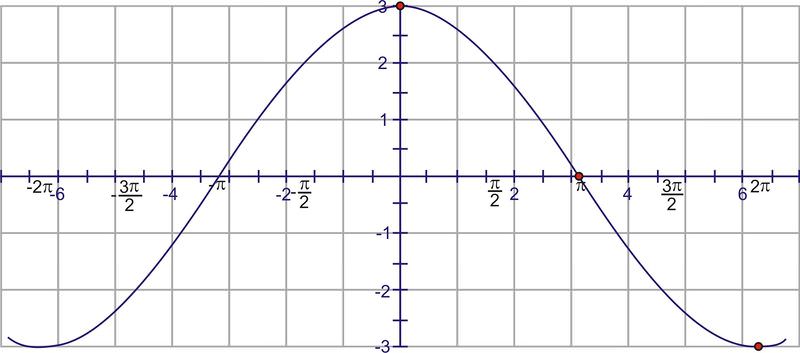
According to the period, we should see one of these shapes every \(4\pi \) units. Because the interval specified is \([−2\pi ,2\pi ]\) and the cosine curve “starts” at the y−axis, at \((0, 3)\) and at \(2\pi \) the value is -3. Conversely, at \(−2\pi \), the function is also -3.
Now, shift the graph \(\dfrac{\pi }{2}\) units to the right.
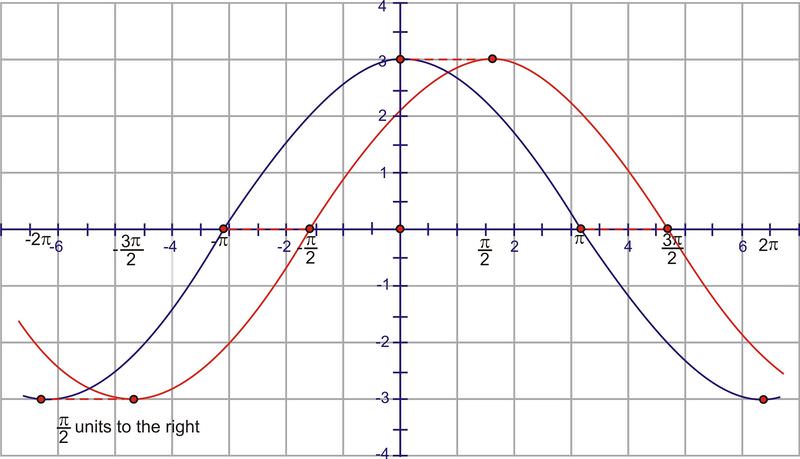
Finally, we need to adjust for the vertical shift by moving it up 3 units.
3. Find the equation of the sinusoid graphed here.

First of all, remember that either sine or cosine could be used to model these graphs. However, it is usually easier to use cosine because the horizontal shift is easier to locate in most cases. Therefore, the model that we will be using is \(y=D\pm A\cos (B(x\pm C)) \).
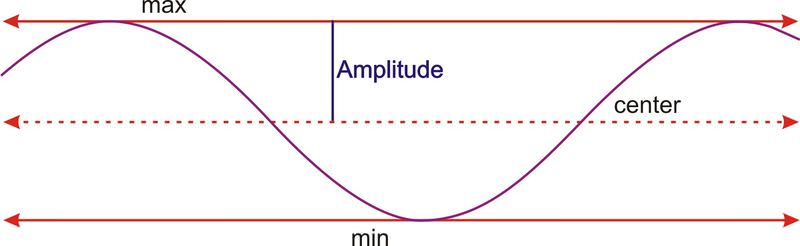
First, if we think of the graph as a cosine function, it has a horizontal translation of zero. The maximum point is also the y−intercept of the graph, so there is no need to shift the graph horizontally and therefore, \(C=0\). The amplitude is the height from the center of the wave. If you can’t find the center of the wave by sight, you can calculate it. The center should be halfway between the highest and the lowest points, which is really the average of the maximum and minimum. This value will actually be the vertical shift, or D value.
\(D=\text{center}=\dfrac{60+−20}{2}=\dfrac{40}{2}=20\)
The amplitude is the height from the center line, or vertical shift, to either the minimum or the maximum. So, \(A=60−20=40\).
The last value to find is the frequency. In order to do so, we must first find the period. The period is the distance required for one complete wave. To find this value, look at the horizontal distance between two consecutive maximum points.
On our graph, from maximum to maximum is 3.
Therefore, the period is 3, so the frequency is \(B=\dfrac{2\pi }{3}\).
We have now calculated each of the four parameters necessary to write the equation. Replacing them in the equation gives:
\(y=20+40\cos \dfrac{2\pi }{3} x\)
If we had chosen to model this curve with a sine function instead, the amplitude, period and frequency, as well as the vertical shift would all be the same. The only difference would be the horizontal shift. The sine wave starts in the middle of an upward sloped section of the curve as shown by the red circle.
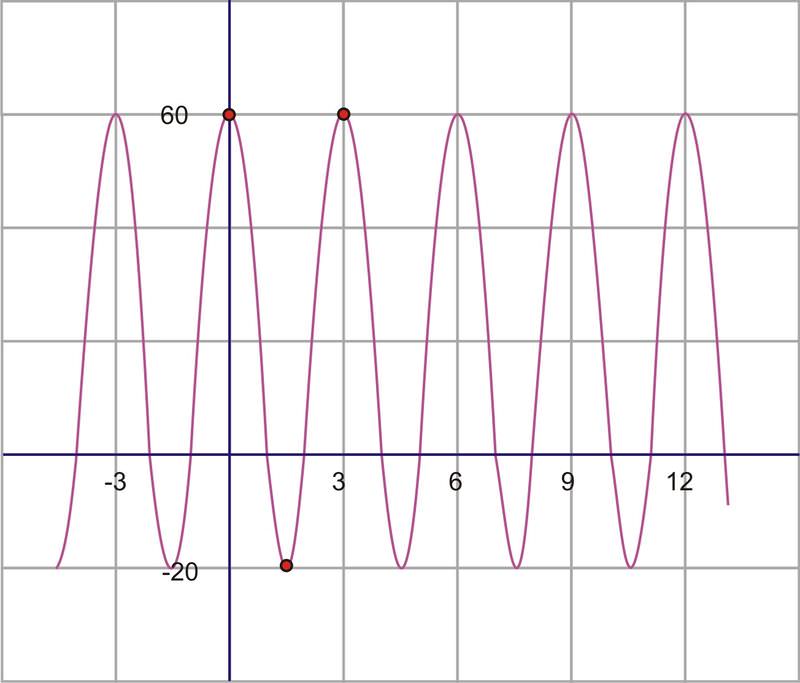
This point intersects with the vertical translation line and is a third of the distance back to -3. So, in this case, the sine wave has been translated 1 unit to the left. The equation using a sine function instead would have been: \(y=20+40\sin \left(\dfrac{2\pi }{3}(x+1)\right)\)
Earlier, you were asked to plot \(f(x)=3+7\sin \left(4\left(x+\dfrac{\pi }{2}\right)\right)\).
Solution
With your advanced knowledge of sinusoidal equations, you can identify in the equation:
\((f(x)=3+7\sin \left(4\left(x+\dfrac{\pi }{2}\right)\right)\)
The vertical shift of the graph is 3 units up. The amplitude of the graph is 7. The horizontal shift of the graph is \(\dfrac{\pi }{2}\) units to the left. The frequency is 4.
Since the frequency is 4, the period can be calculated:
\(\begin{aligned} p&=\dfrac{2\pi}{f} \\ p&=\dfrac{2\pi }{4} \\ p&=\dfrac{\pi }{2}\end{aligned}\)
This means that the graph takes \pi 2 units to make one complete cycle.
The graph of this equation looks like this:

Identify the amplitude, period, frequency, maximum and minimum points, vertical shift, and horizontal shift of \(y=2+3\sin (2(x−1))\).
Solution
This is a sine wave that has been translated 1 unit to the right and 2 units up. The amplitude is 3 and the frequency is 2. The period of the graph is \(\pi \). The function reaches a maximum point of 5 and a minimum of -1.
Identify the amplitude, period, frequency, maximum and minimum points, vertical shift, and horizontal shift of \(y=−1+\sin \left(\pi \left(x+\dfrac{\pi }{3}\right)\right)\).
Solution
This is a sine wave that has been translated 1 unit down and \(\dfrac{\pi }{3}\) radians to the left. The amplitude is 1 and the period is 2. The frequency of the graph is \(\pi \). The function reaches a maximum point of 0 and a minimum of -2.
Identify the amplitude, period, frequency, maximum and minimum points, vertical shift, and horizontal shift of \(y=\cos (40(x−120))+5\).
Solution
This is a cosine wave that has been translated 5 units up and 120 radians to the right. The amplitude is 1 and the frequency is 40. The period of the graph is \(\dfrac{\pi }{20}\). The function reaches a maximum point of 6 and a minimum of 4.
Review
For each equation below, identify the period, amplitude, frequency, and any vertical/horizontal translations.
- \(y=2−4\cos \left(\dfrac{2}{3}(x−3)\right)\)
- \(y=3+\dfrac{1}{2}\sin \left(\dfrac{1}{2}(x−\pi )\right)\)
- \(y=1+5\cos (4(x+\dfrac{\pi }{2}))\)
- \(y=4−\cos (2(x+1))\)
- \(y=3+2\sin (x−4)\)
Graph each of the following equations from \(−2\pi \) to \(2\pi \).
- \(y=1−3\sin \left(\dfrac{1}{3}(x−\pi )\right)\)
- \(y=5+12\sin \left(\dfrac{1}{2}(x−2)\right)\)
- \(y=2+\cos \left(4\left(x+\dfrac{\pi }{2}\right)\right)\)
- \(y=4+2\cos \left(2\left(x+3\right)\right)\)
- \(y=2−3\sin \left(x−\dfrac{3\pi }{2}\right)\)
Find the equation of each sinusoid.
-
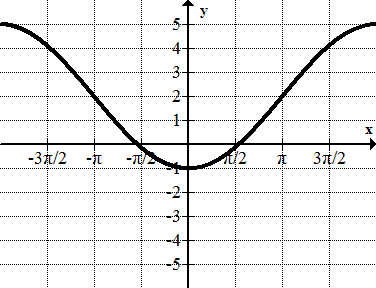
Figure \(\PageIndex{19}\) -
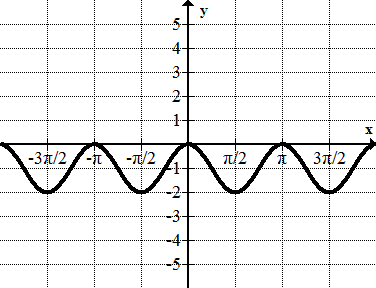
Figure \(\PageIndex{20}\) -
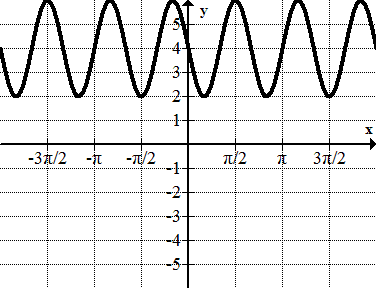
Figure \(\PageIndex{21}\) -
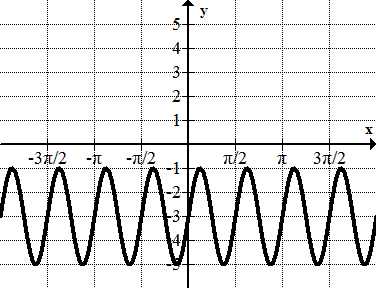
Figure \(\PageIndex{22}\) -
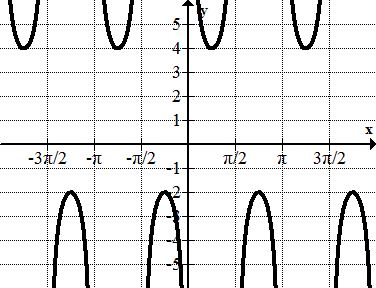
Figure \(\PageIndex{23}\)
Review (Answers)
To see the Review answers, open this PDF file and look for section 2.17.
Vocabulary
| Term | Definition |
|---|---|
| Trigonometric General Equations | The trigonometric general equations are \(y=D\pm A\cos (B(x\pm C))\) or \(y=D\pm A\sin (B(x\pm C))\), where A is the amplitude, B is the frequency, C is the horizontal translation, and D is the vertical translation. |
Additional Resources
Video: Example: Graphing a Transformation of Sine and cosine
Practice: Trigonometric Identities and Equations