
2.9: Map Projections
- Page ID
- 5330
\( \newcommand{\vecs}[1]{\overset { \scriptstyle \rightharpoonup} {\mathbf{#1}} } \)
\( \newcommand{\vecd}[1]{\overset{-\!-\!\rightharpoonup}{\vphantom{a}\smash {#1}}} \)
\( \newcommand{\dsum}{\displaystyle\sum\limits} \)
\( \newcommand{\dint}{\displaystyle\int\limits} \)
\( \newcommand{\dlim}{\displaystyle\lim\limits} \)
\( \newcommand{\id}{\mathrm{id}}\) \( \newcommand{\Span}{\mathrm{span}}\)
( \newcommand{\kernel}{\mathrm{null}\,}\) \( \newcommand{\range}{\mathrm{range}\,}\)
\( \newcommand{\RealPart}{\mathrm{Re}}\) \( \newcommand{\ImaginaryPart}{\mathrm{Im}}\)
\( \newcommand{\Argument}{\mathrm{Arg}}\) \( \newcommand{\norm}[1]{\| #1 \|}\)
\( \newcommand{\inner}[2]{\langle #1, #2 \rangle}\)
\( \newcommand{\Span}{\mathrm{span}}\)
\( \newcommand{\id}{\mathrm{id}}\)
\( \newcommand{\Span}{\mathrm{span}}\)
\( \newcommand{\kernel}{\mathrm{null}\,}\)
\( \newcommand{\range}{\mathrm{range}\,}\)
\( \newcommand{\RealPart}{\mathrm{Re}}\)
\( \newcommand{\ImaginaryPart}{\mathrm{Im}}\)
\( \newcommand{\Argument}{\mathrm{Arg}}\)
\( \newcommand{\norm}[1]{\| #1 \|}\)
\( \newcommand{\inner}[2]{\langle #1, #2 \rangle}\)
\( \newcommand{\Span}{\mathrm{span}}\) \( \newcommand{\AA}{\unicode[.8,0]{x212B}}\)
\( \newcommand{\vectorA}[1]{\vec{#1}} % arrow\)
\( \newcommand{\vectorAt}[1]{\vec{\text{#1}}} % arrow\)
\( \newcommand{\vectorB}[1]{\overset { \scriptstyle \rightharpoonup} {\mathbf{#1}} } \)
\( \newcommand{\vectorC}[1]{\textbf{#1}} \)
\( \newcommand{\vectorD}[1]{\overrightarrow{#1}} \)
\( \newcommand{\vectorDt}[1]{\overrightarrow{\text{#1}}} \)
\( \newcommand{\vectE}[1]{\overset{-\!-\!\rightharpoonup}{\vphantom{a}\smash{\mathbf {#1}}}} \)
\( \newcommand{\vecs}[1]{\overset { \scriptstyle \rightharpoonup} {\mathbf{#1}} } \)
\(\newcommand{\longvect}{\overrightarrow}\)
\( \newcommand{\vecd}[1]{\overset{-\!-\!\rightharpoonup}{\vphantom{a}\smash {#1}}} \)
\(\newcommand{\avec}{\mathbf a}\) \(\newcommand{\bvec}{\mathbf b}\) \(\newcommand{\cvec}{\mathbf c}\) \(\newcommand{\dvec}{\mathbf d}\) \(\newcommand{\dtil}{\widetilde{\mathbf d}}\) \(\newcommand{\evec}{\mathbf e}\) \(\newcommand{\fvec}{\mathbf f}\) \(\newcommand{\nvec}{\mathbf n}\) \(\newcommand{\pvec}{\mathbf p}\) \(\newcommand{\qvec}{\mathbf q}\) \(\newcommand{\svec}{\mathbf s}\) \(\newcommand{\tvec}{\mathbf t}\) \(\newcommand{\uvec}{\mathbf u}\) \(\newcommand{\vvec}{\mathbf v}\) \(\newcommand{\wvec}{\mathbf w}\) \(\newcommand{\xvec}{\mathbf x}\) \(\newcommand{\yvec}{\mathbf y}\) \(\newcommand{\zvec}{\mathbf z}\) \(\newcommand{\rvec}{\mathbf r}\) \(\newcommand{\mvec}{\mathbf m}\) \(\newcommand{\zerovec}{\mathbf 0}\) \(\newcommand{\onevec}{\mathbf 1}\) \(\newcommand{\real}{\mathbb R}\) \(\newcommand{\twovec}[2]{\left[\begin{array}{r}#1 \\ #2 \end{array}\right]}\) \(\newcommand{\ctwovec}[2]{\left[\begin{array}{c}#1 \\ #2 \end{array}\right]}\) \(\newcommand{\threevec}[3]{\left[\begin{array}{r}#1 \\ #2 \\ #3 \end{array}\right]}\) \(\newcommand{\cthreevec}[3]{\left[\begin{array}{c}#1 \\ #2 \\ #3 \end{array}\right]}\) \(\newcommand{\fourvec}[4]{\left[\begin{array}{r}#1 \\ #2 \\ #3 \\ #4 \end{array}\right]}\) \(\newcommand{\cfourvec}[4]{\left[\begin{array}{c}#1 \\ #2 \\ #3 \\ #4 \end{array}\right]}\) \(\newcommand{\fivevec}[5]{\left[\begin{array}{r}#1 \\ #2 \\ #3 \\ #4 \\ #5 \\ \end{array}\right]}\) \(\newcommand{\cfivevec}[5]{\left[\begin{array}{c}#1 \\ #2 \\ #3 \\ #4 \\ #5 \\ \end{array}\right]}\) \(\newcommand{\mattwo}[4]{\left[\begin{array}{rr}#1 \amp #2 \\ #3 \amp #4 \\ \end{array}\right]}\) \(\newcommand{\laspan}[1]{\text{Span}\{#1\}}\) \(\newcommand{\bcal}{\cal B}\) \(\newcommand{\ccal}{\cal C}\) \(\newcommand{\scal}{\cal S}\) \(\newcommand{\wcal}{\cal W}\) \(\newcommand{\ecal}{\cal E}\) \(\newcommand{\coords}[2]{\left\{#1\right\}_{#2}}\) \(\newcommand{\gray}[1]{\color{gray}{#1}}\) \(\newcommand{\lgray}[1]{\color{lightgray}{#1}}\) \(\newcommand{\rank}{\operatorname{rank}}\) \(\newcommand{\row}{\text{Row}}\) \(\newcommand{\col}{\text{Col}}\) \(\renewcommand{\row}{\text{Row}}\) \(\newcommand{\nul}{\text{Nul}}\) \(\newcommand{\var}{\text{Var}}\) \(\newcommand{\corr}{\text{corr}}\) \(\newcommand{\len}[1]{\left|#1\right|}\) \(\newcommand{\bbar}{\overline{\bvec}}\) \(\newcommand{\bhat}{\widehat{\bvec}}\) \(\newcommand{\bperp}{\bvec^\perp}\) \(\newcommand{\xhat}{\widehat{\xvec}}\) \(\newcommand{\vhat}{\widehat{\vvec}}\) \(\newcommand{\uhat}{\widehat{\uvec}}\) \(\newcommand{\what}{\widehat{\wvec}}\) \(\newcommand{\Sighat}{\widehat{\Sigma}}\) \(\newcommand{\lt}{<}\) \(\newcommand{\gt}{>}\) \(\newcommand{\amp}{&}\) \(\definecolor{fillinmathshade}{gray}{0.9}\)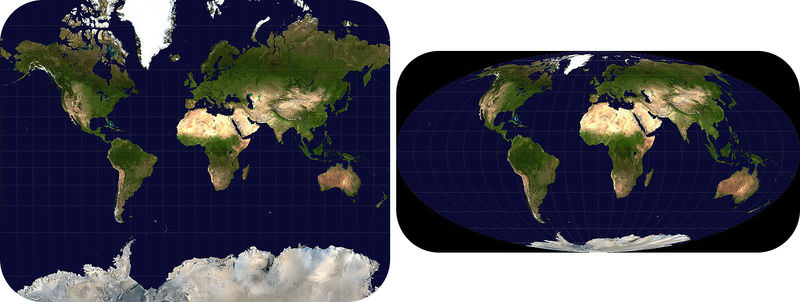
How does Greenland change size?
Greenland does not change size! Different map projections make Greenland appear to be a different size. The Mercator projection makes everything that is near the polar areas appear too large. The Mollweide projection distorts the size of the polar regions much less. To see the actual size of Greenland, look at a globe.
Map Projections
Earth is a round, three-dimensional ball. In a small area, Earth looks flat, so it is not hard to make accurate maps of a small place. When mapmakers want to map the round Earth on flat paper, they use projections. What happens if you try to flatten out the skin of a peeled orange? Or if you try to gift wrap a soccer ball? To flatten out, the orange peel must rip, and its shape must become distorted. To wrap a round object with flat paper requires lots of extra cuts and folds. A projection is a way to represent Earth’s curved surface on flat paper (Figure below).

A map projection translates Earth's curved surface onto two dimensions.
There are many types of projections. Each uses a different way to change three dimensions into two dimensions.
There are two basic methods that mapmakers use in projections:
- The mapmaker “slices” the sphere in some way and unfolds it to make a flat map. This is like flattening out an orange peel.
- The mapmaker can look at the sphere from a certain point and then translate this view onto a flat paper.
Let’s look at a few commonly used projections.
Mercator Projection
In 1569, Gerardus Mercator (1512-1594) (Figure below) figured out a way to make a flat map of our round world. This is called the Mercator projection.
Imagine wrapping the round, ball-shaped Earth with a big, flat piece of paper. First you make a tube or a cylinder. The cylinder touches Earth at the Equator. The poles are the farthest points from the cylinder. Now shine a light from the inside of your model Earth out to the cylinder. The image projected onto the paper is a Mercator projection. Where does the projection represent Earth best? Where is it worst? Your map would be most correct at the Equator. The shapes and sizes of continents become more stretched out near the poles. Early sailors and navigators found the Mercator map useful because most explorations were located near the Equator. Many world maps still use the Mercator projection.

A Mercator projection translates the curved surface of Earth onto a cylinder.
The Mercator projection is best within 15° north or south of the Equator. Landmasses or countries outside that zone get stretched out of shape. The further the feature is from the Equator, the more out of shape it is stretched. For example, if you look at Greenland on a globe, you see it is a relatively small country near the North Pole. But look at the Mercator projection above. Greenland looks almost as big the United States. Because Greenland is closer to the pole, the continent's shape and size are greatly increased. The United States is closer to its true dimensions. Why is this true?
In a Mercator projection, all compass directions are straight lines. This makes it a good type of map for navigation. The top of the map is north, the bottom is south, the left side is west and the right side is east. However, because it is a flat map of a curved surface, a straight line on the map is not the shortest distance between the two points it connects.
Conic Projection
Instead of a cylinder, you could wrap the flat paper into a cone. Conic map projections use a cone shape to better represent regions near the poles (Figure below). Conic projections are best where the cone shape touches the globe. This is along a line of latitude, usually the Equator.

A conic map projection wraps Earth with a cone shape rather than a cylinder.
Gnomonic Projection
What if you want a different approach? Let's say you don't want to wrap a flat piece of paper around a round object. You could put a flat piece of paper right on the area that you want to map. This type of map is called a gnomonic map projection (Figure below). The paper touches Earth only at one point. The sizes and shapes of countries near that point are good. The poles are often mapped this way to avoid distortion. A gnomic projection is best for use over a small area.

A gnomonic projection places a flat piece of paper on a point somewhere on Earth and projects an image from that point.
Robinson Projection
In 1963, Arthur Robinson made a map with more accurate sizes and shapes of land areas. He did this using mathematical formulas. The formulas could directly translate coordinates onto the map. This type of projection is shaped like an oval rather than a rectangle (Figure below).

A Robinson projection better represents the true shapes and sizes of land areas.
Robinson’s map is more accurate than a Mercator projection. The shapes and sizes of continents are closer to true. Robinson's map is best within 45° of the Equator. Distances along the Equator and the lines parallel to it are true. However, the scales along each line of latitude are different. In 1988, the National Geographic Society began to use Robinson’s projection for its world maps.
Summary
- A map projection is a way to show a three-dimensional figure in two dimensions.
- All map projections have some distortion. Different types have distortions in different locations and of different amounts.
- Robinson's project is different from the rest because it uses mathematical formulas. Other projections are best at one point.
Review
- Why does a map projection distort Earth's features? Where does it distort the features most?
- Which type of projection is best for someone interested in studying Greenland? The worst?
- Why would the Mercator projection have been okay for use in the 16th century?
Explore More
Use the resource below to answer the questions that follow.
- How is making a map of Earth like trying to flatten an orange peel? What problems occur when making a map of Earth?
- What is the choice you need to make when you create or use a map of the world?
- In a Mercator Projection, what is accurate and what isn’t? What was a Mercator map made to be able to do?
- In Lambert’s Cylindrical Projection, where is the distortion greatest? What is good? What is distorted?
- In the Winkel Tripel Projection, what are the three things that need to be compromised?
- What is a Dymaxion Projection good at showing and what is it commonly used for?
- What is the best type of map?