
2.5: V. Developing Additional Central Ideas about Thermal Phenomena
- Page ID
- 15117
\( \newcommand{\vecs}[1]{\overset { \scriptstyle \rightharpoonup} {\mathbf{#1}} } \)
\( \newcommand{\vecd}[1]{\overset{-\!-\!\rightharpoonup}{\vphantom{a}\smash {#1}}} \)
\( \newcommand{\id}{\mathrm{id}}\) \( \newcommand{\Span}{\mathrm{span}}\)
( \newcommand{\kernel}{\mathrm{null}\,}\) \( \newcommand{\range}{\mathrm{range}\,}\)
\( \newcommand{\RealPart}{\mathrm{Re}}\) \( \newcommand{\ImaginaryPart}{\mathrm{Im}}\)
\( \newcommand{\Argument}{\mathrm{Arg}}\) \( \newcommand{\norm}[1]{\| #1 \|}\)
\( \newcommand{\inner}[2]{\langle #1, #2 \rangle}\)
\( \newcommand{\Span}{\mathrm{span}}\)
\( \newcommand{\id}{\mathrm{id}}\)
\( \newcommand{\Span}{\mathrm{span}}\)
\( \newcommand{\kernel}{\mathrm{null}\,}\)
\( \newcommand{\range}{\mathrm{range}\,}\)
\( \newcommand{\RealPart}{\mathrm{Re}}\)
\( \newcommand{\ImaginaryPart}{\mathrm{Im}}\)
\( \newcommand{\Argument}{\mathrm{Arg}}\)
\( \newcommand{\norm}[1]{\| #1 \|}\)
\( \newcommand{\inner}[2]{\langle #1, #2 \rangle}\)
\( \newcommand{\Span}{\mathrm{span}}\) \( \newcommand{\AA}{\unicode[.8,0]{x212B}}\)
\( \newcommand{\vectorA}[1]{\vec{#1}} % arrow\)
\( \newcommand{\vectorAt}[1]{\vec{\text{#1}}} % arrow\)
\( \newcommand{\vectorB}[1]{\overset { \scriptstyle \rightharpoonup} {\mathbf{#1}} } \)
\( \newcommand{\vectorC}[1]{\textbf{#1}} \)
\( \newcommand{\vectorD}[1]{\overrightarrow{#1}} \)
\( \newcommand{\vectorDt}[1]{\overrightarrow{\text{#1}}} \)
\( \newcommand{\vectE}[1]{\overset{-\!-\!\rightharpoonup}{\vphantom{a}\smash{\mathbf {#1}}}} \)
\( \newcommand{\vecs}[1]{\overset { \scriptstyle \rightharpoonup} {\mathbf{#1}} } \)
\( \newcommand{\vecd}[1]{\overset{-\!-\!\rightharpoonup}{\vphantom{a}\smash {#1}}} \)
\(\newcommand{\avec}{\mathbf a}\) \(\newcommand{\bvec}{\mathbf b}\) \(\newcommand{\cvec}{\mathbf c}\) \(\newcommand{\dvec}{\mathbf d}\) \(\newcommand{\dtil}{\widetilde{\mathbf d}}\) \(\newcommand{\evec}{\mathbf e}\) \(\newcommand{\fvec}{\mathbf f}\) \(\newcommand{\nvec}{\mathbf n}\) \(\newcommand{\pvec}{\mathbf p}\) \(\newcommand{\qvec}{\mathbf q}\) \(\newcommand{\svec}{\mathbf s}\) \(\newcommand{\tvec}{\mathbf t}\) \(\newcommand{\uvec}{\mathbf u}\) \(\newcommand{\vvec}{\mathbf v}\) \(\newcommand{\wvec}{\mathbf w}\) \(\newcommand{\xvec}{\mathbf x}\) \(\newcommand{\yvec}{\mathbf y}\) \(\newcommand{\zvec}{\mathbf z}\) \(\newcommand{\rvec}{\mathbf r}\) \(\newcommand{\mvec}{\mathbf m}\) \(\newcommand{\zerovec}{\mathbf 0}\) \(\newcommand{\onevec}{\mathbf 1}\) \(\newcommand{\real}{\mathbb R}\) \(\newcommand{\twovec}[2]{\left[\begin{array}{r}#1 \\ #2 \end{array}\right]}\) \(\newcommand{\ctwovec}[2]{\left[\begin{array}{c}#1 \\ #2 \end{array}\right]}\) \(\newcommand{\threevec}[3]{\left[\begin{array}{r}#1 \\ #2 \\ #3 \end{array}\right]}\) \(\newcommand{\cthreevec}[3]{\left[\begin{array}{c}#1 \\ #2 \\ #3 \end{array}\right]}\) \(\newcommand{\fourvec}[4]{\left[\begin{array}{r}#1 \\ #2 \\ #3 \\ #4 \end{array}\right]}\) \(\newcommand{\cfourvec}[4]{\left[\begin{array}{c}#1 \\ #2 \\ #3 \\ #4 \end{array}\right]}\) \(\newcommand{\fivevec}[5]{\left[\begin{array}{r}#1 \\ #2 \\ #3 \\ #4 \\ #5 \\ \end{array}\right]}\) \(\newcommand{\cfivevec}[5]{\left[\begin{array}{c}#1 \\ #2 \\ #3 \\ #4 \\ #5 \\ \end{array}\right]}\) \(\newcommand{\mattwo}[4]{\left[\begin{array}{rr}#1 \amp #2 \\ #3 \amp #4 \\ \end{array}\right]}\) \(\newcommand{\laspan}[1]{\text{Span}\{#1\}}\) \(\newcommand{\bcal}{\cal B}\) \(\newcommand{\ccal}{\cal C}\) \(\newcommand{\scal}{\cal S}\) \(\newcommand{\wcal}{\cal W}\) \(\newcommand{\ecal}{\cal E}\) \(\newcommand{\coords}[2]{\left\{#1\right\}_{#2}}\) \(\newcommand{\gray}[1]{\color{gray}{#1}}\) \(\newcommand{\lgray}[1]{\color{lightgray}{#1}}\) \(\newcommand{\rank}{\operatorname{rank}}\) \(\newcommand{\row}{\text{Row}}\) \(\newcommand{\col}{\text{Col}}\) \(\renewcommand{\row}{\text{Row}}\) \(\newcommand{\nul}{\text{Nul}}\) \(\newcommand{\var}{\text{Var}}\) \(\newcommand{\corr}{\text{corr}}\) \(\newcommand{\len}[1]{\left|#1\right|}\) \(\newcommand{\bbar}{\overline{\bvec}}\) \(\newcommand{\bhat}{\widehat{\bvec}}\) \(\newcommand{\bperp}{\bvec^\perp}\) \(\newcommand{\xhat}{\widehat{\xvec}}\) \(\newcommand{\vhat}{\widehat{\vvec}}\) \(\newcommand{\uhat}{\widehat{\uvec}}\) \(\newcommand{\what}{\widehat{\wvec}}\) \(\newcommand{\Sighat}{\widehat{\Sigma}}\) \(\newcommand{\lt}{<}\) \(\newcommand{\gt}{>}\) \(\newcommand{\amp}{&}\) \(\definecolor{fillinmathshade}{gray}{0.9}\)15
V. Developing Additional Central Ideas about Thermal Phenomena
Emily van Zee and Elizabeth Gire
There are many ways to explore thermal phenomena. Thermometers are useful tools and come in many forms, based upon many different physical processes that depend upon how some change occurs with a change in temperature. This course uses digital temperature probes. Students can use regular bulb and tube thermometers that measure everyday temperatures (rather than only warm body temperatures), however, such as those that are typically available in schools.
A. Exploring thermal phenomena with technology
Students can see visually what is happening moment-by-moment on a graph of temperature versus time when using digital temperature probes connected to a computer. Students also can use regular bulb and tube thermometers in the explorations that begin with Question 2.7 below. Students using regular thermometers can become aware of what is happening moment-by-moment by viewing the figures below.
Equipment for each group:
• Provide two digital temperature probes that can be connected to a computer loaded with the relevant software, two regular bulb and tube thermometers and a stop watch, or a cell phone temperature app. Several technology companies such as pasco.com and vernier.com provide digital temperature probes. For example, we use Go!Temp probes (see https://www.vernier.com/products/sensors/temperature-sensors/go-temp/ ) that connect to a computer or other electronic device through free software, such as Logger Lite (http://www.vernier.com/products/software/logger-lite/#download).
•Provide a computer to use with the digital temperature probes. In our course, usually at least one student in a group can bring a laptop on days a computer is needed. We also have two netbooks that students can use or two groups can work together with one computer if necessary.
• To begin explorations, provide each group with a cup of cold water to cool the probe quickly. The students can use their hands to warm up the probe or a cup of hot water. Place the cup(s) of water on a tray well away from the computer.
• Also provide a towel in case of spills.
The first exploration is very open-ended, in order to help students become familiar with using the temperature probes.
Question 2.6 What can you find out about thermal phenomena with a temperature probe connected to a computer?
This initial open-ended exploration provides time to learn how to set up the computer, download the software, plug in the temperature probe, and play. You and your group members have access to yourselves as heat sources and whatever is around you as materials.
- What questions can you ask and answer by playing in various ways with a temperature probe connected to a computer? Use a physics notebook page to keep track of what you are asking, doing, and thinking.
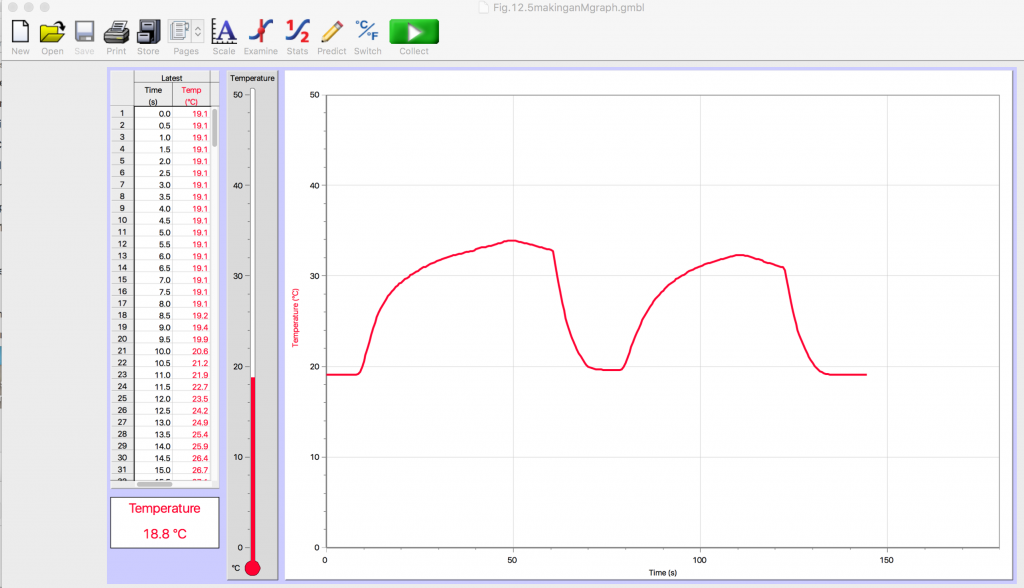
As shown in Fig. 2.4, the computer will be plotting a graph of temperature in degrees Celsius versus time in seconds. To start the computer program using Go Temp! probes, click on the little green box near the middle of the top of the screen.

- How can you make letters on the screen as in Fig. 2.5: A letter m? A broad curvy m? A narrow sharp peaked m? A letter w? Any other letters? Use your hand to warm the probe and a cup of tap water to cool the probe quickly.
After a while, add a second probe and a cup of hot water as well as cold.
- What questions can you ask and answer by varying the temperatures of the two temperature probes?
Artists may enjoy creating colorful designs with one probe drawing a red line and the other probe drawing a blue one to represent temperatures changing in different ways.

- Discuss with your group members how to interpret the graph that you are seeing.
How, for example, might students have made the graph shown in Fig. 2.6?
B. Exploring thermal phenomena with everyday materials
One activity most children enjoy at home, at school, and at the beach is playing with water. Explorations that involve mixing hot and cold water can be a logistic challenge but provide an engaging context for additional explorations of thermal phenomena.
For a series of explorations in mixing hot and cold water, use for each group of students:
- two temperature probes (or regular thermometers)
- clear plastic cup with lines indicating 1, 2, 3, or 4 parts for measuring (or a set of measuring cups),
- large Styrofoam cup or ceramic coffee mug for hot water,
- clear plastic cup for cold water,
- quart Styrofoam or plastic containers for storing hot and cold water,
- large container for storing water when finished with a trial
- tray large enough for holding the cups involved in mixing hot and cold water,
- towels in case things spill.
Place the tray and containers of water on a separate area or table from the computer to protect the computer in case of spills.
Question 2.7 What happens when you mix various amounts of hot and cold water?
- Explore thermal phenomena more systematically by mixing hot and cold water. In the Before section of a new physics notebook page sketch predictions for graphs that will appear on the computer screen when you mix hot and cold water in the following ways:
a: Equal amounts at same temperature
b: Equal amounts at unequal temperatures
c: Unequal amounts at same temperature
d: Unequal amounts at unequal temperatures: more hot than cold
e: more cold than hot
- Discuss and agree on the details of how you will be doing the mixing:
- What type of cup will you use for the hot water. Why?
-
- Will you pour the cold water into the hot water or pour the hot water into the cold? Why?
-
- How will you measure how much hot and cold water you are using?
- Place one temperature probe in the hot water; the other in the cold water.
Click on the green box at the top of the computer screen to start the program.
As you pour the cold water into the hot water, also transfer its temperature probe so that both temperature probes are now in the mixture of hot and cold water.
If you are using bulb and tube thermometers, place one in the hot water and one in the cold water. Record both temperatures. Also record the temperature of the mixture of hot and cold water.
- In the During section of your physics notebook page, record the graphs obtained by mixing the various amounts of hot and cold water specified above.
- Also record and define any new vocabulary relevant to this exploration.
- Discuss with your group members how to describe these graphs in words.
What central ideas about mixing hot and cold water can you generate from this exploration?
- In the After section of your physics notebook page, state central ideas that have emerged from this exploration and the evidence on which they are based.
- State a rationale that explains how the evidence supports these ideas and why these are important.
- Add a reflection about what you want to remember about this exploration, how you might use this in your own classroom, what you learned about science learning and teaching…
- What are you still wondering?
A useful way to organize outcomes is to record the set up, evidence, and relevant vocabulary for central ideas that emerge from explorations and discussions, as in the continuation of Table II.1.
| TABLE II.1 Explorations of thermal phenomena (continued) | |||
|---|---|---|---|
| Sketch of set up/graph | Evidence | Central Ideas | Vocabulary |
| When liquids are mixed, they reach an equilibrium temperature. | |||
Report findings for:
|
The equilibrium temperature depends on the initial temperatures and amounts of the liquids. | ||
- Complete the continuation of Table II.1 and write a summary of what you learned from this exploration.
After completing Table II.1 and your summary, look at an example of student work, nuances about exploring thermal phenomena by mixing hot and cold water, and some thoughts about the nature of science in this context.
1. Example of student work about mixing hot and cold water
A student summarized the exploration involving mixing hot and cold water as follows:
(The table) shows the experiments that we conducted in order to answer our questions and it also displays the ideas that were developed based upon these experiments.

For the sketch of the set up in the first row, this student drew two containers representing cups of water and labeled them “2 hot” and “2 hot .” The student wrote, “I mixed 2 parts hot water with 2 parts hot water and the temperature didn’t change.”
In the second row, the student drew two containers and labeled them “2 hot” and “1 hot.” The student wrote, “I mixed 2 parts hot water with 1 part hot water and the temperature didn’t change.”
In the third row, the student drew two containers and labeled them “2 hot” and “2 cold.” The student wrote, “I mixed 2 parts hot water with 2 parts cold water and the temperature was in the middle of their initial temperatures.”
In the fourth row, the student drew two containers and labeled them “2 cold” and “1 hot.” The student wrote, “I mixed 2 parts cold water with 1 part hot water and the temperature was closer to the initial temperature of the cold water.”
The student wrote the following rationales for the ideas claimed in the third column of the table:
When mixing two amounts of water at the same temperature, the equilibrium temperature of the mixture is the same as the initial temperature, whether the amounts are equal or unequal.(Figure 2.8) shows the graphs for mixing equal and unequal amounts of water at the same temperature. The first graph shows mixing equal amounts of water at the same temperature. I mixed 2 parts hot water with 2 parts hot water and the temperature of the water did not change from the initial temperature of the hot water. The second graph shows mixing unequal amounts of water at the same temperature. I mixed 2 parts hot water with 1part hot water and the temperature of the water did not change from the initial temperature of the hot water. The graphs in (Figure 2.8) are evidence for the idea that when mixing two amounts of water at the same temperature, the equilibrium temperature of the mixture is the same as the initial temperature, whether the amounts are equal or unequal.

When mixing equal amounts of hot and cold water, the equilibrium temperature of the mixture is the average of the initial temperatures.(Figure 2.9) shows the graph for mixing equal amounts of hot and cold water. I mixed 2 parts hot water with 2 parts cold water and the temperature of the water was right in the middle of their initial temperatures. The graph in (Figure 2.9) is evidence for the idea that when mixing equal amounts of hot and cold water, the equilibrium temperature of the mixture is the average of the initial temperatures.

When mixing unequal amounts of hot and cold water, the equilibrium temperature of the mixture is closer to the initial temperature of the larger amount of water. (Figure 2.10) shows the graph for mixing more hot water than cold water. I mixed 2 parts hot water with 1part cold water and the temperature of the water was closer to the initial temperature of the hot water. (Figure 2.11) shows the graph for mixing more cold water than hot water. I mixed 2 parts cold water with 1part hot water and the temperature of the water was closer to the initial temperature of the cold water. The graphs in (Figs. 2.10 and 2.11) are evidence for the idea that when mixing unequal amounts of hot and cold water, the equilibrium temperature of the mixture is closer to the initial temperature of larger amount of water.


Physics Student, Spring 2016
This was the first experience for these students in drawing and interpreting temperature graphs in this course. This student was careful to label the vertical axis with equal-distant marks representing a temperature scale and to color code the lines representing the changing temperatures for the two temperature probes. The student also indicated on the horizontal axis the time in seconds that the mixing took place.
2. Nuances about exploring thermal phenomena by mixing hot and cold water
Adults are unlikely to have difficulty understanding that mixing equal or unequal amounts of water at the same temperature will result in a mixture at that same temperature. These scenarios are included here because this does not necessarily seem obvious to children. They may be so accustomed to adding numbers that they may predict that they need to add the two temperatures if they are adding the two amounts of water together. The flat line on the resulting graph also is helpful even for adult students in that it makes clear that such a flat line represents something that is not changing, in this case the temperature of the water.
Mixing equal amounts of hot and cold water can be problematic. One needs to take care in measuring the equal amounts. With small amounts, such as a half of cup each, small errors in measuring can bias the result. The expectation is that the final temperature, called the equilibrium temperature, will be half way between the two initial temperatures when mixing equal amounts at unequal temperatures.
In Fig. 2.12, does it look like the hot water changed temperature a little more than the cold? Why might that have happened?

It may be that there were not exactly equal amounts of hot and cold water. Another possibility is that the amounts were equal but the hot water was poured into the cold water so some of the energy in the hot water flowed into the air and container as well as into the cold water. This would reduce the energy transferred to the cold water and look like a slightly smaller amount of hot water was used.
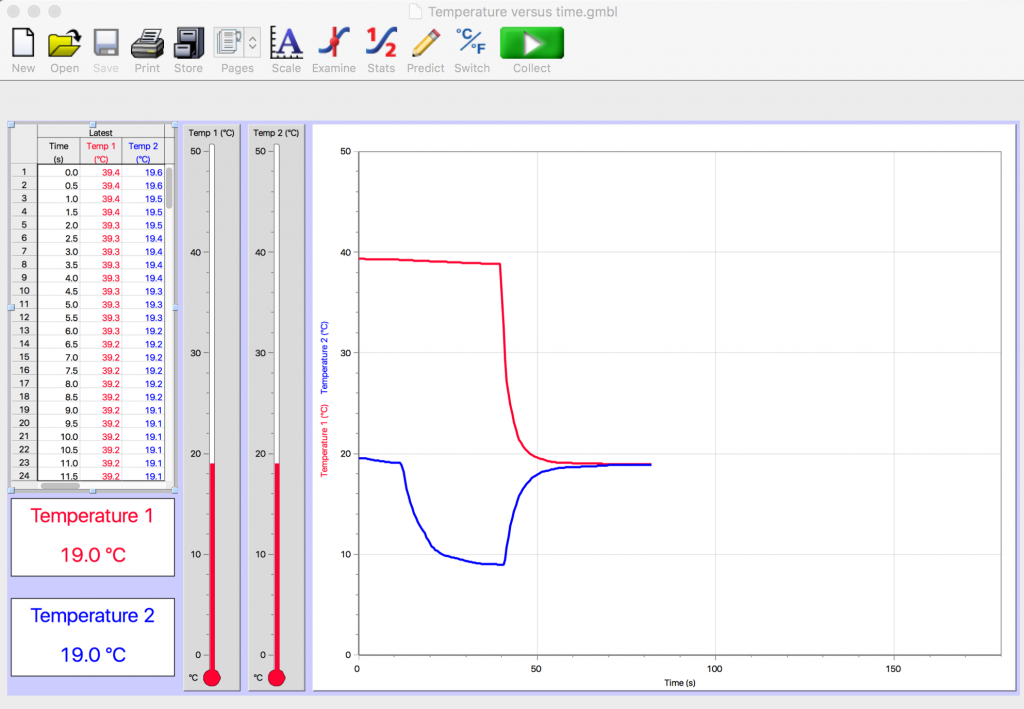
Figure 2.13 and Fig. 2.14 show the result of mixing different amounts of hot and cold water at different temperatures.
- In each of these experiments, which had the bigger temperature change? Which the smaller temperature change?
- In each of these experiments, which do you think was the bigger amount of water? The hot or the cold water?

In Fig. 2.13, it looks like the change in temperature of the hot water was smaller than the change in temperature of the cold water. Consider a bathtub with very hot water, much too hot for a bath. What to do? Add some cold water to cool things down, but not too much! If you mix a little cold water with a lot of hot water, which will change temperature the most?
The temperature of this small amount of cold water will change a lot as it mixes in with a large mass of hot water. The change in temperature is smaller for the larger mass of hot water. The change in temperature is larger for the smaller mass of cold water. Therefore, there must have been more hot water than cold in this scenario.
Figure 2.14 also shows the result of mixing different amounts of hot and cold water. Which had the bigger temperature change here? Which had the smaller temperature change? Which do you think was the bigger amount of water? The hot or the cold water?
In Fig. 2.14 the hot water had the bigger temperature change and the cold water had the smaller change in temperature. In this scenario, there must have been more cold than hot because the equilibrium temperature was nearer to the initial cold temperature.
A goal of this course is to build skills in interpreting line graphs in this way, to be able to “tell the story” of what happened by looking at the shapes of the lines and interpreting what must have happened in order for the lines to have formed in that way.
In Figs. 2.12 – 2.14, for example, the horizontal axis is representing the increase in time from left to right. The vertical axis is representing the temperature of the temperature probes.
- What does the red line at the beginning of the experiment indicate was happening to the temperature probe for the hot water?
- What does the blue line at the beginning of the experiment indicate was happening to the temperature probe for the cold water?
- What does the overlapping of the red and blue lines near the end of the mixing process indicate about what happened when these cups of hot and cold water were mixed together?
The almost flat red line at the beginning of the experiment suggests that the temperature of the hot water was not changing much as the temperature probe was sitting in the cup of hot water. There is a slight slant downward of the red line indicating that the hot water was cooling slightly in its cup. Then there is a very sharp change in the hot temperature recorded by this probe; the red line plunges almost instantly to a much lower temperature, suggesting that the sharp bend occurred the moment that the cold water was poured into the cup of hot water.
The straight blue line near the beginning of the experiment suggests that the temperature probe for the cold water was initially not in the cup of cold water but was outside of the cup, perhaps at room temperature when the computer program was started. The curved blue line represents the drop in temperature when the probe was then placed in the cup of cold water.
In Fig. 2.12 and Fig. 2.13, the temperature probe for the cold water was in the cold water long enough that the blue line has almost flattened out, indicating that the probe was near to reading the temperature of the cold water before mixing began. In Fig. 2.14, the blue line becomes almost flat. It is important to stir both cups of water and to wait until both lines are flat before pouring the cold water into the hot water. Record both temperatures just before mixing, in order to be sure that the initial readings of the temperatures of the hot and cold water are accurate.
The overlapping lines for both temperature probes at the end of the mixing process indicate that the two temperature probes were reading the same temperature, the equilibrium temperature reached after the mixing was complete. This assumes that the probes had been calibrated, that they had indicated the same temperature when placed in the same cup of water at the beginning of the experiment. If the two probes did not indicate the same temperature when placed in the same cup of water at the beginning of the experiment, the computer program needed to be instructed to change the calibration so that the readings of the two probes would agree when reading the same temperature.
Note how quickly the temperatures change as the mixing begins. Also note the shape of the curves as the temperatures change more gradually as the mixture comes to equilibrium. When drawing graphs, also take care to match the time when the lines start changing drastically, as temperature readings by both the hot and cold probes will start changing at the same instant, at the moment that the cold water is poured into the hot.
Figuring out how best to measure and mix the hot and cold water in order to maximize the accuracy of results is an example of an engineering design problem. The possible effects of pouring hot water into cold versus pouring cold water into hot, of stirring or not stirring before and after mixing, of calibrating the thermometers, and of timing the recording of initial conditions are all issues that need to be identified with solutions developed and optimized. (See Appendix I, Engineering Design in the Next Generation Science Standards, https://www.nextgenscience.org/resources/ngss-appendices .)
3. Some thoughts about the nature of science in this context
An important aspect of doing science is being able to represent and interpret changes that are occurring. Visual displays such as graphs can make aspects visible that might otherwise go unnoticed. Figures 2.13 and 2.14, for example, show dramatic differences in the stability of the initial temperatures of the hot and cold temperature probes. The initial almost flat line for the hot probe indicates a stable initial condition but the initial curved line for the cold probe indicates a dramatically changing initial condition. Such differences could affect the results. It is important in doing careful experiments that both the hot and cold temperature probes show a flat line, indicating a stable initial temperature, before mixing occurs.
These graphs show how the hot and cold water temperatures changed with time; such line graphs show how one quantity, represented by the vertical axis, changes with another quantity, represented by the horizontal axis. Learning to “tell the story” of such line graphs is an important skill in many fields. Being able to interpret such visual displays of data can enhance one’s ability to influence and/or evaluate claims being made, whether in science, business, or personal contexts.
The use of digital temperature probes in this unit illustrate the affordances provided by technologies in collecting and interpreting data. As indicated in the US Next Generation Science Standards, scientific knowledge is based on empirical evidence. Third to fifth grade students, for example, should understand that scientists use tools and technologies to make accurate measurements and observations (NGSS, Lead States, 2013, Appendix H). (See: https://www.nextgenscience.org/resources/ngss-appendices.)