
2.6: VI. Developing an Additional Central Idea about Thermal Phenomena and Its Mathematical Representations
- Page ID
- 15118
\( \newcommand{\vecs}[1]{\overset { \scriptstyle \rightharpoonup} {\mathbf{#1}} } \)
\( \newcommand{\vecd}[1]{\overset{-\!-\!\rightharpoonup}{\vphantom{a}\smash {#1}}} \)
\( \newcommand{\id}{\mathrm{id}}\) \( \newcommand{\Span}{\mathrm{span}}\)
( \newcommand{\kernel}{\mathrm{null}\,}\) \( \newcommand{\range}{\mathrm{range}\,}\)
\( \newcommand{\RealPart}{\mathrm{Re}}\) \( \newcommand{\ImaginaryPart}{\mathrm{Im}}\)
\( \newcommand{\Argument}{\mathrm{Arg}}\) \( \newcommand{\norm}[1]{\| #1 \|}\)
\( \newcommand{\inner}[2]{\langle #1, #2 \rangle}\)
\( \newcommand{\Span}{\mathrm{span}}\)
\( \newcommand{\id}{\mathrm{id}}\)
\( \newcommand{\Span}{\mathrm{span}}\)
\( \newcommand{\kernel}{\mathrm{null}\,}\)
\( \newcommand{\range}{\mathrm{range}\,}\)
\( \newcommand{\RealPart}{\mathrm{Re}}\)
\( \newcommand{\ImaginaryPart}{\mathrm{Im}}\)
\( \newcommand{\Argument}{\mathrm{Arg}}\)
\( \newcommand{\norm}[1]{\| #1 \|}\)
\( \newcommand{\inner}[2]{\langle #1, #2 \rangle}\)
\( \newcommand{\Span}{\mathrm{span}}\) \( \newcommand{\AA}{\unicode[.8,0]{x212B}}\)
\( \newcommand{\vectorA}[1]{\vec{#1}} % arrow\)
\( \newcommand{\vectorAt}[1]{\vec{\text{#1}}} % arrow\)
\( \newcommand{\vectorB}[1]{\overset { \scriptstyle \rightharpoonup} {\mathbf{#1}} } \)
\( \newcommand{\vectorC}[1]{\textbf{#1}} \)
\( \newcommand{\vectorD}[1]{\overrightarrow{#1}} \)
\( \newcommand{\vectorDt}[1]{\overrightarrow{\text{#1}}} \)
\( \newcommand{\vectE}[1]{\overset{-\!-\!\rightharpoonup}{\vphantom{a}\smash{\mathbf {#1}}}} \)
\( \newcommand{\vecs}[1]{\overset { \scriptstyle \rightharpoonup} {\mathbf{#1}} } \)
\( \newcommand{\vecd}[1]{\overset{-\!-\!\rightharpoonup}{\vphantom{a}\smash {#1}}} \)
\(\newcommand{\avec}{\mathbf a}\) \(\newcommand{\bvec}{\mathbf b}\) \(\newcommand{\cvec}{\mathbf c}\) \(\newcommand{\dvec}{\mathbf d}\) \(\newcommand{\dtil}{\widetilde{\mathbf d}}\) \(\newcommand{\evec}{\mathbf e}\) \(\newcommand{\fvec}{\mathbf f}\) \(\newcommand{\nvec}{\mathbf n}\) \(\newcommand{\pvec}{\mathbf p}\) \(\newcommand{\qvec}{\mathbf q}\) \(\newcommand{\svec}{\mathbf s}\) \(\newcommand{\tvec}{\mathbf t}\) \(\newcommand{\uvec}{\mathbf u}\) \(\newcommand{\vvec}{\mathbf v}\) \(\newcommand{\wvec}{\mathbf w}\) \(\newcommand{\xvec}{\mathbf x}\) \(\newcommand{\yvec}{\mathbf y}\) \(\newcommand{\zvec}{\mathbf z}\) \(\newcommand{\rvec}{\mathbf r}\) \(\newcommand{\mvec}{\mathbf m}\) \(\newcommand{\zerovec}{\mathbf 0}\) \(\newcommand{\onevec}{\mathbf 1}\) \(\newcommand{\real}{\mathbb R}\) \(\newcommand{\twovec}[2]{\left[\begin{array}{r}#1 \\ #2 \end{array}\right]}\) \(\newcommand{\ctwovec}[2]{\left[\begin{array}{c}#1 \\ #2 \end{array}\right]}\) \(\newcommand{\threevec}[3]{\left[\begin{array}{r}#1 \\ #2 \\ #3 \end{array}\right]}\) \(\newcommand{\cthreevec}[3]{\left[\begin{array}{c}#1 \\ #2 \\ #3 \end{array}\right]}\) \(\newcommand{\fourvec}[4]{\left[\begin{array}{r}#1 \\ #2 \\ #3 \\ #4 \end{array}\right]}\) \(\newcommand{\cfourvec}[4]{\left[\begin{array}{c}#1 \\ #2 \\ #3 \\ #4 \end{array}\right]}\) \(\newcommand{\fivevec}[5]{\left[\begin{array}{r}#1 \\ #2 \\ #3 \\ #4 \\ #5 \\ \end{array}\right]}\) \(\newcommand{\cfivevec}[5]{\left[\begin{array}{c}#1 \\ #2 \\ #3 \\ #4 \\ #5 \\ \end{array}\right]}\) \(\newcommand{\mattwo}[4]{\left[\begin{array}{rr}#1 \amp #2 \\ #3 \amp #4 \\ \end{array}\right]}\) \(\newcommand{\laspan}[1]{\text{Span}\{#1\}}\) \(\newcommand{\bcal}{\cal B}\) \(\newcommand{\ccal}{\cal C}\) \(\newcommand{\scal}{\cal S}\) \(\newcommand{\wcal}{\cal W}\) \(\newcommand{\ecal}{\cal E}\) \(\newcommand{\coords}[2]{\left\{#1\right\}_{#2}}\) \(\newcommand{\gray}[1]{\color{gray}{#1}}\) \(\newcommand{\lgray}[1]{\color{lightgray}{#1}}\) \(\newcommand{\rank}{\operatorname{rank}}\) \(\newcommand{\row}{\text{Row}}\) \(\newcommand{\col}{\text{Col}}\) \(\renewcommand{\row}{\text{Row}}\) \(\newcommand{\nul}{\text{Nul}}\) \(\newcommand{\var}{\text{Var}}\) \(\newcommand{\corr}{\text{corr}}\) \(\newcommand{\len}[1]{\left|#1\right|}\) \(\newcommand{\bbar}{\overline{\bvec}}\) \(\newcommand{\bhat}{\widehat{\bvec}}\) \(\newcommand{\bperp}{\bvec^\perp}\) \(\newcommand{\xhat}{\widehat{\xvec}}\) \(\newcommand{\vhat}{\widehat{\vvec}}\) \(\newcommand{\uhat}{\widehat{\uvec}}\) \(\newcommand{\what}{\widehat{\wvec}}\) \(\newcommand{\Sighat}{\widehat{\Sigma}}\) \(\newcommand{\lt}{<}\) \(\newcommand{\gt}{>}\) \(\newcommand{\amp}{&}\) \(\definecolor{fillinmathshade}{gray}{0.9}\)16
VI. Developing an Additional Central Idea about Thermal Phenomena and Its Mathematical Representations
Emily van Zee and Elizabeth Gire
Being able to tell a story about what is happening by looking at a graph is a useful skill whenever one is monitoring a numerical quantity. Graphs can show at a glance how something is changing, whether that involves finances, populations, sales, or some other quantity of interest. Being able to relate quantities algebraically also is helpful if one wants to make numerical predictions based on evidence rather than intuition. This section builds on skills in interpreting qualitative line graphs, such as those shown in Figs. 2.12-2.14. You also will develop quantitative skills for generating and justifying relevant equations, solving for an unknown, and calculating a quantity of interest.
A. Interpreting features of line graphs
“Telling the story” represented by a line graph involves looking at the shape of the graph and interpreting its features.
Question 2.8 How can you tell what is happening by interpreting the shape of a line graph?
Look at the shapes of the lines in the graphs shown in Figs. 2.15 and 2.16. What was happening if these graphs are representing the mixing of hot and cold water? Which of these graphs is intended to represent mixing more hot water than cold? Which is intended to represent mixing more cold water than hot?
For these graphs, an important feature is the length of the line representing the changing temperature of the hot water as compared to the length of the line representing the changing temperature of the cold water.
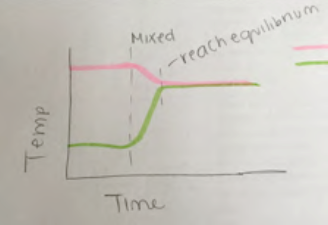
Note that in Fig. 2.15, the student drew a long vertical dashed line to represent the time when the mixing of hot and cold water started, shown by the pink line bending down and the green line bending up. The initial bends are not as steep as shown in Fig. 2.13 but the lines start bending roughly at the same time, represented by the vertical line. The long vertical dashed line matches where both of the lines representing the hot- and cold-water temperatures started changing direction, representing that the temperatures of both the hot and cold water started changing at the same moment. The short vertical dashed line indicates roughly the time when the temperatures of the hot and cold water stopped changing as well, shown by the pink and green lines leveling off at about the same height above the horizontal axis, with that height representing the equilibrium temperature. The student wrote “reach equilibrium” to label what was happening there. The equilibrium is closer to the initial hot temperature, indicating that this was a case of more hot water mixing with cold.
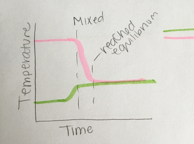
In Fig. 2.16, however, the student did not match the lines representing times when the hot and cold water started changing direction. This graph suggests a story in which the cold water started warming up first and almost reached the equilibrium temperature before the hot water started cooling off. This is different from the story told by the lines in Fig. 2.14. It is important when drawing line graphs to check the story that your lines are telling. Are the details of your lines accurately telling the story of what is happening? The equilibrium temperature is closer to the initial cold temperature, indicating that this was a case of more cold water mixing with hot.
B. Identifying patterns in data
General thinking about a situation can help you decide how to set up a series of experiments to collect enough data to be able to perceive a pattern in the data. Once you have identified a pattern, try to represent that pattern mathematically. If the pattern can be expressed by an algebraic equation, you can use that the relationship to make predictions or to estimate a quantity of interest. That process is the focus of this section.
1. Designing a series of experiments to identify patterns in data
Question 2.9 When mixing hot and cold water, how are the amounts of hot and cold water related to how much their temperatures change?
- To explore what happens quantitatively when you mix various amounts of hot and cold water, first decide what data to record and how you want to keep track of these data.
- If you want to double, triple, and quadruple an amount of water for a series of experiments, how might you do that?
One way would be to use mass. If you have a balance, you could measure 100 grams, 200 grams, 300 grams, or 400 grams of water.
Another way would be to use volume. If you have a 500-milliliter measuring cup, you could measure 100ml, 200ml, 300ml, or 400 ml of water
Equivalently, use any container that you can mark with 1, 2, 3, 4 levels to measure multiples of the initial amount.
-
- How will you measure the initial and final temperatures?
Two regular bulb and tube thermometers will work fine. Using two digital temperature probes connected to a computer, however, will allow you to build skill in interpreting the graphs that appear as you mix the various amounts.
-
- What combinations of hot and cold water will you try and how will you record your findings?
- Another issue is how best to carry out your experiments: What might affect how much the temperatures of the hot and cold water change?
- How can you be sure that you are measuring the amounts of water consistently with your measuring devise?
-
- How can you guard against some of the energy from the hot water flowing out into the cup and air instead of into the cold water?
-
- How can you be sure that the temperatures you record for the hot and cold water are their actual temperatures at the moment just before you mix them?
-
- How can you be sure the hot and cold water are well mixed before you record the equilibrium temperature?
- In the Before section of your physics notebook page, describe your experimental design – how you plan to conduct these experiments. This also is a place to record your initial thoughts about what to do with your data once obtained and to make predictions for the results.
- What data do you plan to record and how do you plan to keep track of these data?
-
- How might you use these data to predict the changes in temperature for each experiment?
-
- How might you use the amounts of hot and cold water and their initial temperatures to predict whether the equilibrium temperature is likely to be closer to the initial hot temperature, closer to the initial cold temperature, or half way in-between their temperatures?
-
- How do you think the equilibrium temperature relates to the initial temperatures of the hot and cold water?
-
- How might you use the amounts of hot and cold water to be mixed, their initial temperatures, and the likely equilibrium temperature in order to predict likely changes in temperatures of the hot and of the cold water?
- Explain your reasoning for the process you will use to make these predictions.
This process of designing your exploration by deciding on what to do, what data to record, how to use these data, and predicting what you expect to occur is an important aspect of learning to do science. This open-ended process contrasts with one in which a laboratory manual or teacher already has made most of those decisions for you. The intent here is to model the experimental process as well as the conceptual process of developing central ideas and the mathematical process of representing what is happening through graphs and algebraic equations.
- In the During section of your notebook page, create a table to record the findings for each experiment in a clear way.
- Also note any new words or familiar vocabulary that you have noticed as having special meanings in this context.
- Discuss your findings and formulate a relevant central idea.
- Sometimes one feels overwhelmed in the midst of an exploration, particularly if one is trying to figure out relationships among variables rather than simply following a lab manual’s verification recipe. If that happens, it can be helpful to ask:
- What are we doing?
- Why are we doing this?
- How is that helping us?
- In the After section of the physics notebook page, report this central idea and the evidence on which it is based.
- Write a rationale that explains how the evidence supports the central idea and why this is important.
- Also reflect upon this exploration such as what connections can you make to other experiences? How might you use what you learned in your own classroom?
- What are you still wondering?
After class, write a summary based on your physics notebook pages and handouts before reviewing the following discussion of comparing ratios of hot and cold water and their changes in temperature. To maximize learning, it is important to work through issues in conversation with your group members and with guidance as needed from your instructor in class before reading this text. The purpose of the sections below is to help clarify any details that may be puzzling.
2. Recording and analyzing data
There are many ways to record and analyze data. As an example, consider Fig. 2.14, repeated from above, for an experiment in which two parts of cold water were mixed with one part of hot water.
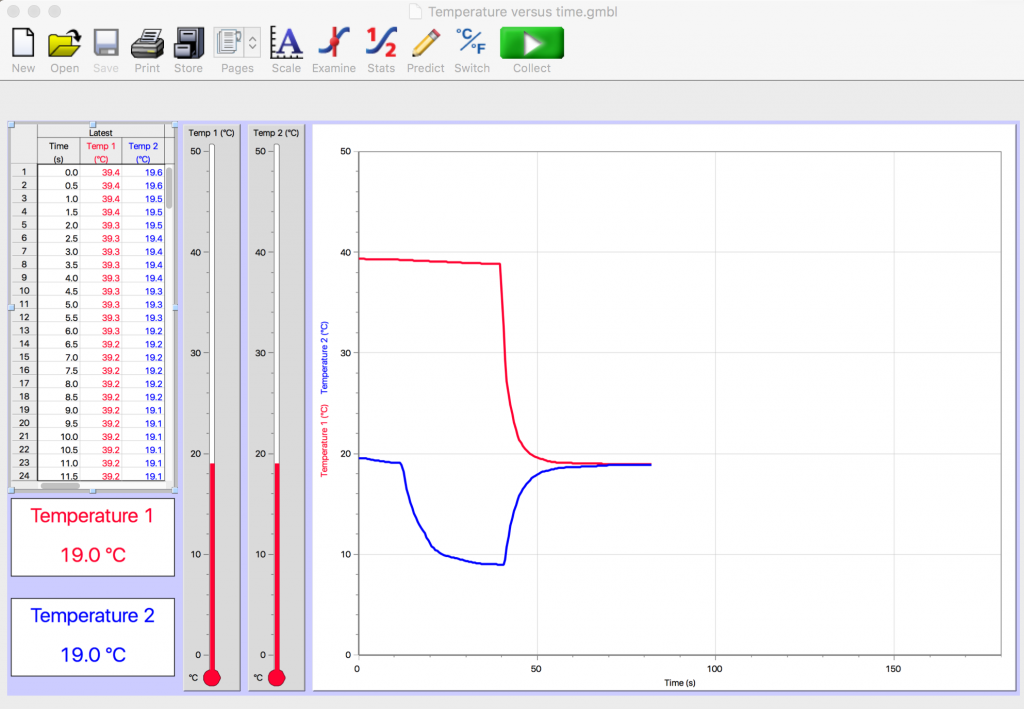
The vertical axis represents temperature in degrees Celsius; the horizontal axis represents time in seconds. The computer display indicates that the mixture of the hot and cold water reached an equilibrium temperature of 19.0 ºC. The precision of the digital thermometers is nice but not necessary. If we had been using regular thermometers rather than digital thermometers, probably both regular thermometers would have indicated an equilibrium temperature of about 19ºC. That level of precision would be enough for the purposes of this experiment. The graph on the computer is useful, however, in providing an informative visual display of what is happening.
Looking at the initial red line, which is just below the 40ºC grid line, what is an estimate of the initial temperature of the hot water?
Looking at the lowest point of the initial blue line, which is just below the 10ºC grid line, what is an estimate of the initial temperature of the cold water?
The ratio of parts of cold water to hot water is 2/1. The final temperature of the hot water was about 19ºC; the initial temperature of the hot water was about 39ºC. The final temperature of the cold water was about 19ºC; the initial temperature of the cold water was about 9ºC. Although the digital temperature probes provide more precise readings, we are choosing to record readings at ± 1ºC here to ease visual inspection of the calculations in Table II.2.
A table would be helpful in recording and analyzing such data.
| TABLE II.2 Reporting data and analyzing experiments mixing hot and cold water | |||||||||
|---|---|---|---|---|---|---|---|---|---|
| Exp. | Part hot | Part cold | Ratio parts hot to cold | Final T hot in °C: Thf | Initial T hot in °C: Thi | Change in T hot water: ∆Th | Final T cold in °C: Tcf | Initial T cold in °C: Tci | Change in T cold water: ∆Tc |
| Fig. 2.14 | 1 | 2 | 1/2 | 19°C | 39°C | 19°C | 9°C | ||
A similar table can be made for other combinations, such as mixing 1 part hot water with 4 parts cold, 2 parts hot water with 1 part cold, or 4 parts hot water with 1 part cold. Assembling such data for multiple experiments makes possible looking for patterns in the data across multiple contexts.
For the experiment represented in Fig. 2.14, what are the changes in temperature for the hot and cold water? When describing changes in temperature in everyday life, we usually indicate whether the temperature increases or decreases: “it will be 5 degrees warmer today than yesterday,” “the cake cooled to room temperature,” or “her temperature is back down to normal.” Mathematically, we describe whether a temperature change is hotter or colder with a positive or negative sign. Therefore, we mathematically define a change in temperature as the final temperature Tf minus the initial temperature Ti and use ∆T, delta T, to represent a change in temperature:
change in temperature = ∆T = Tf – Ti
When the temperature increases, the change in temperature is positive. When the temperature decreases, the change in temperature is negative. When mixing hot and cold water, the final temperature for both the hot and the cold water is the equilibrium temperature Te so for both changes in temperature, subtract the initial temperature from the equilibrium temperature:
change in temperature = ∆T = Te – Ti
Figure 2.17 provides a visual way to think about the relationships among the initial, final, and equilibrium temperatures when mixing hot and cold water.
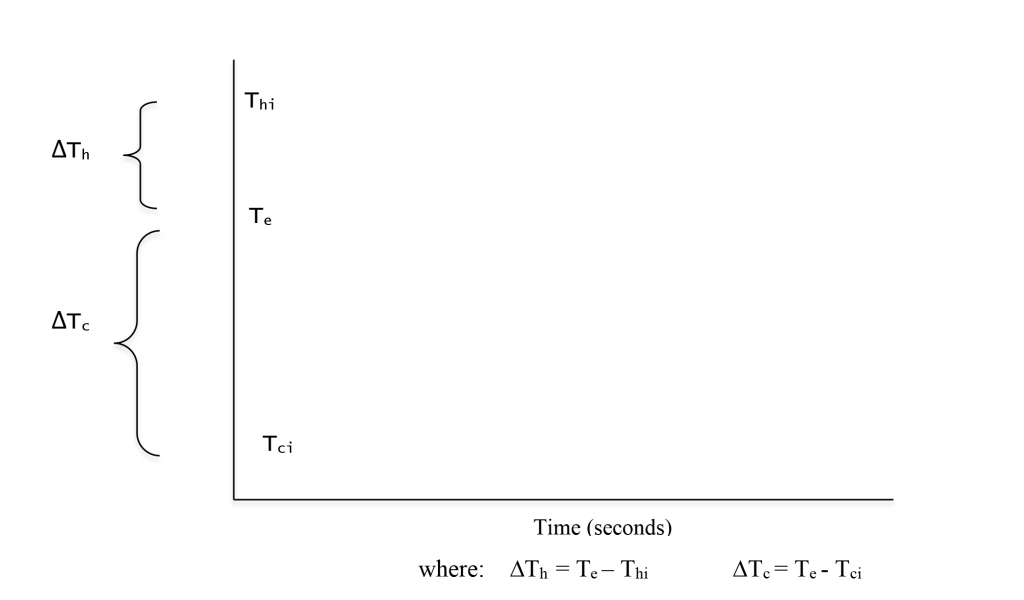
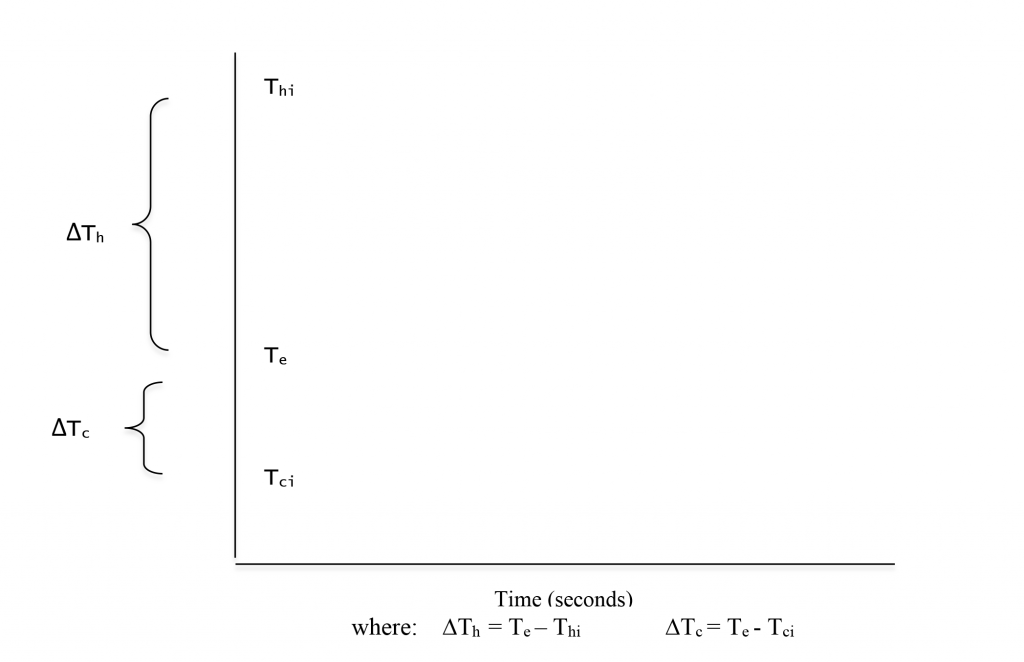
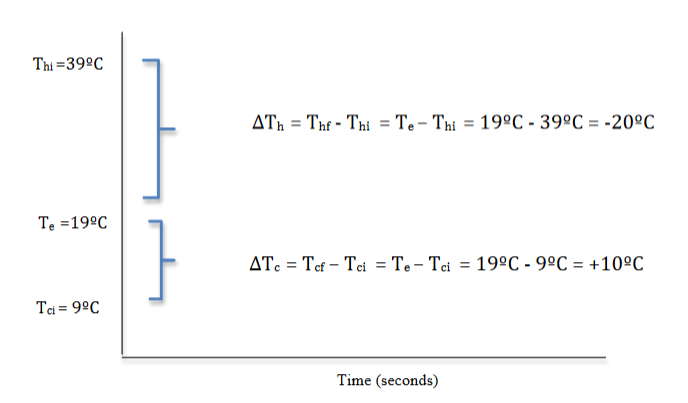
For the hot water:
∆Th = Thf – Thi = Te – Thi = 19°C – 39°C = – 20°C
The minus sign indicates that ∆Th, the change in the hot water temperature, was a decrease in temperature. All ∆Th in these mixing hot and cold water experiments will have a negative value as the hot water will always be at a higher initial temperature than the equilibrium temperature. Subtracting the higher initial temperature from this lower equilibrium temperature will always yield a negative value.
For the cold water:
∆Tc = Tcf – Tci = Te – Tci = 19°C – 9°C = + 10°C
The plus sign indicates that ∆Tc, the change in the cold water temperature, was an increase in temperature. All ∆Tc in these mixing hot and cold water experiments will have a positive value as the cold water will always be at a lower initial temperature than the equilibrium temperature. Subtracting the lower initial temperature from this higher equilibrium temperature will always yield a positive value
It can be helpful, when working with problems involving mixing hot and cold water, to sketch a graph that illustrates what is happening as in Fig. 2.18.
Entering these findings in the table and highlighting these changes in temperature and the parts of hot and cold water creates a visual display that can help identify patterns in these data. The magnitude of the change in temperature of the hot water would be twice as much as magnitude of the change in temperature of the cold water.
Calculating the change in temperatures of the hot water and the cold water completes Table II.2:
| Table II.2 (continued) Reporting data and analyzing experiments mixing hot and cold water | |||||||||
|---|---|---|---|---|---|---|---|---|---|
| Exp. | Part hot | Part cold | Ratio parts hot to cold | Final T hot in °C: Te | Initial T hot in °C: Thi | Change in T hot ∆Th = Te – Thi |
Final T cold in °C: Te | Initial T cold in °C: Tci | Change in T cold ∆Tc = Te – Tci |
| Fig. 2.14 | 1 | 2 | 1/2 | 19°C | 39 °C | – 20 °C | 19 °C | 9 °C | +10 °C |
3. Interpreting findings
How are the highlighted quantities in Table II.2 related mathematically?
Given that we have been comparing what happens when mixing various ratios of the amounts of hot and cold water, it seems reasonable to compare the changes in temperatures as ratios as well:
\[\frac{\text{Part hot}}{\text{Part cold}}\]
For the experiment represented in Fig. 2.14, what does the ratio equal ?
\[\frac{\text{Part hot}}{\text{Part cold}}\]
or
\[\frac{\text{Part hot}}{\text{Part cold}}\]
The results of this experiment indicate that the ratio of the amount of hot water to the amount of cold water (1 to 2) seems to be related to the inverse ratio of the change in cold temperature to the change in hot temperature.
There is a problem, however, in that the ratio of the temperatures is negative but the magnitudes match; they are both of magnitude 1/2. The magnitude of a quantity is its numerical value without reference to whether the value is positive or negative.
Sometimes students also are puzzled by what their results seem to be saying. Most ratios that students have worked with in other contexts seem to have been direct proportions, as in the pinhole camera, where the entities are in the same order: H/D = h/d or expressed another way: h/H = d/D, the ratio of corresponding heights in similar triangles is equal to the ratio of corresponding distances.
This new relationship between ratios is representing an inverse proportion:
\[\frac{\text{Property 1 of Top Entity}}{\text{Property 1 of Bottom Entity}}\]
If a result seems wrong, consider whether something has gone wrong or whether this experimental result is what is really happening. Based on the data presented above, the ratio of a small amount of hot water to a large amount of cold water is related to the magnitude of the ratio of a small change in temperature of the large amount of cold water to the magnitude of a large change in temperature of the small amount of hot water. This is a description of what the graph showed in Fig. 2.14. In this case, the temperature of a large amount of cold water changed a little; the temperature of a small amount of hot water changed a lot.
In addition to considering whether a puzzling result seems logical and in agreement with other ways to represent the data obtained in an experiment, it is helpful to test whether the same result occurs in other contexts. This result was based on an experiment mixing one part hot water and two parts cold water. Would the same pattern occur with other combinations such as two parts hot water and one part cold? What about 4 parts hot water and 1 part cold? Or 1 part hot and 4 parts cold water. Such multiple trials make possible looking for patterns in data and testing whether the relationships one infers are valid. Looking for patterns in data is an example of a crosscutting concept that occurs across many different science domains as discussed in Appendix G of the Next Generation Science Standards (NGSS Lead States, 2013) https://www.nextgenscience.org/resources/ngss-appendices .
-
Developing an algebraic representation of the findings
There are several steps needed to express this relationship appropriately in symbols. We have chosen to express the amounts of water in terms of their masses. For the experiment shown in Fig. 2.14, the ratio of the mass of hot water to the mass of cold water was 1 to 2:
\[\frac{\text{ mass of hot water }}{\text{mass of cold water}} = \frac{m_h}{m_c} = \frac{1}{2}\]
which is a positive number.
The ratio of the changes in temperatures can be written as:
\[\frac{\text{Change in temperature of the cold water}}{\text{Change in temperature of temperature of the hotwater}} = \frac{\Delta T_c}{\Delta T_h} = \frac{+10^{o}C}{-20^{o}C} = \frac{-1}{2}\]
which is a negative number.
Because ∆Th is always negative and ∆Tc is always positive, the ratio of changes in temperature will always be a negative number. In order to set it equal to a positive number, a minus sign needs to be added to the expression. Therefore, the results of this experiment can be expressed algebraically as:
\[\frac{m_h}{m_c} = \frac{-\Delta T_c}{\Delta T_h}\]
The results also can be expressed as
\[\frac{m_c}{m_h} = \frac{-\Delta T_h}{\Delta T_c}\]
The magnitudes of the ratios in the experiment represented by the graph in Fig. 2.14 turned out to be exactly equal at the level of precision we used. That is unusual in these experiments. Typically these experimental results are only approximately equal. Therefore we choose to represent these experimental results with the symbol ≈ that represents “approximately equal”:
\[\frac{m_h}{m_c} \approx\frac{-\Delta T_c}{\Delta T_h}\]
and
\[\frac{m_c}{m_h} \approx \frac{-\Delta T_h}{\Delta T_c}\]
The ratio of the mass of the hot water to the mass of the cold water is approximately equal to minus the ratio of the change in temperature of the cold water to the change in temperature of the hot water where change in temperature equals the final temperature minus the initial temperature (∆T = Tf -Ti).
One also can refer to the magnitude of the changes in temperature, the numerical values of the changes, without reference to whether they are an increase or decrease in temperature. The magnitude of a quantity is represented by vertical bars on both sides of its symbol: |∆Th| represents the magnitude of the change in temperature of the hot water, 20ºC in this case. The ratio of the mass of hot water to the mass of cold water is approximately equal to the ratio of the magnitude of the change in temperature of the cold water to the magnitude of the change in temperature of the hot water. If stated in terms of magnitudes, the minus sign is not needed but vertical bars should be placed of both sides of the expressions with ∆T symbols:
\[\frac{m_h}{m_c} \approx\frac{|\Delta T_c|}{|\Delta T_h|}\]
and
\[\frac{m_c}{m_h} \approx \frac{|\Delta T_h|}{|\Delta T_c|}\]
If you choose to use “magnitudes” be sure to indicate that with both the verbal and symbolic statements of this relationship.
-
Recognizing the importance of systems thinking
Comparing the results for several experiments mixing various amounts of hot and cold water can increase confidence in the interpretation developed above, that the amounts of hot and cold water are inversely proportional to the magnitudes of their changes in temperature. Any differences in findings from multiple experiments would need consideration: what are the components of the system, how might they be interacting, how might the processes involved be affecting what is happening?
Question 2.10 What is the role of systems thinking in interpreting experimental results?
A student reported four experiments in which one set of ratios were equal but three of the four had slightly lower changes in temperature by the cold water than expected. The student reflected upon the role of systems thinking in explaining these findings.
-
Example of student work reflecting upon the role of systems thinking
In class, we mixed varying unequal amounts of hot and cold water. Our goal was to find a pattern in order to develop a mathematical representation of thermal phenomena…First, I mixed 2 parts hot water with 1 part cold water…Next, I mixed 1 part hot water with 2 parts cold water…Next, I mixed 4 parts hot water with 1 part cold water…Finally, I mixed 1 part hot water with 4 parts cold water…The experimental evidence that I found is evident in all four of the different unequal amounts of hot water and cold water that I experimented with. These four different trials all produced approximately equal ratios, which is experimental evidence that when mixing unequal amounts of hot and cold water, the ratio of the amount of hot water to the amount of cold water is approximately equal to the ratio of the (magnitude of the) change in temperature of the cold water to the (magnitude of the) change in temperature of the hot water..
Various aspects of the situation may affect how close the mathematical model matches what actually happened. The cups of hot and cold water form a system with energy flowing from the hot water to the cold water. If it is a closed system, all of the energy lost by the hot water will be gained by the cold water. If it is an open system, some of the energy may flow out and into the environment, such as into the air or the material of the containers. Also, if there is an energy source nearby, some energy may flow into this system. Because we are trying to understand what is happening within our system of the cups of hot and cold water, it is important for us to keep the system as closed as possible.
Because we were trying to find a pattern revolving around how the masses of the hot and cold water related to their changes in temperature when they were mixed, the most accurate results were found when as little energy as possible flowed out of the hot water and into the environment. So, the importance of system thinking in this exploration is that in order to move from the general claim that we developed to the precise mathematical statements, we needed to isolate the system of hot and cold water as much as possible.
Physics student, Spring 2016
In three of the four experiments discussed, the cold water did not change temperature quite as much as expected. This was a consistent effect, suggesting that the system was not a closed system consisting only of the hot and cold water. Some of the energy from the hot water likely flowed into the surrounding air and material forming the containers rather than into warming the cold water. This flow of energy into the surroundings, rather than into the cold water, would reduce the change in temperature for the cold water.
This is an example of the development of systems thinking, that one needs to consider all elements of a system and to observe carefully what is occurring. According to the Next Generation Science Standards (NGSS Lead States, 2013), thinking about systems and systems models is common across many science disciplines as described in Appendix G – Crosscutting Concepts (https://www.nextgenscience.org/resources/ngss-appendices ).
What seems remarkable is that the ratios found in these experiments can be so close, given how simple the equipment and procedures are. We have not asked students to take the next step of doing multiple trials of each experiment in order to estimate uncertainties. The emphasis in this course has been on fostering conceptual understanding of the shapes of qualitative graphs while briefly modeling here a quantitative approach to looking for patterns in the data. With limited time available, our choice has been to balance this experimentally obtained insight about the inverse relationship between the amounts of hot and cold water and their changes in temperature with one based on theoretical considerations.