
1.10: Historical and Current Variations of Capitalism
- Page ID
- 6217
\( \newcommand{\vecs}[1]{\overset { \scriptstyle \rightharpoonup} {\mathbf{#1}} } \)
\( \newcommand{\vecd}[1]{\overset{-\!-\!\rightharpoonup}{\vphantom{a}\smash {#1}}} \)
\( \newcommand{\dsum}{\displaystyle\sum\limits} \)
\( \newcommand{\dint}{\displaystyle\int\limits} \)
\( \newcommand{\dlim}{\displaystyle\lim\limits} \)
\( \newcommand{\id}{\mathrm{id}}\) \( \newcommand{\Span}{\mathrm{span}}\)
( \newcommand{\kernel}{\mathrm{null}\,}\) \( \newcommand{\range}{\mathrm{range}\,}\)
\( \newcommand{\RealPart}{\mathrm{Re}}\) \( \newcommand{\ImaginaryPart}{\mathrm{Im}}\)
\( \newcommand{\Argument}{\mathrm{Arg}}\) \( \newcommand{\norm}[1]{\| #1 \|}\)
\( \newcommand{\inner}[2]{\langle #1, #2 \rangle}\)
\( \newcommand{\Span}{\mathrm{span}}\)
\( \newcommand{\id}{\mathrm{id}}\)
\( \newcommand{\Span}{\mathrm{span}}\)
\( \newcommand{\kernel}{\mathrm{null}\,}\)
\( \newcommand{\range}{\mathrm{range}\,}\)
\( \newcommand{\RealPart}{\mathrm{Re}}\)
\( \newcommand{\ImaginaryPart}{\mathrm{Im}}\)
\( \newcommand{\Argument}{\mathrm{Arg}}\)
\( \newcommand{\norm}[1]{\| #1 \|}\)
\( \newcommand{\inner}[2]{\langle #1, #2 \rangle}\)
\( \newcommand{\Span}{\mathrm{span}}\) \( \newcommand{\AA}{\unicode[.8,0]{x212B}}\)
\( \newcommand{\vectorA}[1]{\vec{#1}} % arrow\)
\( \newcommand{\vectorAt}[1]{\vec{\text{#1}}} % arrow\)
\( \newcommand{\vectorB}[1]{\overset { \scriptstyle \rightharpoonup} {\mathbf{#1}} } \)
\( \newcommand{\vectorC}[1]{\textbf{#1}} \)
\( \newcommand{\vectorD}[1]{\overrightarrow{#1}} \)
\( \newcommand{\vectorDt}[1]{\overrightarrow{\text{#1}}} \)
\( \newcommand{\vectE}[1]{\overset{-\!-\!\rightharpoonup}{\vphantom{a}\smash{\mathbf {#1}}}} \)
\( \newcommand{\vecs}[1]{\overset { \scriptstyle \rightharpoonup} {\mathbf{#1}} } \)
\(\newcommand{\longvect}{\overrightarrow}\)
\( \newcommand{\vecd}[1]{\overset{-\!-\!\rightharpoonup}{\vphantom{a}\smash {#1}}} \)
\(\newcommand{\avec}{\mathbf a}\) \(\newcommand{\bvec}{\mathbf b}\) \(\newcommand{\cvec}{\mathbf c}\) \(\newcommand{\dvec}{\mathbf d}\) \(\newcommand{\dtil}{\widetilde{\mathbf d}}\) \(\newcommand{\evec}{\mathbf e}\) \(\newcommand{\fvec}{\mathbf f}\) \(\newcommand{\nvec}{\mathbf n}\) \(\newcommand{\pvec}{\mathbf p}\) \(\newcommand{\qvec}{\mathbf q}\) \(\newcommand{\svec}{\mathbf s}\) \(\newcommand{\tvec}{\mathbf t}\) \(\newcommand{\uvec}{\mathbf u}\) \(\newcommand{\vvec}{\mathbf v}\) \(\newcommand{\wvec}{\mathbf w}\) \(\newcommand{\xvec}{\mathbf x}\) \(\newcommand{\yvec}{\mathbf y}\) \(\newcommand{\zvec}{\mathbf z}\) \(\newcommand{\rvec}{\mathbf r}\) \(\newcommand{\mvec}{\mathbf m}\) \(\newcommand{\zerovec}{\mathbf 0}\) \(\newcommand{\onevec}{\mathbf 1}\) \(\newcommand{\real}{\mathbb R}\) \(\newcommand{\twovec}[2]{\left[\begin{array}{r}#1 \\ #2 \end{array}\right]}\) \(\newcommand{\ctwovec}[2]{\left[\begin{array}{c}#1 \\ #2 \end{array}\right]}\) \(\newcommand{\threevec}[3]{\left[\begin{array}{r}#1 \\ #2 \\ #3 \end{array}\right]}\) \(\newcommand{\cthreevec}[3]{\left[\begin{array}{c}#1 \\ #2 \\ #3 \end{array}\right]}\) \(\newcommand{\fourvec}[4]{\left[\begin{array}{r}#1 \\ #2 \\ #3 \\ #4 \end{array}\right]}\) \(\newcommand{\cfourvec}[4]{\left[\begin{array}{c}#1 \\ #2 \\ #3 \\ #4 \end{array}\right]}\) \(\newcommand{\fivevec}[5]{\left[\begin{array}{r}#1 \\ #2 \\ #3 \\ #4 \\ #5 \\ \end{array}\right]}\) \(\newcommand{\cfivevec}[5]{\left[\begin{array}{c}#1 \\ #2 \\ #3 \\ #4 \\ #5 \\ \end{array}\right]}\) \(\newcommand{\mattwo}[4]{\left[\begin{array}{rr}#1 \amp #2 \\ #3 \amp #4 \\ \end{array}\right]}\) \(\newcommand{\laspan}[1]{\text{Span}\{#1\}}\) \(\newcommand{\bcal}{\cal B}\) \(\newcommand{\ccal}{\cal C}\) \(\newcommand{\scal}{\cal S}\) \(\newcommand{\wcal}{\cal W}\) \(\newcommand{\ecal}{\cal E}\) \(\newcommand{\coords}[2]{\left\{#1\right\}_{#2}}\) \(\newcommand{\gray}[1]{\color{gray}{#1}}\) \(\newcommand{\lgray}[1]{\color{lightgray}{#1}}\) \(\newcommand{\rank}{\operatorname{rank}}\) \(\newcommand{\row}{\text{Row}}\) \(\newcommand{\col}{\text{Col}}\) \(\renewcommand{\row}{\text{Row}}\) \(\newcommand{\nul}{\text{Nul}}\) \(\newcommand{\var}{\text{Var}}\) \(\newcommand{\corr}{\text{corr}}\) \(\newcommand{\len}[1]{\left|#1\right|}\) \(\newcommand{\bbar}{\overline{\bvec}}\) \(\newcommand{\bhat}{\widehat{\bvec}}\) \(\newcommand{\bperp}{\bvec^\perp}\) \(\newcommand{\xhat}{\widehat{\xvec}}\) \(\newcommand{\vhat}{\widehat{\vvec}}\) \(\newcommand{\uhat}{\widehat{\uvec}}\) \(\newcommand{\what}{\widehat{\wvec}}\) \(\newcommand{\Sighat}{\widehat{\Sigma}}\) \(\newcommand{\lt}{<}\) \(\newcommand{\gt}{>}\) \(\newcommand{\amp}{&}\) \(\definecolor{fillinmathshade}{gray}{0.9}\)Historical & Current Variations of Capitalism
Every country worries about economic growth. In the United States and other high-income countries, the question is whether economic growth continues to provide the same remarkable gains in our standard of living as it did during the twentieth century. Meanwhile, can middle-income countries like South Korea, Brazil, Egypt, or Poland catch up to the higher-income countries? Must they remain in the second-tier of per capita income? Of the world’s population of roughly 6.7 billion people, about 2.6 billion are scraping by on incomes that average less than $2 per day. This is not that different from the standard of living 2,000 years ago. Can the world’s poor be lifted from their fearful poverty? As the 1995 Nobel laureate in economics, Robert E. Lucas Jr., once noted: “The consequences for human welfare involved in questions like these are simply staggering: Once one starts to think about them, it is hard to think about anything else.”
Universal Generalizations
- Despite a multitude of variations, many countries consider themselves to be capitalist.
Guiding Questions
- What significant factors have contributed to a specific country's (for example, Japan's) economic growth and development?
- What has been the positive international impact created by additional nations moving toward a free market economy?
Economic Growth
Dramatic improvements in a nation’s standard of living are possible. After the Korean War in the late 1950s, the Republic of Korea, often called South Korea, was one of the poorest economies in the world. Most South Koreans worked in peasant agriculture. According to the British economist Angus Maddison, whose life’s work was the measurement of GDP and population in the world economy, GDP per capita in 1990 international dollars was $854 per year. From the 1960s to the early twenty-first century, a time period well within the lifetime and memory of many adults, the South Korean economy grew rapidly. Over these four decades, GDP per capita increased by more than 6% per year. According to the World Bank, GDP for South Korea now exceeds $30,000 in nominal terms, placing it firmly among high-income countries like Italy, New Zealand, and Israel. Measured by total GDP in 2012, South Korea is the thirteenth-largest economy in the world. For a nation of 49 million people, this transformation is extraordinary.
South Korea is a standout example, but it is not the only case of rapid and sustained economic growth. Other nations of East Asia like Thailand and Indonesia, have seen very rapid growth as well. China has grown enormously since market-oriented economic reforms were enacted around 1980. GDP per capita in high-income economies like the United States also has grown dramatically albeit over a longer time frame. Since the Civil War, the U.S. economy has been transformed from a primarily rural and agricultural economy to an economy based on services, manufacturing, and technology.
The Relatively Recent Arrival of Economic Growth
Let’s begin with a brief overview of the spectacular patterns of economic growth around the world in the last two centuries. This time period is commonly referred to as the period of modern economic growth. Rapid and sustained economic growth is a relatively recent experience for the human race. Before the last two centuries, although rulers, nobles, and conquerors could afford some extravagances and although economies rose above the subsistence level, the average person’s standard of living had not changed much for centuries.
Progressive, powerful economic and institutional changes started to have a significant effect in the late eighteenth and early nineteenth-centuries. According to the Dutch economic historian Jan Luiten van Zanden, slavery-based societies, favorable demographics, global trading routes, and standardized trading institutions that spread with different empires set the stage for the Industrial Revolution to succeed. The Industrial Revolution refers to the widespread use of power-driven machinery and the economic and social changes that resulted in the first half of the 1800s. Ingenious machines—the steam engine, the power loom, and the steam locomotive—performed tasks that otherwise would have taken vast numbers of workers to complete. The Industrial Revolution began in Great Britain and soon spread to the United States, Germany, and other countries.
The jobs for ordinary people working with these machines were often dirty and dangerous by modern standards, but the alternative jobs of that time in peasant agriculture and small-village industry were often dirty and dangerous, too. The new jobs of the Industrial Revolution typically offered higher pay and a chance for social mobility. A self-reinforcing cycle began: New inventions and investments generated profits, the profits provided funds for new investment and inventions, and the investments and inventions provided opportunities for further profits. Slowly, a group of national economies in Europe and North America emerged from centuries of sluggishness into a period of rapid modern growth. During the last two centuries, the average rate of growth of GDP per capita in the leading industrialized countries has averaged about 2% per year. What were times like before then?
Read the following feature for the answer.
Angus Maddison, a quantitative economic historian, led the most systematic inquiry into national incomes before 1870. His methods recently have been refined and used to compile GDP per capita estimates from year 1 C.E. to 1348. Table 1 is an important counterpoint to most of the narrative in this chapter. It shows that nations can decline as well as rise. The declines in income are explained by a wide array of forces, such as epidemics, natural and weather-related disasters, the inability to govern large empires, and the remarkably slow pace of technological and institutional progress. Institutions are the traditions, laws, and so on by which people in a community agree to behave and govern themselves. Such institutions include marriage, religion, education, and laws of governance. Institutional progress is the development and codification of these institutions to reinforce social order, and thus, economic growth.
One example of such an institution is the Magna Carta (Great Charter), which the English nobles forced King John to sign in 1215. The Magna Carta codified the principles of due process, whereby a free man could not be penalized unless his peers had made a lawful judgment against him. This concept was later adopted by the United States in its own constitution. This social order may have contributed to England’s GDP per capita in 1348, which was second to that of northern Italy.
In the study of economic growth, a country’s institutional framework plays a critical role. Table 1 also shows relative global equality for almost 1,300 years. After this, we begin to see a significant divergence in income (not shown in table).
| Year | Northern Italy | Spain | England | Holland | Byzantium | Iraq | Egypt | Japan |
| 1 | $800 | $600 | $600 | $600 | $700 | $700 | $700 | - |
| 730 | - | - | - | - | - | $920 | $730 | $402 |
| 1000 | - | - | - | - | $600 | $820 | $600 | - |
| 1150 | - | - | - | - | $580 | $680 | $660 | $520 |
| 1280 | - | - | - | - | - | - | $670 | $527 |
| 1300 | $1,588 | $864 | $892 | - | - | - | $610 | - |
| 1348 | $1,486 | $907 | $919 | - | - | - | - | - |
GDP Per Capita Estimates in Current International Dollars from AD 1 to 1348(Source: Bolt and van Zanden. “The First Update of the Maddison Project. Re-Estimating Growth Before 1820.” 2013)
Another fascinating and underreported fact is the high levels of income, compared to others at that time, attained by the Islamic Empire Abbasid Caliphate—which was founded in present-day Iraq in 730 C.E. At its height, the empire spanned large regions of the Middle East, North Africa, and Spain until its gradual decline over 200 years.
The Industrial Revolution led to increasing inequality among nations. Some economies flourished, whereas others, like many of those in Africa or Asia, remained close to a subsistence standard of living. General calculations show that the 17 countries of the world with the most developed economies had, on average, 2.4 times the GDP per capita of the world’s poorest economies in 1870. By 1960, the most developed economies had 4.2 times the GDP per capita of the poorest economies.
However, by the middle of the twentieth century, some countries had shown that catching up was possible. Japan’s economic growth took off in the 1960s and 1970s, with a growth rate of real GDP per capita averaging 11% per year during those decades. Certain countries in Latin America experienced a boom in economic growth in the 1960s as well. In Brazil, for example, GDP per capita expanded by an average annual rate of 11.1% from 1968 to 1973. In the 1970s, some East Asian economies, including South Korea, Thailand, and Taiwan, saw rapid growth. In these countries, growth rates of 11% to 12% per year in GDP per capita were not uncommon. More recently, China, with its population of 1.3 billion people, grew at a per capita rate 9% per year from 1984 into the 2000s. India, with a population of 1.1 billion, has shown promising signs of economic growth, with growth in GDP per capita of about 4% per year during the 1990s and climbing toward 7% to 8% per year in the 2000s.
These waves of catch-up economic growth have not reached all shores. In certain African countries like Niger, Tanzania, and Sudan, for example, GDP per capita at the start of the 2000s was still less than $300, not much higher than it was in the nineteenth century and for centuries before that. In the context of the overall situation of low-income people around the world, the good economic news from China (population: 1.3 billion) and India (population: 1.1 billion) is, nonetheless, astounding and heartening.
Economic growth in the last two centuries has made a striking change in the human condition. In 2000 Richard Easterlin, an economist at the University of Southern California, wrote:
By many measures, a revolution in the human condition is sweeping the world. Most people today are better fed, clothed, and housed than their predecessors two centuries ago. They are healthier, live longer, and are better educated. Women’s lives are less centered on reproduction and political democracy has gained a foothold. Although Western Europe and its offshoots have been the leaders of this advance, most of the less developed nations have joined in during the 20th century, with the newly emerging nations of sub-Saharan Africa the latest to participate. Although the picture is not one of universal progress, it is the greatest advance in the human condition of the world’s population ever achieved in such a brief span of time.
Rule of Law and Economic Growth
Economic growth depends on many factors. Key among those factors is adherence to the rule of law and protection of property rights and contractual rights by a country’s government so that markets can work effectively and efficiently. Laws must be clear, public, fair, enforced, and equally applicable to all members of society. Property rights, are the rights of individuals and firms to own property and use it as they see fit. If you have $100, you have the right to use that money, whether you spend it, lend it, or keep it in a jar. It is your property. The definition of property includes physical property as well as the right to your training and experience, especially since your training is what determines your livelihood. The use of this property includes the right to enter into contracts with other parties with your property. Individuals or firms must own the property to enter into a contract.
Contractual rights, then, are based on property rights and they allow individuals to enter into agreements with others regarding the use of their property providing recourse through the legal system in the event of noncompliance. One example is the employment agreement: a skilled surgeon operates on an ill person and expects to get paid. Failure to pay would constitute a theft of property by the patient; that property being the services provided by the surgeon. In a society with strong property rights and contractual rights, the terms of the patient–surgeon contract will be fulfilled because the surgeon would have recourse through the court system to extract payment from that individual. Without a legal system that enforces contracts, people would not be likely to enter into contracts for current or future services because of the risk of non-payment. This would make it difficult to transact business and would slow economic growth.
The World Bank considers a country’s legal system effective if it upholds property rights and contractual rights. The World Bank has developed a ranking system for countries’ legal systems based on effective protection of property rights and rule-based governance using a scale from 1 to 6, with 1 being the lowest and 6 the highest rating. In 2012, the world average ranking was 2.9. The three countries with the lowest ranking of 1.5 were Afghanistan, the Central African Republic, and Zimbabwe; their GDP per capita was $1,000, $800, and $600 respectively. Afghanistan is cited by the World Bank as having a low standard of living, weak government structure, and lack of adherence to the rule of law, which has stymied its economic growth. The landlocked Central African Republic has poor economic resources as well as political instability and is a source of children used in human trafficking. Zimbabwe has had declining growth since 1998. Land redistribution and price controls have disrupted the economy, and corruption and violence have dominated the political process. Although global economic growth has increased, those countries lacking a clear system of property rights and an independent court system free from corruption have lagged far behind.
Since the early nineteenth century, there has been a spectacular process of long-run economic growth during which the world’s leading economies—mostly those in Western Europe and North America—expanded GDP per capita at an average rate of about 2% per year. In the last half-century, countries like Japan, South Korea, and China have shown the potential to catch up. The extensive process of economic growth, often referred to as modern economic growth, was facilitated by the Industrial Revolution, which increased worker productivity and trade, as well as the development of governance and market institutions.
The Diversity of Countries and Economies across the World
The national economies that make up the global economy are remarkably diverse. Let us use one key indicator of the standard of living, GDP per capita, to quantify this diversity. You will quickly see that quantifying this diversity is fraught with challenges and limitations. As explained in The Macroeconomic Perspective, we must consider using purchasing power parity or “international dollars” to convert average incomes into comparable units. Purchasing power parity, as formally defined in Exchange Rates and International Capital Flows, takes into account the fact that prices of the same good are different across countries.
The Macroeconomic Perspective explained how to measure GDP, the challenges of using GDP to compare standards of living, and the difficulty of confusing economic size with distribution. In China's case, for example, China ranks as the second largest global economy, second to only the United States, with Japan being third. But, when we take China's GDP of $9.2 trillion and divide it by its population of 1.4 billion, then the per capita GDP is only $6,900, which is significantly lower than that of Japan, at $38,500, and that of the United States, at $52,800. Measurement issues aside, it’s worth repeating that the goal, then, is to not only increase GDP, but to strive toward increased GDP per capita to increase overall standards of living for individuals. As we have learned from Economic Growth, this can be achieved at the national level by designing policies that increase worker productivity, deepen capital, and advance technology.
GDP per capita also allows us to rank countries into high-, middle-, or low-income groups. Low-income countries are those with $1,025 per capita GDP per year; middle-income countries have a per capita GDP between $1,025 and $12,475; while high-income countries have over $12,475 per year per capita income. As seen in Table 2 and Figure 1, high-income countries earn 68% of world income but represent just 12% of the global population. Low-income countries earn 1% of total world income but represent 18.5% of global population.
| Ranking based on GDP/capita | GDP (in billions) | % of Global GDP | Population | % of Global Population |
| Low income ($1,025 or less) | $612.7 | 0.8% | 848,700,000 | 11.8% |
| Middle income ($1,025 - $12,475) | $23,930 | 31.7% | 4,970,000,000 | 69.4% |
| High income (more than $12,475) | $51,090,000,000 | 67.5% | 1,306,000,000 | 18.8% |
| World Total income | $75,592,941 | 7,162,119,434 |
Source:http://databank.worldbank.org/data/v...=series&pid=20)
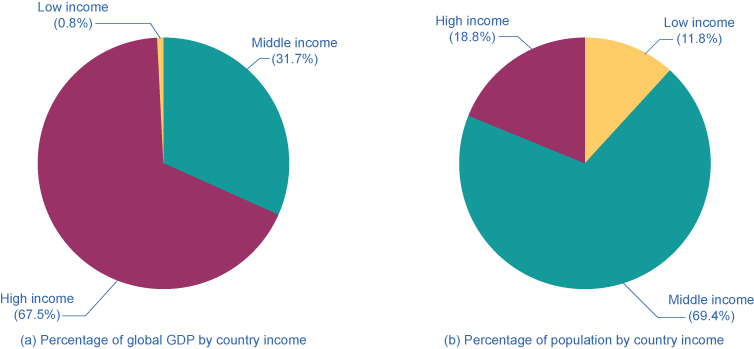
The pie charts show the GDP (from 2011) for countries categorized into low, middle, or high income. Low-income are those earning less than $1,025 (less than 1% of global income). They represent 18.5% of the world population. Middle-income countries are those with per capita income of $1,025–$12,475 (31.1% of global income). They represent 69.5% of world population. High-income countries have 68.3% of global income and 12% of the world’s population.
An overview of the regional averages of GDP per person for developing countries, measured in comparable international dollars as well as the population in 2008 (Figure 2), shows that the differences across these regions are stark. As Table 3 shows, nominal GDP per capita in 2012 for the 581.4 million people living in Latin America and the Caribbean region was $9,190, which far exceeds that of South Asia and sub-Saharan Africa. In turn, people in the high-income nations of the world, such as those who live in the European Union nations or North America, have a per capita GDP three to four times that of the people of Latin America. To put things in perspective, North America and the European Union have slightly more than 9% of the world’s population, but they produce and consume close to 70% of the world’s GDP.
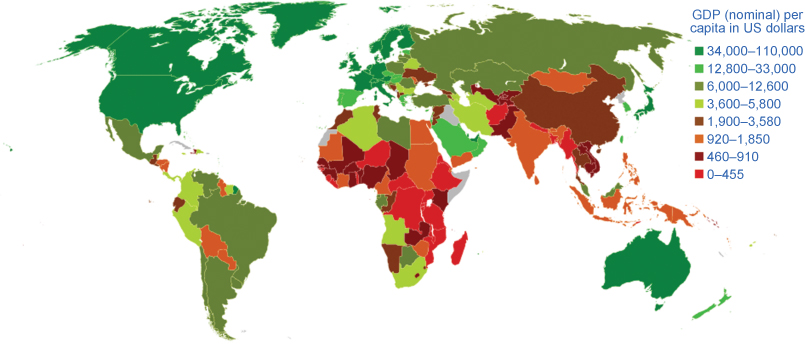
There is a clear imbalance in the GDP across the world. North America, Australia, and Western Europe have the highest GDPs while large areas of the world have dramatically lower GDPs. (Credit: modification of work by Bsrboy/Wikimedia Commons)
| Population in Millions | GDP Per Capita | |
| East Asia and Pacific | 2,006 | $5,536 |
| South Asia | 1,671 | $1,482 |
| Sub-Saharan Africa | 936.1 | $1,657 |
| Latin America and Caribbean | 588 | $9,536 |
| Middle East and North Africa | 345.4 | $3,456 |
| Europe and Central Asia | 272.2 | $7,118 |
Such comparisons between regions are admittedly rough. After all, per capita GDP cannot fully capture the quality of life. Many other factors have a large impact on the standard of living, like health, education, human rights, crime and personal safety, and environmental quality. These measures also reveal very wide differences in the standard of living across the regions of the world. Much of this is correlated with per capita income, but there are exceptions. For example, life expectancy at birth in many low-income regions approximates those who are more affluent. The data also illustrate that nobody can claim to have perfect standards of living. For instance, despite very high-income levels, there is still undernourishment in Europe and North America.
The differences in economic statistics and other measures of well-being, substantial though they are, do not fully capture the reasons for the enormous differences between countries. Aside from the neoclassical determinants of growth, four additional determinants are significant in a wide range of statistical studies and are worth mentioning: geography, demography, industrial structure, and institutions.
Geographic and Demographic Differences
Countries have geographic differences: some have extensive coastlines, some are landlocked. Some have large rivers that have been a path of commerce for centuries, or mountains that have been a barrier to trade. Some have deserts, some have rain forests. These differences create different positive and negative opportunities for commerce, health, and the environment.
Countries also have considerable differences in the age distribution of the population. Many high-income nations are approaching a situation by 2020 or so in which the elderly will form a much larger share of the population. Most low-income countries still have a higher proportion of youth and young adults, but by about 2050, the elderly populations in these low-income countries are expected to boom as well. These demographic changes will have a considerable impact on the standard of living of the young and the old.
Differences in Industry Structure and Economic Institutions
Countries have differences in industry structure. In the high-income economies of the world, only about 2% of GDP comes from agriculture; the average for the rest of the world is 12%. Countries have strong differences in degree of urbanization.
Countries also have strong differences in economic institutions: some nations have economies that are extremely market-oriented, while other nations have command economies. Some nations are open to international trade, while others use tariffs and import quotas to limit the impact of trade. Some nations are torn by long-standing armed conflicts; other nations are largely at peace. There are differences in political, religious, and social institutions as well.
No nation intentionally aims for a low standard of living, high rates of unemployment and inflation, or an unsustainable trade imbalance. However, nations will differ in their priorities and in the situations in which they find themselves, and so their policy choices can reasonably vary, too. The next modules will discuss how nations around the world, from high income to low income, approach the four macroeconomic goals of economic growth, low unemployment, low inflation, and a sustainable balance of trade.
Macroeconomic policy goals for most countries strive toward low levels of unemployment and inflation, as well as stable trade balances. Countries are analyzed based on their GDP per person and ranked as low-, middle-, and high-income countries. Low-income are those earning less than $1,025 (less than 1%) of global income. They currently have 18.5% of the world population. Middle-income countries are those with per capita income of $1,025–$12,475 (31.1% of global income). They have 69.5% of world population. High-income countries are those with per capita income greater than $12,475 (68.3% of global income). They have 12% of the world’s population. Regional comparisons tend to be inaccurate because even countries within those regions tend to differ from each other.

Answer the self check questions below to monitor your understanding of the concepts in this section.
Self Check Questions
- Go online and research the Japanese economy. Identify some of the similarities and differences between the U.S. and Japan. Who do you believe has a stronger economy? Why? Defend your answer.
- Go online and research one of the Asian Tigers (Hong Kong, Singapore, Taiwan, South Korea). Why are they called Asian Tigers? How are their economies compared to other Asian nations and the U.S.?