
5.8: Investing in the Stock Market
- Page ID
- 1728
\( \newcommand{\vecs}[1]{\overset { \scriptstyle \rightharpoonup} {\mathbf{#1}} } \)
\( \newcommand{\vecd}[1]{\overset{-\!-\!\rightharpoonup}{\vphantom{a}\smash {#1}}} \)
\( \newcommand{\id}{\mathrm{id}}\) \( \newcommand{\Span}{\mathrm{span}}\)
( \newcommand{\kernel}{\mathrm{null}\,}\) \( \newcommand{\range}{\mathrm{range}\,}\)
\( \newcommand{\RealPart}{\mathrm{Re}}\) \( \newcommand{\ImaginaryPart}{\mathrm{Im}}\)
\( \newcommand{\Argument}{\mathrm{Arg}}\) \( \newcommand{\norm}[1]{\| #1 \|}\)
\( \newcommand{\inner}[2]{\langle #1, #2 \rangle}\)
\( \newcommand{\Span}{\mathrm{span}}\)
\( \newcommand{\id}{\mathrm{id}}\)
\( \newcommand{\Span}{\mathrm{span}}\)
\( \newcommand{\kernel}{\mathrm{null}\,}\)
\( \newcommand{\range}{\mathrm{range}\,}\)
\( \newcommand{\RealPart}{\mathrm{Re}}\)
\( \newcommand{\ImaginaryPart}{\mathrm{Im}}\)
\( \newcommand{\Argument}{\mathrm{Arg}}\)
\( \newcommand{\norm}[1]{\| #1 \|}\)
\( \newcommand{\inner}[2]{\langle #1, #2 \rangle}\)
\( \newcommand{\Span}{\mathrm{span}}\) \( \newcommand{\AA}{\unicode[.8,0]{x212B}}\)
\( \newcommand{\vectorA}[1]{\vec{#1}} % arrow\)
\( \newcommand{\vectorAt}[1]{\vec{\text{#1}}} % arrow\)
\( \newcommand{\vectorB}[1]{\overset { \scriptstyle \rightharpoonup} {\mathbf{#1}} } \)
\( \newcommand{\vectorC}[1]{\textbf{#1}} \)
\( \newcommand{\vectorD}[1]{\overrightarrow{#1}} \)
\( \newcommand{\vectorDt}[1]{\overrightarrow{\text{#1}}} \)
\( \newcommand{\vectE}[1]{\overset{-\!-\!\rightharpoonup}{\vphantom{a}\smash{\mathbf {#1}}}} \)
\( \newcommand{\vecs}[1]{\overset { \scriptstyle \rightharpoonup} {\mathbf{#1}} } \)
\( \newcommand{\vecd}[1]{\overset{-\!-\!\rightharpoonup}{\vphantom{a}\smash {#1}}} \)
\(\newcommand{\avec}{\mathbf a}\) \(\newcommand{\bvec}{\mathbf b}\) \(\newcommand{\cvec}{\mathbf c}\) \(\newcommand{\dvec}{\mathbf d}\) \(\newcommand{\dtil}{\widetilde{\mathbf d}}\) \(\newcommand{\evec}{\mathbf e}\) \(\newcommand{\fvec}{\mathbf f}\) \(\newcommand{\nvec}{\mathbf n}\) \(\newcommand{\pvec}{\mathbf p}\) \(\newcommand{\qvec}{\mathbf q}\) \(\newcommand{\svec}{\mathbf s}\) \(\newcommand{\tvec}{\mathbf t}\) \(\newcommand{\uvec}{\mathbf u}\) \(\newcommand{\vvec}{\mathbf v}\) \(\newcommand{\wvec}{\mathbf w}\) \(\newcommand{\xvec}{\mathbf x}\) \(\newcommand{\yvec}{\mathbf y}\) \(\newcommand{\zvec}{\mathbf z}\) \(\newcommand{\rvec}{\mathbf r}\) \(\newcommand{\mvec}{\mathbf m}\) \(\newcommand{\zerovec}{\mathbf 0}\) \(\newcommand{\onevec}{\mathbf 1}\) \(\newcommand{\real}{\mathbb R}\) \(\newcommand{\twovec}[2]{\left[\begin{array}{r}#1 \\ #2 \end{array}\right]}\) \(\newcommand{\ctwovec}[2]{\left[\begin{array}{c}#1 \\ #2 \end{array}\right]}\) \(\newcommand{\threevec}[3]{\left[\begin{array}{r}#1 \\ #2 \\ #3 \end{array}\right]}\) \(\newcommand{\cthreevec}[3]{\left[\begin{array}{c}#1 \\ #2 \\ #3 \end{array}\right]}\) \(\newcommand{\fourvec}[4]{\left[\begin{array}{r}#1 \\ #2 \\ #3 \\ #4 \end{array}\right]}\) \(\newcommand{\cfourvec}[4]{\left[\begin{array}{c}#1 \\ #2 \\ #3 \\ #4 \end{array}\right]}\) \(\newcommand{\fivevec}[5]{\left[\begin{array}{r}#1 \\ #2 \\ #3 \\ #4 \\ #5 \\ \end{array}\right]}\) \(\newcommand{\cfivevec}[5]{\left[\begin{array}{c}#1 \\ #2 \\ #3 \\ #4 \\ #5 \\ \end{array}\right]}\) \(\newcommand{\mattwo}[4]{\left[\begin{array}{rr}#1 \amp #2 \\ #3 \amp #4 \\ \end{array}\right]}\) \(\newcommand{\laspan}[1]{\text{Span}\{#1\}}\) \(\newcommand{\bcal}{\cal B}\) \(\newcommand{\ccal}{\cal C}\) \(\newcommand{\scal}{\cal S}\) \(\newcommand{\wcal}{\cal W}\) \(\newcommand{\ecal}{\cal E}\) \(\newcommand{\coords}[2]{\left\{#1\right\}_{#2}}\) \(\newcommand{\gray}[1]{\color{gray}{#1}}\) \(\newcommand{\lgray}[1]{\color{lightgray}{#1}}\) \(\newcommand{\rank}{\operatorname{rank}}\) \(\newcommand{\row}{\text{Row}}\) \(\newcommand{\col}{\text{Col}}\) \(\renewcommand{\row}{\text{Row}}\) \(\newcommand{\nul}{\text{Nul}}\) \(\newcommand{\var}{\text{Var}}\) \(\newcommand{\corr}{\text{corr}}\) \(\newcommand{\len}[1]{\left|#1\right|}\) \(\newcommand{\bbar}{\overline{\bvec}}\) \(\newcommand{\bhat}{\widehat{\bvec}}\) \(\newcommand{\bperp}{\bvec^\perp}\) \(\newcommand{\xhat}{\widehat{\xvec}}\) \(\newcommand{\vhat}{\widehat{\vvec}}\) \(\newcommand{\uhat}{\widehat{\uvec}}\) \(\newcommand{\what}{\widehat{\wvec}}\) \(\newcommand{\Sighat}{\widehat{\Sigma}}\) \(\newcommand{\lt}{<}\) \(\newcommand{\gt}{>}\) \(\newcommand{\amp}{&}\) \(\definecolor{fillinmathshade}{gray}{0.9}\)Investing in the Stock Market
As stated earlier, the rate of return on a financial investment in a share of stock can come in two forms: as dividends paid by the firm and as a capital gain achieved by selling the stock for more than you paid. The range of possible returns from buying a stock is mind-bending. Firms can decide to pay dividends or not. A stock price can rise to a multiple of its original price or sink all the way to zero. Even in short periods of time, well-established companies can see large movements in the price of their stock.
Universal Generalizations
- Equities, or stocks, represent ownership of a corporation.
- The market for equities is competitive because there are a large number of buyers, sellers, and investors, with a reasonable amount of available information.
- Various things influence the price of equities.
Guiding Questions
- Where can someone go to purchase stocks?
- Why should you consider diversifying your portfolio?
Stocks
The reasons why stock prices fall and rise so abruptly will be discussed below, but first you need to know how we measure stock market performance. There are a number of different ways of measuring the overall performance of the stock market, based on averaging the stock prices of different subsets of companies. Perhaps the best-known measure of the stock markets is the Dow Jones Industrial Average, which is based on the stock prices of 30 large U.S. companies. Another gauge of stock market performance, the Standard & Poor’s 500, follows the stock prices of the 500 largest U.S. companies. The Wilshire 5000 tracks the stock prices of essentially all U.S. companies that have stock the public can buy and sell.
Stock Exchanges
There are several organized securities exchanges in the United States, as well as around the world. The securities exchanges are places where buyers and sellers meet to trade securities and stocks, or shares in a company. Those companies that want to trade their stocks to raise revenue must pay a fee to trade. Trading only takes place on the floor of the exchange.
Video: Open Outcry
The oldest, largest, and best known of the stock exchanges in the U.S. is the New York Stock Exchange (NYSE). This exchange is on Wall Street in New York City. It regulates its members and the companies that do business with the exchange. Currently there are over 1,400 seats (members) that trade at the NYSE. The largest "traders" may own several "seats". Those that are a part of the exchange elect the director, set up a governing board, and set the rules for the exchange. It is not run by the U.S. government, but it must adhere to rules created by the Securities and Exchange Commission (SEC). Rules that deal with how trading is allowed to take place. The SEC was set up to prevent another stock market crash like the one in 1929 that signaled the beginning of the Great Depression.
To learn more, visit the U.S. Securities and Exchange Commission (SEC).
The NYSE trades over 3,000 different company's stocks. Firms must meet certain size and profitability requirements to be traded on the NYSE. The NYSE is open during the week, Monday-Friday, with the exception of nine observed holidays. The "opening bell" is rung at 9:30am (ET) to mark the start of the day's trading session, the "closing bell" is rung at 4pm (ET) and trading for the day stops.
For a tutorial on how to read the financial page, visit Investopedia: Reading Financial Pages Tutorial.
To learn more about the New York Stock Exchange go to their website.
The other exchanges are regional or based on specific types of businesses that are apart of that exchange. The American Stock Exchange (AMEX) is also located in New York city but it trades only 1,000 different company stocks.The companies traded on the AMEX are smaller and more speculative (risky) than those traded on the NYSE.
Regional Stock Markets are found in Chicago, Philadelphia, Boston, and Memphis, and some smaller markets in other cities. Many of the companies in these exchanges are too small or too new to be listed on the AMEX or the NYSE. These exchanges are also located in regions where there particular companies may have a significant impact. In addition there are regional commodities markets which sell agriculture, livestock, energy, and metals.
To read additional information on commodities markets visit the Value Stock Guide.
To see a listing of commodities markets visit this List of Commodities.
Global Markets are found throughout the world from Hong Kong to Sydney, from Frankfurt to Tokyo. Technology makes it possible for trading to go on around the globe once the markets in the U.S. have closed.
NASDAQ
The National Association of Securities Dealers Automated Quotation (NASDAQ) is also a stock exchange, however the NASDAQ is the these stocks are listed as OTC, or over-the-counter market, where there is no organized "trading floor". Therefore the NASDAQ is an electronic stock market. Trades are made electronically using the internet or by placing an order with the online trade broker, who in turn forwards the order to the exchange where the trade takes place.
DJIA
The Dow-Jones Industrial Average (DJIA) is the best known measure of stock performance on the New York Stock Exchange. To see how the Dow-Jones Industrial Average is doing and how the stocks are trading today visit Market Watch.
Another way stocks can be measured is by the Standard & Poor's 500 (S&P 500). The S&P 500 averages the changes in the prices of stocks that are traded on a daily bases to determine the overall market performance of the NYSE, AMEX, and OTC markets.
"Bulls and Bears"
When the market is doing well and moving upwards, the market is a "bull". There have been a few bull markets: 1995 the DJIA broke 4000, then in 2000 it reached 12,000; currently the market is at 17,500. The opposite of a bull market is a "bear" market, where the equities move down for either several months or several years. In 1998 the market lost 1200 points and retreated from its highest points value of 9,000. Since 1998 there have been 5 other bear markets in the U.S. and 7 other global bear markets. To see a historic list of market crashes and bear markets visit this List of Market Crashes.
Other measures of stock markets focus on where stocks are traded. For example, the New York Stock Exchange monitors the performance of stocks that are traded on that exchange in New York City. The Nasdaq stock market includes about 3,600 stocks, with a concentration of technology stocks. Table 1 lists some of the most commonly cited measures of U.S. and international stock markets.
| Measure of the Stock Market | Comments |
|---|---|
| Dow Jones Industrial Average (DJIA): indexes.dowjones.com | Based on 30 large companies from a diverse set of representative industries, chosen by analysts at Dow Jones and Company. The index was started in 1896. |
| Standard & Poor’s 500: www.standardandpoors.com | Based on 500 large U.S. firms, chosen by analysts at Standard & Poor’s to represent the economy as a whole. |
| Wilshire 5000: http://www.wilshire.com | Includes essentially all U.S. companies with stock ownership. Despite the name, this index includes about 7,000 firms. |
| New York Stock Exchange: http://www.nyse.com | The oldest and largest U.S. stock market, dating back to 1792. It trades stocks for 2,800 companies of all sizes. It is located at 18 Broad St. in New York City. |
| NASDAQ: www.nasdaq.com | Founded in 1971 as an electronic stock market, allowing people to buy or sell from many physical locations. It has about 3,600 companies. |
| FTSE: http://www.ftse.com | Includes the 100 largest companies on the London Stock Exchange. Pronounced “footsie.” Originally stood for Financial Times Stock Exchange. |
| Nikkei: www.nni.nikkei.co.jp | Nikkei stands for Nihon Keizai Shimbun, which translates as the Japan Economic Journal, a major business newspaper in Japan. Index includes the 225 largest and most actively traded stocks on the Tokyo Stock Exchange. |
| DAX: http://www.exchange.de | Tracks 30 of the largest companies on the Frankfurt, Germany, stock exchange. DAX is an abbreviation for Deutscher Aktien Index. |
Some Measures of Stock Markets
The trend in the stock market is generally up over time, but with some large dips along the way. Figure 1 shows the path of the Standard & Poor’s 500 index (which is measured on the left-hand vertical axis) and the Dow Jones Index (which is measured on the right-hand vertical axis). Broad measures of the stock market, like the ones listed here, tend to move together. The S&P 500 Index is the weighted average market capitalization of the firms selected to be in the index. The Dow Jones Industrial Average is the price weighted average of 30 industrial stocks tracked on the New York Stock Exchange.
When the Dow Jones average rises from 5,000 to 10,000, you know that the average price of the stocks in that index has roughly doubled. Figure 1 shows that stock prices did not rise much in the 1970s, but then started a steady climb in the 1980s. From 2000 to 2013, stock prices bounced up and down, but ended up at about the same level.
The Dow Jones Industrial Index and the Standard & Poor’s 500, 1965–2013
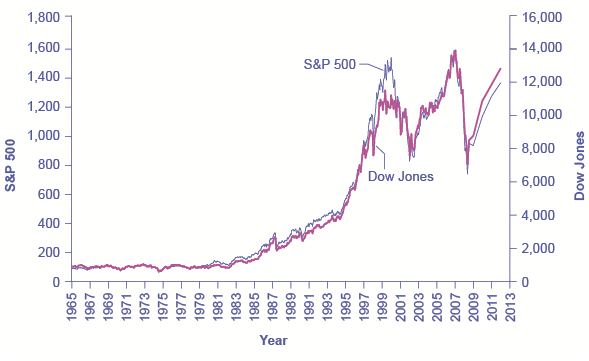
Stock prices rose dramatically from the 1980s up to about 2000. From 2000 to 2013, stock prices bounced up and down, but ended up at about the same level.
Table 2 shows the total annual rate of return an investor would have received from buying the stocks in the S&P 500 index over recent decades. The total return here includes both dividends paid by these companies and also capital gains arising from increases in the value of the stock. (For technical reasons related to how the numbers are calculated, the dividends and capital gains do not add exactly to the total return.) From the 1950s to the 1980s, the average firm paid annual dividends equal to about 4% of the value of its stock. Since the 1990s, dividends have dropped and now often provide a return closer to 1% to 2%. In the 1960s and 1970s, the gap between percent earned on capital gains and dividends was much closer than it has been since the 1980s. In the 1980s and 1990s, however, capital gains were far higher than dividends. In the 2000s, dividends remained low and, while stock prices fluctuated, they ended the decade roughly where they had started.
| Period | Total Annual Return | Capital Gains | Dividends |
|---|---|---|---|
| 1950–1959 | 19.25% | 13.58% | 4.99% |
| 1960–1969 | 7.78% | 4.39% | 3.25% |
| 1970–1979 | 5.88% | 1.60% | 4.20% |
| 1980–1989 | 17.55% | 12.59% | 4.40% |
| 1990–1999 | 18.21% | 15.31% | 2.51% |
| 2000–2009 | −1.00% | −2.70% | 1.70% |
| 2010 | 15.06% | 13.22% | 1.84% |
| 2011 | 2.11% | 0.04% | 2.07% |
| 2012 | 16.00% | 13.87% | 2.13% |
The overall pattern is that stocks as a group have provided a high rate of return over extended periods of time, but this return comes with risks. The market value of individual companies can rise and fall substantially, both over short time periods and over the long run. During extended periods of time like the 1970s or the first decade of the 2000s, the overall return on the stock market can be quite modest. The stock market can sometimes fall sharply, as it did in 2008.
The bottom line on investing in stocks is that the rate of return over time will be high, but the risks are also high, especially in the short run; liquidity is also high since stock in publicly held companies can be readily sold for spendable money.
The Tradeoffs Between Return and Risk
The discussion of financial investments has emphasized the expected rate of return, the risk, and the liquidity of each investment. Table 3 summarizes these characteristics.
| Financial Investment | Return | Risk | Liquidity |
|---|---|---|---|
| Checking account | Very low | Very little | Very high |
| Savings account | Low | Very little | High |
| Certificate of deposit | Low to medium | Very little | Medium |
| Stocks | High | Medium to high | Medium |
| Bonds | Medium | Low to medium | Medium |
| Mutual funds | Medium to high | Medium to high | Medium to high |
| Housing | Medium | Medium | Low |
| Gold | Medium | High | Low |
| Collectibles | Low to medium | High | Low |
The household investment choices listed here display a tradeoff between the expected return and the degree of risk involved. Bank accounts have very low risk and very low returns; bonds have higher risk but higher returns; and stocks are riskiest of all but have the potential for still higher returns. In effect, the higher average return compensates for the higher degree of risk. If risky assets like stocks did not also offer a higher average return, then few investors would want them.
This tradeoff between return and risk complicates the task of any financial investor: Is it better to invest safely or to take a risk and go for the high return? Ultimately, choices about risk and return will be based on personal preferences. However, it is often useful to examine risk and return in the context of different time frames.
The high returns of stock market investments refer to a high average return that can be expected over a period of several years or decades. The high risk of such investments refers to the fact that in shorter time frames, from months to a few years, the rate of return may fluctuate a great deal. Thus, a person near retirement age, who already owns a house, may prefer reduced risk and certainty about retirement income. For young workers, just starting to make a reasonably profitable living, it may make sense to put most of their savings for retirement in stocks. Stocks are risky in the short term, to be sure, but when the worker can look forward to several decades during which stock market ups and downs can even out, stocks will typically pay a much higher return over that extended period than will bonds or bank accounts. Thus, tradeoffs between risk and return must be considered in the context of where the investor is in life.
To read more about the current trading on the Commodities Market click on the link to CNN Money.

Answer the self check questions below to monitor your understanding of the concepts in this section.
Self Check Questions
- Define the term equities.
- What is portfolio diversification?
- What is the role of the stockbroker?
- What is the securities exchange?
- Name 2 major stock markets.
- List some of the regional stock exchanges. List some of the global stock exchanges. What is the OTC or over-the-counter market? What is an example of the OTC market?
- What is the Dow-Jones Industrial Average (DJIA)?
- Define the term Standard & Poor's 500 (S&P500).
- What is the difference between a bull and a bear market?
- What is the difference between a spot market and a futures market?